TOURISM AND RECREATION
CCTR2015
Istanbul Policy Center
Bankalar Caddesi No: 2 Minerva Han 34420 Karaköy, İstanbul TURKEY
PROCEEDINGS OF
THE 4
THINTERNATIONAL
CONFERENCE ON CLIMATE, TOURISM
AND RECREATION – CCTR2015
17-19 September, 2015
ORGANIZED BY SUPPORTED BY HOSTED BY İklimBU EDITORSO. CENK DEMIROĞLU, CHRIS R. DE FREITAS, DANIEL SCOTT, M. LEVENT KURNAZ, DILEK ÜNALAN
ORGANIZERS
The Commission on Climate, Tourism and Recreation (CCTR) of the International Society of Biomete-orology (ISB) was initiated during the 14th Congress of the ISB, in September 1996 in Ljubljana, Slovenia. The
aims of the CCTR are to: a) bring together researchers from around the world to critically review the current state of knowledge in tourism and recreation climatology; and b) explore possibilities for future research. Two decades on, research in tourism climatology has developed and expanded due in large part to the initiatives and activities of the CCTR and several collaborative research projects run under the auspices of the CCTR. Recent CCTR meeting highlighted the fact that, although climate is an essential part of the resource base for tourism, which is one of the world’s biggest and fastest growing industries, little is known about the effects of climate on tourists choices and broad demand patterns, or the influence climate has on the commercial prospects and sustainability of tourism operators and destinations.
Istanbul Policy Center (IPC) is an independent policy research institute with global outreach. Its mission is to
foster academic research in social sciences and its application to policy making. The IPC team is firmly committed to providing decision-makers, opinion leaders, academics, and the general public with innovative and objective analyses in key domestic and foreign policy issues. IPC has expertise in a wide range of areas, including – but not exhaustive to – Turkey-EU-U.S. relations, education, climate change, current trends of political and social transformation in Turkey, as well as the impact of civil society and local governance on this metamorphosis.
The Mercator-IPC Fellowship Program is the cornerstone of the IPC-Sabancı University-Stiftung Mercator
Initiative. The program aims to strengthen the academic, political, and social ties between Turkey and Germany, as well as Turkey and Europe, by facilitating excellent scientific research and hands-on policy work. It is based on the belief that in an increasingly globalized world, the acquisition of knowledge and an exchange of ideas and people are the preconditions for meeting the challenges of the 21st century.
The Sustainable Development Solutions Network (SDSN) was commissioned by UN Secretary-General
Ban Ki-moon in 2012 to mobilize scientific and technical expertise from academia, civil society, and the private sector to support practical problem solving for sustainable development at local, national, and global scales. The SDSN operates national and regional networks of knowledge institutions, solution-focused thematic networks, and is building SDSNedu, an online university for sustainable development. The Turkish SDSN is established in June 2014 and led by Bogazici University. It aims to serve as a platform for universities, research centers, NGOs, business community, government institutions and other stakeholders for the exchange of expertise on sustainable development, to generate research, applied projects and policy proposals.
The Center for Climate Change and Policy Studies of Bogazici University (IklimBU) is a research center
mainly studying the science and effects of climate change. IklimBU also provides solutions to climate change and environmental problems and offers policy advice to the public.
Bogazici University Applied Tourism and Research Centre (ATARC) was founded in 1994 as a centre directly
under the University’s Rectorate. The objectives of the ATARC centre are to carry out research, to provide educational programmes to the tourism sector, to organize conferences and meetings on hospitality and tourism topics, and to provide consultancy services to the sector.ATARC is one of the education centres of the World Tourism Organization (UNWTO). Under this structure, the centre, in cooperation with the UNWTO, organizes international meetings, carries out consultancy and provides national and international education programmes.
SUPPORTED BY
TSKB
Established in 1950, TSKB provides support for sustainable economic development of Turkey. TSKB offers its clients a wide array of products and services in corporate banking, investment banking and advisory business lines. TSKB operates in continuous cooperation with leading participants of the global markets and suprana-tional financial institutions. TSKB provides long term funding for medium and large scale investment projects by creating corporate strategies focusing on Turkey’s economic potential. TSKB also provides private advisory services tailored for the client’s needs. Having integrated the economic, social and environmental dimensions of its globally accepted sustainability practices, TSKB supports the business world for the transition to a low carbon economy and more efficient production level. TSKB, which has been deemed worthy of the Financial Times and IFC ‘Sustainable Banking of the Year’ award three times in a row, has been awarded at the Corporate Management Summit thanks to the just, transparent and accountable corporate management it has shown since 2011. TSKB, which is the first Turkish bank to obtain an ISO 14001 Environmental Management System certifi-cate, published the first GRIA+ approved sustainability report in the finance sector in 2013. TSKB also maintains its characteristic of being the first carbon neutral bank in Turkey, by offsetting its carbon footprint, since 2008. TSKB conducts its business through its head office in Istanbul and branches in Ankara and İzmir.
HOSTED BY
This proceeding has been proofread by IPC's Managing Editor Megan Gisclon. The cover visual is created by Kadir Kara.
r o y a l h o t e l
Attila Kovács University of Szeged, Hungary
Azade Özlem Çalık Ankara University, Turkey
Bas Amelung Wageningen University, the Netherlands
Bruno Abegg alpS – Centre for Climate Change Adaptation, Austria
University of Innsbruck, Austria
Cana Tülüş Istanbul Policy Center, Turkey
Carolien Kroeze Wageningen University, the Netherlands
Caroline Larrivée Ouranos, Canada
Chris de Freitas University of Auckland, New Zealand
Clotilde Dubois Météo France
Daniel Scott University of Waterloo, Canada
Dede Krishnadianty World Wide Fund for Nature Indonesia
Deniz Türkoğlu Ankara University, Turkey
Diler Yılmaz Istanbul University, Turkey
Duygu Erten Istanbul Medipol University, Turkey
Elena Grigorieava Russian Academy of Sciences, Russia
Enrique Moran-Tejeda Pyrenean Institute of Ecology, Spain
Eric Jover Snow and Mountain Research Center of Andorra
Eva Hagsten Statistics Sweden
F. López-Martín Gobierno de Aragón, Spain
Gabriella Szépszó University of Szeged, Hungary
Ghislain Dubois TEC Conseil, France
Gökhan Karaatlı Valparaiso University, USA
Gürel Çetin Istanbul University, Turkey
Mid Sweden University, Sweden
İbrahim Birkan Atılım University, Turkey
János Unger Hungarian Meteorological Service, Hungary
Janto Simon Hess ADAPTOUR, Germany
Jean Paul Ceron University of Limoges, France
Johannes T. Welling University of Iceland
Juan Ignacio López-Moreno Pyrenean Institute of Ecology, Spain
Kate Germain Université du Québec à Montréal, Canada
Laurent Vanat Vanat Consulting, Switzerland
Leandra Jaenicke University of Innsbruck, Austria
Lidija Srnec Meteorological and Hydrological Service, Croatia
Lyudmila N. Derkacheva Far Eastern Federal University, Russia
M. Levent Kurnaz Boğaziçi University, Turkey
UN Sustainable Development Solutions Network Turkey
M. Tufan Turp Boğaziçi University, Turkey
Marc Pons Sustainability Observatory of Andorra
Universitat Politècnica de Catalunya, Spain
Maria Dolores Frias University of Cantabria, Spain
Instituto de Física de Cantabria, Spain
Maria Gilaberte-Búrdalo Universidad San Jorge, Spain
Martin Falk Austrian Institute of Economic Research, Austria
Masatoshi Tanaka Fukushima Medical University, Japan
Michelle Rutty University of Waterloo, Canada
Mike Peters University of Innsbruck, Austria
Musa Pınar Valparaiso University, USA
Muzaffer Uysal Virginia Polytechnic Institute and State University, USA
Natalya F. Soboleva Far Eastern Federal University, Russia
Nazan An Boğaziçi University, Turkey
Òscar Saladié Rovira i Virgili University, Spain
Osman Cenk Demiroğlu Istanbul Bilgi University, Turkey
Istanbul Policy Center, Turkey Boğaziçi University, Turkey
Paul Stampfl alpS – Centre for Climate Change Adaptation, Austria
Peter Johnson University of Waterloo, Canada
Rainer Unger alpS - Centre for Climate Change Adaptation, Austria
Raquel Santos-Lacueva Rovira i Virgili University, Spain
Renata Sokol Jurkovic Meteorological and Hydrological Service, Croatia
Robert Steiger University of Innsbruck, Austria
Rosa Pino-Otín Universidad San Jorge, Spain
Salvador Clavé Rovira i Virgili University, Spain
Sixto Herrera Instituto de Física de Cantabria, Spain
Stéphanie Bleau Ouranos, Canada
Tuğba Öztürk Işık University, Turkey
Viachaslau Filimonau Bournemouth University, UK
CONTENTS
FOREWORD 11
C. de Freitas & D. Scott
WEATHER/CLIMATE AND TOURISM/RECREATION RELATIONSHIP 13
Acclimatization Thermal Strain Index for Tourism (ATSIT): a means for assessing human health impacts of travel between contrasting climates
E. A. Grigorieva & C. de Freitas 15
An inter-comparison of the Holiday Climate Index (HCI) and the Tourism Climate Index (TCI) in Europe
D. Scott, M. Rutty & B. Amelung 17
Tourism climate indices: uncertainties and reliability issues
G. Dubois, J. P. Ceron, C. Dubois, M. D. Frias & H. Sixto 19
Human behavior as a measure of the significance and appeal of climate for tourism
C. de Freitas 20
The climate comfort conditions in terms of tourism in Turkey’s Göller (Lakes) District
Y. Güçlü 25
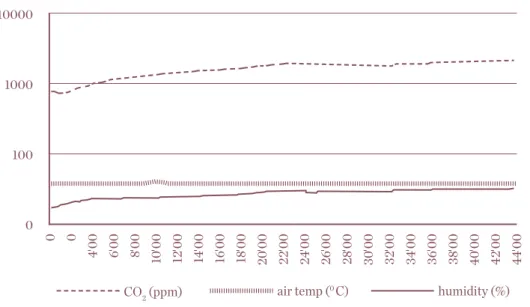
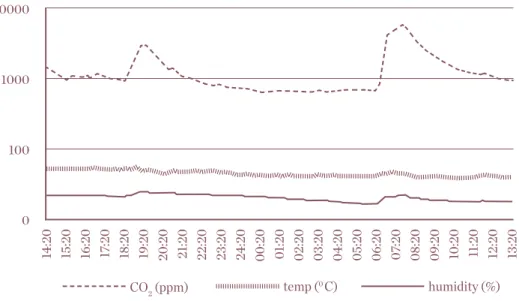
Indoor air quality, air temperature and humidity in narrow/airtight spaces
M. Tanaka 36
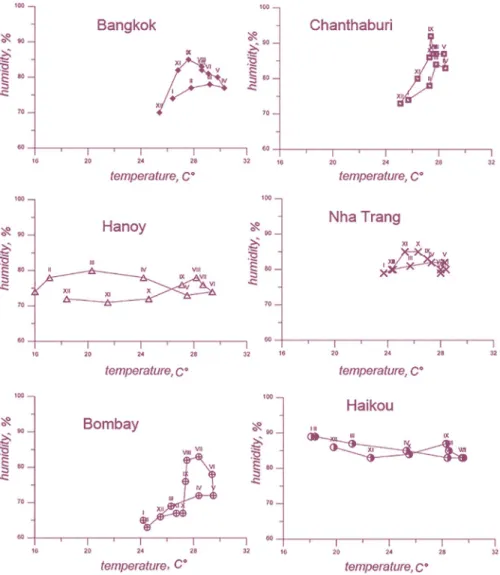
Weather - climatic conditions as a risk factor in medical and health tourism and measures of prevention of adaptive loads during interregional movements
L. N. Derkacheva & N. F. Soboleva 39
Examining domestic vs. international climatic preferences for coastal tourism
M. Rutty & D. Scott 43
Importance of early snowfall for Swedish ski resorts: evidence based on monthly data
M. Falk 47
Weather preferences and sensitivity of alpine skiers
R. Steiger, M. Peters & B. Abegg 52
Impact of snow conditions on overnight stays in cross-country skiing areas
M. Falk & E. Hagsten 57
Temporal analysis of climatic and snow variables related with ski reliability in the central Pyrenees (Spain and Andorra)
M. Gilaberte-Búrdalo, J. I. López-Moreno, F. López-Martín, E. Moran-Tejeda, R. Pino-Otín 60
Weather preferences of summer tourists in mountain environments: a case study in the Bavarian Alps, Germany
Observed changes in the tourism climate potential of the Lake Balaton Region based on the second generation Climate Index for Tourism (CIT)
Á. Németh 77
How will climate change affect the climate potential of tourism in Croatia?
K. Zaninovic, L. Srnec & R. S. Jurkovic 82
Glacier tourism and climate change: perception and adaptive responses to climate change from glacier tour operators of the Vatnajökull region, Iceland
J. T. Welling 86
The combined impact of climate change and eutrophication on Southeast Asia’s suitability for coastal tourism
A. Guijt, B. Amelung & C. Kroeze 92
Climate change and cultural heritage
D. Yilmaz, T. Ozturk & M. L. Kurnaz 93
Climate change vulnerability of ski resorts in the Pyrenees and adaptation strategies: from the local perspective to the regional scale
M. Pons, E. Jover & J. I. Lopez-Moreno 94
Impact of climate change on ski resorts in the Balkans, the Middle East and the Caucasus: a preliminary assessment for ski tourism in Northeast Turkey
O. C. Demiroglu, M. T. Turp, T. Ozturk & M. L. Kurnaz 99
Questioning Witmer’s 100 Days Rule for snow reliability analyses
O. C. Demiroglu & N. An 103
Misunderstanding and obfuscation of snow reliability and snow guarantee
O. C. Demiroglu 105
Assessing the future climate vulnerability of United States ski tourism regions using an analogue approach
M. Rutty & D. Scott 108
An integrated assessment of the resilience of Ontario (Canada) ski tourism to climate variability and change
TOURISM, RECREATION AND CLIMATE CHANGE ADAPTATION 113
Including tourism enterprises to finance climate change adaptation: exploring the potential in small island developing states
J. S. Hess 115
Challenges in climate change adaptation: the case of Alpine winter tourism
B. Abegg & R. Steiger 119
Returns on investment in snowmaking facilities: evidence for French ski lift operators
M. Falk & L. Vanat 124
Preparing tourism activities for climate change adaptation in Quebec, Canada
S. Bleau, C. Larrivée & K. Germain 127
Can stakeholders’ perceptions determine destinations vulnerability to climate change? The case of Riviera Maya
R. Santos-Lacueva, S. A. Clavé & Ò. Saladié 129
Stakeholder viewpoints on climate change and ski tourism development in Turkey
O. C. Demiroglu, C. Tulus & G. Cetin 135
TOURISM, RECREATION AND CLIMATE CHANGE MITIGATION 137
Carbon labelling of restaurant menus and its impact on consumer decision-making
V. Filimonau 139
Hotels with green building certifications: case studies from Turkey
D. Erten 140
Effectiveness of program of activities of the UNFCCC in shaping green tourism: the case of Bali, Indonesia
D. Krishnadianty 142
A holistic approach to modelling energy consumption and carbon footprint of an alpine tourism destination: the case of Alpbach, Austria
R. Unger, B. Abegg & P. Stampfl 143
Current and future GHG emissions of tourism from Brazilians
J. P. Ceron & G. Dubois 145
Perceptions of climate change on the tourism industry: comparisons of Blue Flag vs. non-Blue Flag hotels in Turkey
M. Pınar, İ. Birkan, M. Uysal & G. Karaatlı 147
What to do about climate change for sustainable tourism: the case of Turkey
FOREWORD
Chris R. de Freitas
Co-chair, International Society of Biometeorology (ISB) Commisson on Climate, Tourism and Recreation (CCTR) School of Environment, University of Auckland, New Zealand.
Daniel Scott
Co-chair, International Society of Biometeorology (ISB) Commisson on Climate, Tourism and Recreation (CCTR) Department of Geography & Environmental Management, University of Waterloo, Canada
The Commission on Climate, Tourism and Recreation (CCTR) of the International Society of Biometeorology (ISB) was initiated during the
14th Congress of the ISB, in September 1996 in
Ljubljana, Slovenia by Chris de Freitas (Univer-sity of Auckland, New Zealand) and Andreas Matzarakis (University of Freiberg, Germany). At the time the stated aims of the CCTR were to: a) bring together researchers from around the world to critically review the current state of knowledge in tourism and recreation climatology, and b) explore possibilities for future research. Two decades on, research in tourism climatology has developed and expanded due in large part to the initiatives and activities of the CCTR, including a 2009 White Paper for the World Meteorological Organization on Weather and Climate Information for Tourism and several collaborative research projects run under the auspices of the CCTR.
There have been four international meetings of CCTR, with the first in Halkidiki in northern Greece during October 2001. CCTR2015 is the fourth of these meetings, in all attended by delegates from Australia, Austria, Bulgaria, Canada, Croatia, Germany, Greece, New Zealand, Poland, United Kingdom, United States, Russia, Lithuania, Japan, Romania, and Switzerland and representing fields of expertise that include climatology, thermal comfort and heat balance modelling, climate change impact assessment, tourism marketing and planning, urban and landscape planning and economics of tourism climatology. The first CCTR meeting highlighted
the fact that, although climate is an essential part of the resource base for tourism, which is one of the world’s biggest and fastest growing industries, little is known about a) the effects of climate on tourists choices and broad demand patterns or b) the influ-ence climate has on the commercial prospects and sustainability of tourism operators and destinations. The meeting identified several research themes that warrant attention:
• Better understanding of what climate-related in-formation is required by tourists and the tourism industry.
• The need to explore the distinction between im-pacts of climate on tourists versus the impact on the tourism industry.
• The need to assess the role of weather and lon-ger term expectations of climate on destination choices.
• To identify what climate related-criteria people use to make decisions about tourism choices. • Determine how climate information products are
currently used by the tourism industry.
• Identify the sort of climate information required by the tourism sector.
• The need for a tourism climate index that inte-grates all facets of climate, uses standard data, and is objectively tested and verified.
Figure 1 depicts the key themes conceptually. The fourth meeting of the CCTR reveals that progress in understanding the complexities of these themes has advanced, but key knowledge gaps remain in each theme. The content of this volume showcases new perspectives and methods in studying climate–tourism relationships that have evolved since the CCTR was established. What stands out in this volume is the diversification of research that demonstrates how multidisciplinary the field of tourism climatology has become over the past two decades. A growing interest in knowl-edge mobilization and interaction with potential end-users is an important direction for research and practice. The new collaborations that have emerged from previous CCTR meetings and the impressive contributions from emerging scholars
highlight the tremendous prospects for this rapidly advancing field of research.
Figure 1: Current climate-tourism relationships: themes and issues
Contribution of climate change to tourism
Climate change vs. climate variability
Climate as a natural resource for tourism
Tourism climate indices
Effects of climate variability on demand
Advisory services for climatic adaptation of
tourists Identify critical threshold
values of climate-based tourism indicators
Weather and climate as limiting
WEATHER/CLIMATE AND
TOURISM/RECREATION
ACCLIMATIZATION THERMAL STRAIN INDEX FOR TOURISM (ATSIT): A MEANS FOR ASSESSING HUMAN HEALTH IMPACTS OF TRAVEL BETWEEN CONTRASTING CLIMATES
E. A. Grigorieva and C. R. de Freitas
Heat and cold stress can seriously affect a person’s performance and health and potentially reduce tolerance for other environmental hazards. Assessment of thermal stress is important in many outdoor, work-related, sporting, and recreational situations and military scenarios. Travellers in particular are often exposed to thermal conditions that are quite different to those at home. There is an important period following arrival during which an unacclimatized individual experiences an adjustment process that can affect his/her physi-ological wellbeing. The consequences depend to a large degree on the magnitude and duration of the acclimatization.
During acclimatization to heat or cold, the body experiences additional thermally induced physio-logical strain. The first signs show up in the respi-ratory organs because respiration is a continuous heat exchange process in which the body is in close and direct contact with the ambient air. There are no behavioral or other adjustments to prevent the ambient air entering into the body’s core area through the respiratory tract. The Acclimatization Thermal Strain Index (ATSI) was developed earlier to quantify the acclimatization thermal loading (ATL) on respiratory organs until full adaptation is achieved (de Freitas & Grigorieva, 2009, 2014). The aim here is to further develop the ATSI scheme to produce an index called the Acclimatization Thermal Strain Index for Tourism (ATSIT) to quantify the consequences for tourists. ATSIT is the standardized ratio of the difference between thermal strain at the traveler’s home location to
that experienced at the trip destination during a one to two week adjustment period. To illustrate the utility of ATSIT, the consequences for tourists travelling internationally between contrasting climates are examined. The relative adjustment stress is ranked across a range of travel destinations and seasons.
The potential adjustment cost in acclimatization cannot be accurately determined from a straight-forward comparison of climatic conditions. ATSIT allows one to quantify the impact of adapting to changed conditions. The results show that the relationship is not straightforward. Adjusting to cold comes with greater physiological strain than adjusting to heat, with the biggest acclimatization impact coming with a change of location from hot-humid to cold-dry climatic conditions. It is possible that travelers may suffer serious conse-quences unless appropriate measures are taken to avoid severe discomfort or harm.
The approach used here has a variety of uses. ATSIT projections allow travelers to anticipate the degree of discomfort they might experience at a new loca-tion during acclimatizaloca-tion. The scheme could be employed to assess risks due to increases in short-term thermal variability in weather conditions such as encountered during heat waves and cold snaps. The information could be useful for assessing the need for public health services and measures that might be used to help mitigate impacts. The ulti-mate goal is to test the scheme over the full range of climatic types that occur globally and to develop the
results into a standardized typology of contrasting climatic groupings. It would provide a comprehen-sive coverage of different combinations and ranges of thermal-moisture climatic types with a view to identifying seasonal and geographical patterns globally.
References
de Freitas, C. R. & Grigorieva, E. A. (2009). The Acclimatization Thermal Strain Index: a preliminary study of the methodology applied to climatic conditions of the Russian Far East.
Interna-tional Journal of Biometeorology, 53: 307-315.
de Freitas, C.R. & Grigorieva, E. A. (2014). The impact of ac-climatization on thermophysio-logical strain for contrasting regional climates. International Journal of Biometeorology, 58: 2129-2137.
AN INTER-COMPARISON OF THE HOLIDAY CLIMATE INDEX (HCI) AND THE TOURISM CLIMATE INDEX (TCI) IN EUROPE
D. Scott, M. Rutty and B. Amelung
Much research has been devoted to evaluating climate as a resource or constraint for tourism, quantifying optimal or unacceptable climate conditions both generally and for specific tourism segments or activities. The most widely applied approach over the past 25 years has been the Tourism Climate Index (TCI), developed by Miec-zkowski (1985). The TCI was designed to integrate the main climatic variables relevant to tourism into a single numerical index, providing a composite measure capable of facilitating a holistic inter-pretation of destination climate, which could be used to objectively compare destinations. Despite the TCI’s wide application, it has been subject to substantial critique (de Freitas et al. 2008). A central limitation of the TCI is that the variable ratings and sub-component weighting scheme were subjectively based on Meiczkowski’s expert opinion and are not empirically tested against the actual preferences of tourists (Scott & McBoyle 2001, de Freitas 2003, Gomez-Martin 2006). Because the TCI was devised to represent the weather conditions for “sightseeing,” it is insensitive to the large variety of weather requirements of tourism segments in diverse destinations (e.g., beach, urban, mountain). The TCI was developed over 30 years ago before digital climate data was widely available, and so it utilized monthly climate means and did not adequately consider the variability or probability of key weather conditions. The TCI also over-empha-sizes the thermal component (compared to tourist stated preferences) and neglects the possibility of the over-riding effect of physical (i.e., rain, wind) and aesthetic (i.e., sunshine, cloud cover)
parameters (de Freitas et al. 2008, Scott et al. 2008, Rutty and Scott 2010, 2013). Despite these known limitations, a large number of TCI based studies continue to be undertaken around the world (see e.g. Nicholls & Amelung 2015, Amelung & Nicholls 2014, Perch-Nielsen et al. 2010).
To overcome the above noted limitations of the TCI, a Holiday Climate Index (HCI) was developed to more accurately assess the climatic suitability of destinations for tourism. The word “holiday” was chosen to better reflect what the index was designed for (i.e., leisure tourism), since tourism is much broadly defined as “a social, cultural and economic phenomenon which entails the movement of people to countries or places outside their usual environment for personal or business/professional purposes” (UNWTO, 2008). A major advancement of the HCI is that its variable rating scales and the component weighting system are based on the liter-ature of tourists’ stated climatic preferences that has developed over the last decade (e.g., Scott et al. 2008, Moreno 2010, Rutty & Scott 2010, 2013). The HCI utilizes daily data and estimates both average monthly index ratings and probabilities of selected rating categories that are most important for tourist decision-making (i.e., excellent/ideal versus poor/ unacceptable). The HCI is consistent with the conceptual design recommended by de Freitas et al. (2008) and thus accounts for the overriding effect of physical variables (wind and rain). The rating system of the HCI has also been designed to be highly interpretable by tourists, as well as facilitate scientific comparisons with existing climate indices for leisure tourism (including the TCI).
This paper will discuss the design of the HCI, including a summary of multi-national tourist climate preference surveys, and how the limitations of the TCI were overcome. It then presents the results of the HCI which was designed specifically for urban destinations (HCI-urban) and for beach destinations (HCI-beach) for a geographically diverse sample of European destinations (15 urban and 15 beach/coastal). The paper also compares the rating of climate resources by the HCI and the TCI (as originally specified by Mieczkowski 1985) at these study areas. The index inter-comparison illustrates how the HCI-urban rates the climate of many cities higher than the TCI, particularly in shoulder seasons and the winter months, which is more consistent with observed visitation patterns. The differential ratings by the HCI-beach and the TCI are far more pronounced for beach tourism, because the specific conditions sought by tourists are the foundation of the HCI-beach design, and thereby, the HCI-beach index is a more robust representation of coastal tourists perceptions and experiences. The results empirically demonstrate that use of the Mieczkowski (1985) TCI should be discontinued.
References
Amelung, B. & Nicholls, S. (2014). Implications of climate change for tourism in Australia. Tourism Management, 41: 228-244. de Freitas, C. R. (2003). Tourism climatology: evaluating envi-ronmental information for decision making and business plan-ning in the recreation and tourism sector. International Journal
of Biometeorology, 48: 45-54.
de Freitas C. R., Scott, D., McBoyle, G. (2008). A second genera-tion climate index for tourism (CIT): specificagenera-tion and verifica-tion. International Journal of Biometeorology, 52: 399-407. Gomez-Martin, M. A. (2006). Climate potential and tourist de-mand in Catalonia (Spain) during the summer season. Climate
Research, 32: 75-87.
Mieczkowski, Z. (1985). The tourism climate index: a method of evaluating world climates for tourism. Canadian Geographer, 29: 220-233.
Moreno, A. (2010). Mediterranean tourism and climate (change): a survey-based study. Tourism Planning and
Develop-ment, 7: 253-265.
Nicholls, S. & Amelung, B. (2015). Implications of climate change for rural tourism in the Nordic region based on application of the tourism climatic index. Scandinavian Journal of Hospitality and
Tourism, 15: 48-72.
Perch-Nielsen, S., Amelung, B. & Knutti, R. (2010). Future cli-mate resources for tourism in Europe based on the daily Tourism Climatic Index. Climatic Change, 103: 363-381.
Rutty, M. & Scott, D. (2010). Will the Mediterranean become “too hot” for tourism? A Reassessment. Tourism Planning and
Development, 7: 267-281.
Rutty, M. & Scott, D. (2013). Differential climate preferences of international beach tourists. Climate Research, 57: 259-269. Scott, D. & McBoyle, G. (2001). Using a ‘tourism climate index’ to examine the implications of climate change for climate as a natural resource for tourism. In Matzarakis, A. & de Freitas, C. (eds) Proceedings of the 1st International Workshop on Climate,
Tourism and Recreation (pp. 69-98). International Society of
Biometeorology, Commission on Climate, Tourism and Recre-ation, Halkidiki, Greece.
Scott, D., Gössling, S. & de Freitas, C. (2008). Climate preferenc-es for tourism: evidence from Canada, New Zealand and Sweden.
Climate Research, 38: 61-73.
Scott, D., Hall, C.M., Gössling, S. (2012). Tourism and Climate
Change: Impacts, Adaptation and Mitigation. Routledge,
Lon-don.
UNWTO (2008). Understanding Tourism: Basic Glossary. Avail-able online at http://dtxtq4w60xqpw.cloudfront.net/sites/all/ files/docpdf/glossaryenrev.pdf
TOURISM CLIMATE INDICES: UNCERTAINTIES AND RELIABILITY ISSUES
G. Dubois, J. P. Ceron, C. Dubois, M. D. Frias and H. Sixto
Abstract
Tourism climate indices (TCI) are commonly used to describe the climate conditions suitable for tourism activities from the planning, investment, or daily operations perspectives. A substantial amount of research has been carried out, in partic-ular with respect to new TCI formulae adapted to specific tourism products and parameters and their weighting, taking into account surveys on the stated preferences of tourists, especially in terms of comfort. This paper illustrates another field of research that seeks to better understand the different sources of uncertainty associated with TCIs. Indeed, slight differences in formula thresh-olds, variations in computation methods, and also the use of multimodel ensembles create nuances that affect the ways in which TCI projections are usually presented. Firstly, we assess the impact of differences in preference surveys on the definition of TCI thresholds, in particular for thermal comfort. Secondly, we compare computation methods for France, showing the need to better specify detailed data sources and their use to ensure the comparability of results. Thirdly, using multimodel ensembles for the Mediterranean basin, we assess the uncertainty inherent in long-term projections, which are used in modelling the economic impact of climate change. This paper argues in favor of a more cautious use of tourism comfort indices, with more consideration given to the robustness of data (vali-dation, debiasing, uncertainty assessment, etc.) and users’ needs, from the climate services perspective.
Keywords
Climate, Tourism, Indices, Preferences, Mediterra-nean, Uncertainty, Downscaling, Climate Services
Acknowledgments
This paper was written by a team participating in the EU FP7 project CLIM-RUN “Climate Local Information in the Mediterranean Region, Responding to Users’ Needs” (2011-2014). The CLIM-RUN project aimed at developing a better understanding of the interaction between users and producers of climate services in order to help define Mediterranean climate service networks. CLIM-RUN developed a bottom-up protocol directly involving stakeholders early in the process with the aim of identifying well defined needs on the regional and local scales. Improved modelling and downscaling tools were then used to respond to these specific needs in an optimal way.
HUMAN BEHAVIOR AS A MEASURE OF THE SIGNIFICANCE AND APPEAL OF CLIMATE FOR TOURISM
C. R. de Freitas
Introduction
From its inception, biometeorology has been concerned with the effects of climate (incorporating weather) on humans through physical processes that directly affect the body and through psycho-logical processes that determine human perception of climatic conditions and, thus, human behavioral response to those conditions. One determinant of behavioral response relates to homeothermy, which determines that ultimately heat produced by the body equals heat lost to the environment over time. During this balancing process, net heat transfer can be radically influenced by voluntary behavior. Thus thermal perception drives behavioral response that in turn reveals human preferences. But humans respond to more than just the thermal bioclimate; consequently, what climatic preferences are can be hard to pin down. Individuals react to the thermal component of the climatic environment, embracing the combined effects of air temperature, wind, humidity, and solar radiation; others respond to variables that are entirely physical (e.g. rain) or aesthetic (e.g. cloud cover and “sunny skies”), while most respond to some combination of all three (de Freitas 1990). Objectively determining what the various climate limits are or how various facets of the atmospheric environment come together to give meaning to diverse and sundry arrays of weather types is not a simple matter. But understanding what they are is important as climate is a dominant attribute of a tourist destination and has a major effect on tourism demand and satisfaction.
Human behavior reflects an unwillingness to endure climatic conditions that are considered
to be unpleasant. It also reflects what climate preferences are. This is especially useful given the multi-faceted nature of atmospheric environment and the complex way humans deal with these facets in combination.
Role of behavior
Weather is widely considered to influence people’s behavior (Persinger 1980; Watson 2000), but research on the topic is surprisingly limited (Ciucci et al. 2013). Generally speaking, behavioral traits reveal how individuals adapt or adjust to changes in the atmospheric environment. They are learned reactions that are often easy to interpret. For instance, the amount of clothing worn is, to a point, an indicator a thermal environmental stress. The reciprocal is the insulation required to offset cold stress and maintain comfort. In the context of the atmospheric environmental conditions, behavioral choice is a learned reaction based on perception and experience that reveals preferences in so far as they are motivated by a desire to maximize satisfaction and pleasure.
On-site behavior and participation numbers can be used as a measure of human sensitivity to and satisfaction of weather and climate conditions (de Freitas 2003). The approach is an alternative to using an ex situ study of tourist climate preferences, where a questionnaire survey is administered in a controlled setting and respondents can express their perceived satisfaction with a wide range of climate conditions. The approach examines onsite actions of individuals experiencing conditions firsthand. It is a manifestation of how individuals
react, adapt, or adjust, which can be interpreted objectively. Compared to subjective verbal response (e.g. questionnaire) data, behavioral reactions to climate are separate and independent indicators of on-site experience. Auliciems and de Dear (1997: 71) describe this as field investigation using “real” people engaged in “real” tasks and interacting with “real” environments rather than highly contrived experiments.
Given that recreation and tourism are voluntary and involve pursuits in which individuals freely engage for personal satisfaction or pleasure, the behavior of those involved in leisure activity reflect climate preferences. Participation will only occur if the potential participant perceives the atmospheric condition to be suitable. The voluntary and discre-tionary nature of tourism means that participation will decrease as discomfort and dissatisfaction increase. Thus satisfaction affects participation, which can be taken as a measure of demand for the climatic resource, the so-called “demand factor” (de Freitas 2003). Examples of indicators of demand in this context are visitation or attendance numbers and hotel/motel occupancy or hotel “tourist nights.” The climate or weather circumstances to which the tourist may react or respond (i.e. those that affect decisions) are 1) conditions anticipated by the tourist (gleaned from weather or climate forecasts, travel brochures, etc.) and 2) on-site weather. They can be identified and assessed using “demand indicators” (de Freitas 2003). There are two categories of methods that have been used for assembling data on human response to climate and, thus, the demand for the climate resources: 1) assess conditional behavior by using, say, questionnaires or images to determine how people react or think, which includes assessing the influence or role of weather or climate forecasts; 2) examine onsite experience. Since individuals are experiencing conditions firsthand, this is a more reliable method than questionnaires and interviews. Ideally, the
approach must be activity-specific. And it is best not to lump all tourism together but to deal with specific categories of activities, either a) active or b) passive.
In the current research, the focus is on highly climate-sensitive activities of “sun, sea, and sand” (3S) tourism. An ocean beach situation is selected for study not only because beach recreation is highly weather sensitive but also because beach users are normally concentrated in a relatively small area. For this reason, sample populations can be readily observed largely free of the problems associated with subjects confined to laboratories, classrooms, or artificial settings. The compact area also facilitates on-site monitoring of atmospheric and associated environmental variables represen-tative of ambient conditions. Another important reason is that individual beach recreation occasions are, for large groups of participants, single purpose. For participants, recreational aims or objectives of the occasion are often similar. Also, for a wide range of common on-site behavioral adjustments to atmospheric conditions, there are only a few possible motives. From a research standpoint these characteristics offer a relatively controlled situ-ation. The purpose here is to extend earlier work by examining behavioral responses that modify, enhance, or simply make manifest the effects of the atmospheric environment on people (de Freitas 2015). The data is then used to identify and inter-pret climate preferences.
Method
Biometeorological preference studies commonly use controlled groups of people. Reasons for this include ease of data collection where large samples are required or the need to control environmental conditions. Clearly, data drawn from naturally functioning systems is more desirable so as to avoid errors in data associated with the artificial nature of experimental or laboratory conditions. In the
current investigation, the beach provided a fixed, naturally bounded area for the implementation of sampling and monitoring procedures with the convenience of a controlled population but with the qualities of a naturally functioning system where data could be gathered easily and unobtrusively. The study area is the Sunshine Coast, a tourist and recreational area in Southeast Queensland, Australia, located approximately 150 km north of the city of Brisbane. The climate is subtropical.
The study site is the popular King’s Beach (26o48’
S, 153o9’ E), Caloundra. On-site observations were
made during the daylight hours of 48 weekdays over a 12-month period, with a minimum of three observation days for each month. Data from 179 observations were selected from this to obtain a cross-section of weather conditions. The atmo-spheric variables measured on site are solar radia-tion, longwave radiaradia-tion, air temperature, vapour pressure, wind speed, cloud cover, type and amount, and sand surface temperature. Details of micro-climatological instruments used, the monitoring schedule, the range of environmental conditions encountered during field observations, body-en-vironment energy balance modelling procedure applied, and rationale for the scheme are given by de Freitas (1985, 1990, 2003). Details of the weather rating scheme employed, its theoretical basis, and testing are given by de Freitas et al. (2008).
There are at least six ways in which an individual can adapt, adjust, or react behaviorally: a) avoid areas of unfavorable weather-determined condi-tions; b) change activity to suit weather conditions so as to maximize enjoyment of the outdoor expe-rience; c) extend or reduce length of stay; d) use structural or mechanical aids (shade umbrellas, wind breaks, etc.); e) adjust thermal insulation of body (clothing); and f) adopt passive acceptance. With these options in mind, data were collected for the variables in Table 1.
On-site behavioral data was assembled within two categories based on a fixed format observation schedule. Data within the first category was based on observations at approximately 30-minute inter-vals of characteristics of the total beach population. As is common in Australia, beach users located within a portion of the beach and water opposite delimited by code flags are provided with on-the-spot life-saving and shark watch services. Conse-quently, in excess of 90 percent of the beach user population was normally confined to a specific part of the beach providing a relatively compact area on which the observer could focus. It is relatively easy to scan other parts of the beach for details of the rest of the population. It is possible, therefore, to assemble data based on total population, even for large attendance numbers rather than that based on data gathered from sample sectors of the beach. The second category of observational data involved continuous monitoring of the behavioral patterns of selected beach users for the duration of their visit.
Results and Conclusions
The results show that behavior is a reliable indicator of the significance of weather conditions. Behav-ioral traits reflect how people react and provide objective response criteria for tolerances and thresholds to augment questionnaire and verbal response assessments. The results indicate that certain behavioral adjustments, most notably the use of shade umbrellas, windbreaks, and possibly increased frequency of swims taken, serve to reduce the beach user’s sensitivity to on-site atmospheric conditions, although stated preferences as regards beach weather remain the same. In the absence of ideal conditions, an individual can create, to a point, a personal microclimate that is acceptable. Other adjustments such as the use of clothing insulation, reduced frequency of swims, and modified posture appear to be less acceptable since they offset the individual’s enjoyment of the beach recreational experience (sunbathing, swimming, etc.).
The results illustrate that optimum thermal condi-tions for S3 tourism appear to be located in the zone of vasomotor regulation against heat (“warm” on the ASHRAE scale) rather than at the point of minimum stress or thermal neutrality. Sensitivity to thermal conditions appears to be greatest in the zone of moderate thermal stress. The immediate thermal environment of the beach user is the main contributing factor to assessments of the overall desirability of on-site weather conditions, followed by cloud cover and wind. Rainfall events of half-hour duration or longer have an overriding effect resulting in ratings dropping to their lowest levels. Cloud cover (sunshine) is the main aesthetic
vari-able. High wind at speeds in excess of 6 m s-1 have
a direct physical effect on the beachgoer as well as an indirect effect stemming from the annoyance caused by blowing sand. Generally, ideal atmo-spheric conditions are those that are “warm” in the presence of scattered cloud (0.3 cover) and with
wind speeds of less than 6 m s-1.
A large amount of recreation research has been concerned with assessing recreation “demand,” mainly used to estimate the attractiveness of environmental attributes. The most commonly used demand indicator is attendance (visitation) data. The results here suggest attendance is likely a poor measure of demand. Allocation of leisure time, or time spent on site per visit (duration of visit), is a more accurate measure of user response and preference. Similar sensitivity associations are reflected in behavioral responses.
Behavioral characteristics and patterns are reliable indicators of the significance of “tourism climate.” They provide objective response criteria to cali-brate, supplement, and validate questionnaire (descriptive) response scales related to a wide range of atmospheric phenomena. The results show that climate conditions within the broad zone of accept-ability are those that the beach user can readily cope with or effectively modify. Certain
adjust-ments such as the use of shading devices, clothing, and windbreaks substantially affect the immediate thermal environment and, thus, the thermophys-iological state of the individual. Optimal thermal conditions appear to be those requiring no specific adjustment or behavioral fine-tuning. In general terms, attendance levels reflect the outer limits of acceptability of the meteorological environment, while duration of visit enables calibration of levels of approval insofar as it reflects ratings of on-site conditions within the broad zone of tolerance. In a broad theoretical sense, the results of this research add to an understanding of the relation-ship between weather and human behavior. The findings highlight the close relationship between weather and tourism, in particular those aspects that relate to tourist sensitivity to weather. Weather preferences are clearly identified and some light is shed on the merits of using attendance figures as indicators of demand. Clearly, behavioral data is to be preferred over subjective assessments of user satisfaction and preferences. Collectively, this information is potentially useful in effective tourism management and planning. Information proved by studies such as this could be used for forecasting the level of beach-use during the year to prepare for the provision of tourist resources and facilities, water safety services, and site conserva-tion. The results imply that tourism planning should incorporate more than simple, general descriptions of climate and weather. The same applies in the case of communicating climate information and descriptions used in weather forecasts. Various authorities may have to improve their networks of meteorological observatories and data gathered and provide better access to information. The focus should be on the climate, a particular place or space, functionality of the destination, the level of satisfaction to be achieved, and the influence on future visits.
References
Auliciems, A. & de Dear, R. (1997). Thermal adaptation and vari-able indoor climate control. In Auliciems, A. (ed), Advances in
Bioclimatology 5, 61-86. Springer, Berlin.
Ciucci, E., Calussi, P., Menesini, E., Mattei, A., Petralli, M., Or-landini, S. (2013). Seasonal variation, weather and behaviour in day-care children: a multilevel approach. International Journal
of Biometeorology, 57: 845-856.
de Freitas, C. R. (1985). Assessment of human bioclimate based on thermal response. International Journal of Biometeorology, 29: 97-119.
de Freitas, C. R. (1990). Recreation climate assessment.
Interna-tional Journal of Climatology, 10: 89103.
de Freitas, C. R. (2003). Tourism climatology: evaluating envi-ronmental information for decision making and business plan-ning in the recreation and tourism sector. International Journal
of Biometeorology, 48: 45-54.
de Freitas, C. R. (2015). Weather and place-based human be-haviour. International Journal of Biometeorology, 59(1): 55-63. de Freitas, C. R., Scott, D., McBoyle, G. (2008). A second gener-ation climate index for tourism (CIT): specificgener-ation and verifi-cation. International Journal of Biometeorology, 52(5): 399-407. Persinger, M. A. (1980). The Weather Matrix and Human
Be-haviour. Praeger Press, New York.
Watson, D. (2000). Mood and Temperament. Guilford Press, New York.
THE CLIMATE COMFORT CONDITIONS IN TERMS OF TOURISM IN TURKEY’S GÖLLER (LAKES) DISTRICT
Y. Güçlü
Introduction
Climatic conditions have an important impact on tourist activites. Climate is, in fact, one of the most important tourist attractions. Thus, climate provides disadvantages and advantages for tourism resorts. In certain seasons of the year, tourism becomes more intense than in other times. The length of the most popular season, known as high season, varies according to the respective local climate conditions.
Climate conditions that may be accepted as ideal, depending on the tourist activity, have vital impor-tance for the competitiveness of a tourism resort. Both tourism enterprises and tourists do not prefer areas with climatic disadvantages as much as those with ideal climates. Since climate conditions are the basis of natural resources and attraction of tourism resorts, climate can be the main reason that tourists select a certain destination.
Since tourism predominantly depends on climate conditions, the first issue while examining the tourism potential of a place is to detemine the annual climate characteristics of a resort. In this context, the climate comfort of the resort area should be understood. Climate comfort is defined as the satisfaction level of tourists within the climate conditions of the respective tourism environment. This study aims to examine climate comfort condi-tions in the Göller District in Turkey by means of the visitors generally participating in outdoor tourism activities in order to determine the most suitable timeframes in which the required conditions to sustain such activities healthily and in comfort are situated.
Indeed, the climate comfort status in tourism resorts must be considered to enable tourists of all ages to perform outdoor tourism activities healthily and comfortably, provide tourists with all the expected benefits of the tour, protect the participants from the possible climate risks, and allow tourism planners and marketers to plan realistic activities according to climate conditions. Considering that tourism activities may not always be limited to inside air-conditioned places such as buildings and vehicles, the importance of climate comfort may be understood even better. Moreover, it is thought that examining climate comfort conditions will contribute to the understanding of the real tourism potential of case study area, the Göller District.
Study area
The Göller (Lakes) District is located in the Antalya Section of Mediterranean Region in Turkey (Figure 1). This area takes its name from the number of lakes in the region, including Acıgöl, Eğirdir, Beyşehir, Burdur, Suğla, Salda, Yarışlı, and Kovada. With the natural, historical, and cultural attractions that it possesses, the region shelters many locations appropriate for tourism and recreational activities (Korkmaz, 2001; Bingöl, 2004; Yılmaz, 2007; Alpar & Erdem, 2007; Güngör & Polat, 2007; Öztaş & Karabulut, 2007; Dinç & Öztürk, 2013). Besides, it is near the Southern Aegean and Western Mediterra-nean coasts, which are some of the most important 3S tourism destinations in Turkey and in the world, and it is located on the route that many local and foreign tourists use to reach these areas via roadway. However, in spite of this huge tourism potential, the Göller District cannot gain adequate shares of tourism.
Methodology
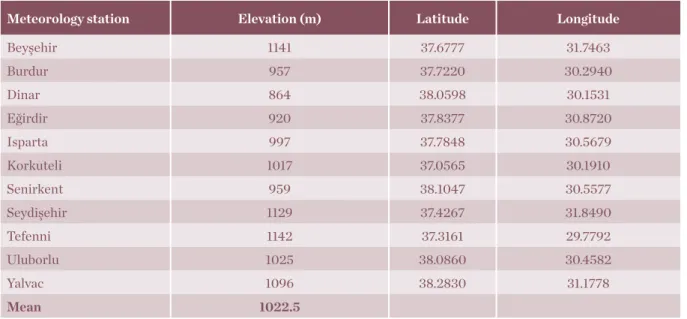
In the study, data from 11 meteorology stations (Table 1) selected from the Göller District has been used. The length of observation periods, positions, and existence of insolation measurements have
Figure 1: Location map of the study area
been affective for selecting these stations. Required data were obtained from the Ministry of Forestry and Water Affairs and the Turkish State Meteoro-logical Service.
Table 1: Some features of selected meteorological stations for this study
Meteorology station Elevation (m) Latitude Longitude
Beyşehir 1141 37.6777 31.7463 Burdur 957 37.7220 30.2940 Dinar 864 38.0598 30.1531 Eğirdir 920 37.8377 30.8720 Isparta 997 37.7848 30.5679 Korkuteli 1017 37.0565 30.1910 Senirkent 959 38.1047 30.5577 Seydişehir 1129 37.4267 31.8490 Tefenni 1142 37.3161 29.7792 Uluborlu 1025 38.0860 30.4582 Yalvac 1096 38.2830 31.1778 Mean 1022.5
The data from the aforementioned selected meteorology stations has been assessed using the Tourism Climate Index – TCI (Mieczkowski, 1985). This index determines climate comfort conditions in order to understand the effects of climate on tourist flows and establish what is considered as the tourism season. This index is the most commonly integrated index. The climate factors considered in the index are sunshine duration, temperature, relative humidity, precipitation, and wind.
TCI index is calculated by using the formula; TCI=2[4(CID) +CIA+2(R) +2(S) +W]. Whereas, CID represents the Daytime Comfort Index and has a 40% weight in TCI index. CIA in the formula represents the Daily Comfort Index and has a 10% weight in TCI index. R in the formula represents the Rainfall Index, which has a 20% weight in TCI index. S in the formula represents the Sunshine Index and has a 20% weight in the TCI index. W in the formula represents the Wind Index and has a 10% weight in TCI index. The results obtained from the indices are evaluated according to the classifica-tion scheme on Table 2.
Table 2: Classification scheme for TCI of Mieczkowski
Numerical value of
indices (%) Descriptive category
90 – 100 Ideal 80 - 89 Excellent 70 - 79 Very good 60 - 69 Good 50 - 59 Acceptable 40 - 49 Marginal 30 - 39 Unfavourable 20 - 29 Very unfavourable 10 - 19 Extremely unfavourable 9- -9 Impossible –20- -10 Impossible Source: Mieczkowski, 1985, p. 229.
Results and Discussion
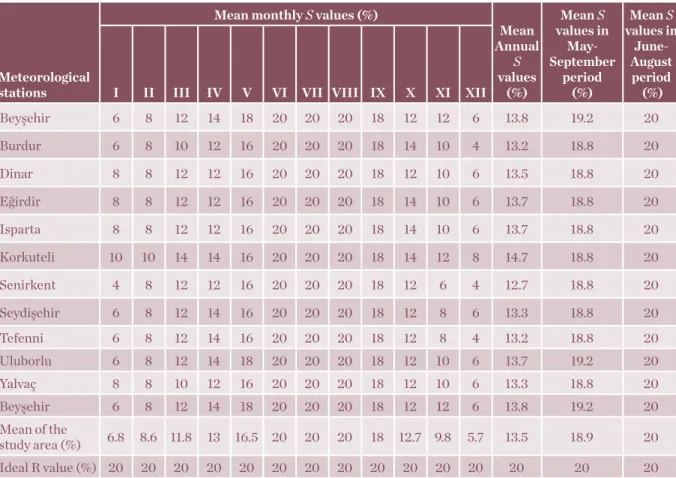
Sunshine Index (S) findings
The mean monthly S values vary between 4% (Burdur, Senirkent and Tefenni in December, Senirkent in January) and 20% (at all stations in summer months). The mean annual S values are 13.2 to 14.7% (Table 3).
In the May-September period, the sky is generally clear, the weather is dry/less rainy and the S values
vary between 16% and 20%. In summer, mean S value is 20% (Table 3). When we consider the ideal S value in TCI as 20%, it may be said that the S values contribute very importantly to the overall TCI values and increase the tourism climate comfort.
Table 3. The mean monthly, annual and certain period S values of the stations selected from the Göller District of Turkey (1987-2011 period)
Meteorological stations
Mean monthly S values (%)
Mean Annual S values (%) Mean S values in May-September period (%) Mean S values in June-August period (%)
I II III IV V VI VII VIII IX X XI XII
Beyşehir 6 8 12 14 18 20 20 20 18 12 12 6 13.8 19.2 20 Burdur 6 8 10 12 16 20 20 20 18 14 10 4 13.2 18.8 20 Dinar 8 8 12 12 16 20 20 20 18 12 10 6 13.5 18.8 20 Eğirdir 8 8 12 12 16 20 20 20 18 14 10 6 13.7 18.8 20 Isparta 8 8 12 12 16 20 20 20 18 14 10 6 13.7 18.8 20 Korkuteli 10 10 14 14 16 20 20 20 18 14 12 8 14.7 18.8 20 Senirkent 4 8 12 12 16 20 20 20 18 12 6 4 12.7 18.8 20 Seydişehir 6 8 12 14 16 20 20 20 18 12 8 6 13.3 18.8 20 Tefenni 6 8 12 14 16 20 20 20 18 12 8 4 13.2 18.8 20 Uluborlu 6 8 12 14 18 20 20 20 18 12 10 6 13.7 19.2 20 Yalvaç 8 8 10 12 16 20 20 20 18 12 10 6 13.3 18.8 20 Beyşehir 6 8 12 14 18 20 20 20 18 12 12 6 13.8 19.2 20 Mean of the study area (%) 6.8 8.6 11.8 13 16.5 20 20 20 18 12.7 9.8 5.7 13.5 18.9 20 Ideal R value (%) 20 20 20 20 20 20 20 20 20 20 20 20 20 20 20
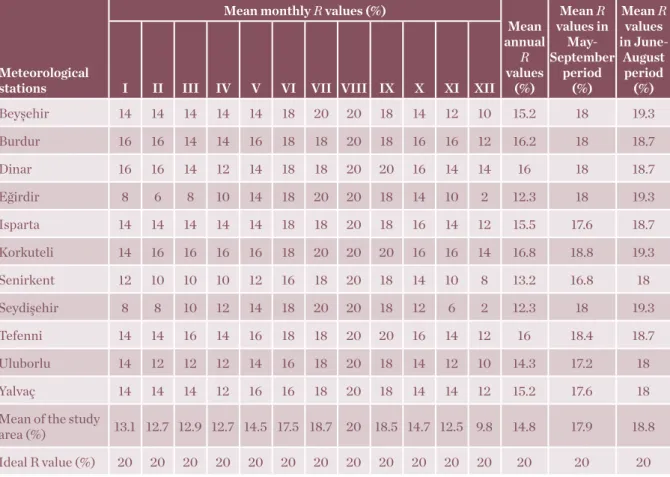
Table 4: The mean monthly, annual and certain period R values of the stations selected from the Göller District of Turkey (1987-2011 period).
Meteorological stations
Mean monthly R values (%)
Mean annual R values (%) Mean R values in May-September period (%) Mean R values in June-August period (%)
I II III IV V VI VII VIII IX X XI XII
Beyşehir 14 14 14 14 14 18 20 20 18 14 12 10 15.2 18 19.3 Burdur 16 16 14 14 16 18 18 20 18 16 16 12 16.2 18 18.7 Dinar 16 16 14 12 14 18 18 20 20 16 14 14 16 18 18.7 Eğirdir 8 6 8 10 14 18 20 20 18 14 10 2 12.3 18 19.3 Isparta 14 14 14 14 14 18 18 20 18 16 14 12 15.5 17.6 18.7 Korkuteli 14 16 16 16 16 18 20 20 20 16 16 14 16.8 18.8 19.3 Senirkent 12 10 10 10 12 16 18 20 18 14 10 8 13.2 16.8 18 Seydişehir 8 8 10 12 14 18 20 20 18 12 6 2 12.3 18 19.3 Tefenni 14 14 16 14 16 18 18 20 20 16 14 12 16 18.4 18.7 Uluborlu 14 12 12 12 14 16 18 20 18 14 12 10 14.3 17.2 18 Yalvaç 14 14 14 12 16 16 18 20 18 14 14 12 15.2 17.6 18 Mean of the study
area (%) 13.1 12.7 12.9 12.7 14.5 17.5 18.7 20 18.5 14.7 12.5 9.8 14.8 17.9 18.8 Ideal R value (%) 20 20 20 20 20 20 20 20 20 20 20 20 20 20 20
Rainfall Index (R) findings
The annual mean of R values changes between 12.3% (Eğirdir and Seydişehir) to 16.8% (Korkuteli) (Table 4) in the study area. The monthly R values vary between 2% (in Eğirdir and Seydişehir in December) to 20% (in Beyşehir, Eğirdir and Seydişehir in July and August; in Dinar and Tefenni in August and September; in Korkuteli in summer months; at all stations in July). On the other hand, the mean of the R values is about 17.9 % in May-Sep-tember period and 18.8% in summer (Table 4).
While calculating TCI values, the ideal R value is 20%; thus, it can be said that the precipitation makes high level positive contribution to tourism by means of climate comfort. R values contribute highly and positively to TCI values in May-Sep-tember period (especially in summer months) in the Göller District of Turkey.
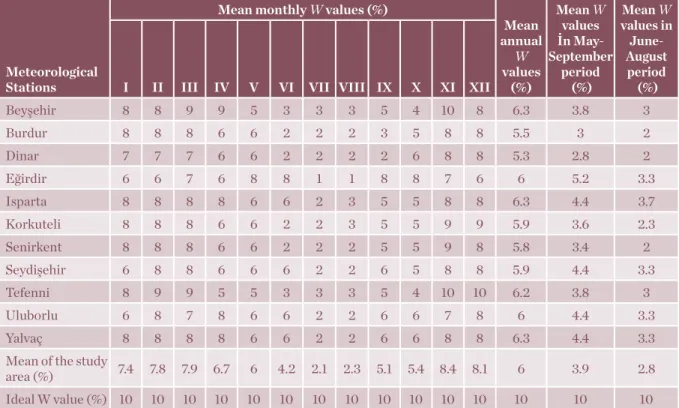
Table 5: The mean monthly, annual and certain period W values of the stations selected from the Göller District of Turkey (1987-2011 period)
Meteorological Stations
Mean monthly W values (%)
Mean annual W values (%) Mean W values İn May-September period (%) Mean W values in June- August period (%)
I II III IV V VI VII VIII IX X XI XII
Beyşehir 8 8 9 9 5 3 3 3 5 4 10 8 6.3 3.8 3 Burdur 8 8 8 6 6 2 2 2 3 5 8 8 5.5 3 2 Dinar 7 7 7 6 6 2 2 2 2 6 8 8 5.3 2.8 2 Eğirdir 6 6 7 6 8 8 1 1 8 8 7 6 6 5.2 3.3 Isparta 8 8 8 8 6 6 2 3 5 5 8 8 6.3 4.4 3.7 Korkuteli 8 8 8 6 6 2 2 3 5 5 9 9 5.9 3.6 2.3 Senirkent 8 8 8 6 6 2 2 2 5 5 9 8 5.8 3.4 2 Seydişehir 6 8 8 6 6 6 2 2 6 5 8 8 5.9 4.4 3.3 Tefenni 8 9 9 5 5 3 3 3 5 4 10 10 6.2 3.8 3 Uluborlu 6 8 7 8 6 6 2 2 6 6 7 8 6 4.4 3.3 Yalvaç 8 8 8 8 6 6 2 2 6 6 8 8 6.3 4.4 3.3
Mean of the study
area (%) 7.4 7.8 7.9 6.7 6 4.2 2.1 2.3 5.1 5.4 8.4 8.1 6 3.9 2.8 Ideal W value (%) 10 10 10 10 10 10 10 10 10 10 10 10 10 10 10
Wind Index (W) findings
The annual mean of W values varies between 5.3% (Dinar) to 6.3% (Isparta and Yalvaç) (Table 5). In the May-September period, in which tourism activ-ities become intense, the mean W values fall under the annual mean.
The mean May-September of the W values is 3.9% and falls back to 2.8% in summer season. On the
other hand, the monthly W values vary between 1% (in Eğirdir in July and August) to 10% (in Tefenni in November and December). Accordingly, the contribution of W values to the TCI values lessen in July and August in the study area. Thus, the wind generally affects positively the climate comfort in the Göller District. However, in May-September period and summer, its contribution to climate comfort decreases (Table 5).
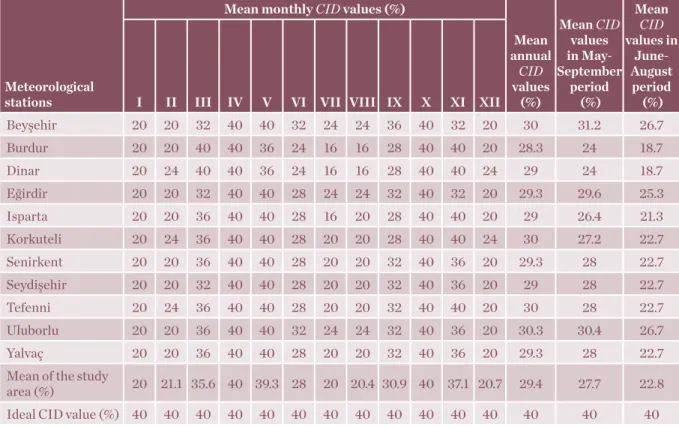
Table 6: The mean monthly, annual and certain period CID values of the stations selected from the Göller District of Turkey (1987-2011 period)
Meteorological stations
Mean monthly CID values (%)
Mean annual CID values (%) Mean CID values in May-September period (%) Mean CID values in June-August period (%)
I II III IV V VI VII VIII IX X XI XII
Beyşehir 20 20 32 40 40 32 24 24 36 40 32 20 30 31.2 26.7 Burdur 20 20 40 40 36 24 16 16 28 40 40 20 28.3 24 18.7 Dinar 20 24 40 40 36 24 16 16 28 40 40 24 29 24 18.7 Eğirdir 20 20 32 40 40 28 24 24 32 40 32 20 29.3 29.6 25.3 Isparta 20 20 36 40 40 28 16 20 28 40 40 20 29 26.4 21.3 Korkuteli 20 24 36 40 40 28 20 20 28 40 40 24 30 27.2 22.7 Senirkent 20 20 36 40 40 28 20 20 32 40 36 20 29.3 28 22.7 Seydişehir 20 20 32 40 40 28 20 20 32 40 36 20 29 28 22.7 Tefenni 20 24 36 40 40 28 20 20 32 40 40 20 30 28 22.7 Uluborlu 20 20 36 40 40 32 24 24 32 40 36 20 30.3 30.4 26.7 Yalvaç 20 20 36 40 40 28 20 20 32 40 36 20 29.3 28 22.7 Mean of the study
area (%) 20 21.1 35.6 40 39.3 28 20 20.4 30.9 40 37.1 20.7 29.4 27.7 22.8 Ideal CID value (%) 40 40 40 40 40 40 40 40 40 40 40 40 40 40 40
The Daytime Comfort Index (CID) findings
The mean annual CID values are about 29% and vary between 28.3% (Burdur) to 30.3% (Uluborlu) (Table 6). High values of maximum temperatures decrease the CID values significantly in May-Sep-tember period. Especially in summer months, the CID values are quite under the ideal value (40%). The highest CID values are seen in spring and autumn seasons and the lowest CID values in winter and summer seasons. The May and October months are transition periods. The general mean of CID values in May-September period, in which tourism
activities become intense, is about 27.7%, and in summer, it is 22.8%. The most suitable periods by means of CID values in the Göller District are March-May and September-November periods.
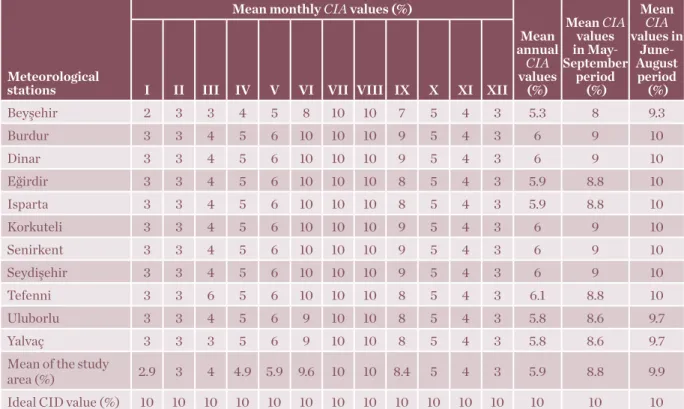
Table 7: The mean monthly, annual and certain period CIA values of the stations selected from the Göller District of Turkey (1987-2011 period)
Meteorological stations
Mean monthly CIA values (%)
Mean annual CIA values (%) Mean CIA values in May-September period (%) Mean CIA values in June-August period (%)
I II III IV V VI VII VIII IX X XI XII
Beyşehir 2 3 3 4 5 8 10 10 7 5 4 3 5.3 8 9.3 Burdur 3 3 4 5 6 10 10 10 9 5 4 3 6 9 10 Dinar 3 3 4 5 6 10 10 10 9 5 4 3 6 9 10 Eğirdir 3 3 4 5 6 10 10 10 8 5 4 3 5.9 8.8 10 Isparta 3 3 4 5 6 10 10 10 8 5 4 3 5.9 8.8 10 Korkuteli 3 3 4 5 6 10 10 10 9 5 4 3 6 9 10 Senirkent 3 3 4 5 6 10 10 10 9 5 4 3 6 9 10 Seydişehir 3 3 4 5 6 10 10 10 9 5 4 3 6 9 10 Tefenni 3 3 6 5 6 10 10 10 8 5 4 3 6.1 8.8 10 Uluborlu 3 3 4 5 6 9 10 10 8 5 4 3 5.8 8.6 9.7 Yalvaç 3 3 3 5 6 9 10 10 8 5 4 3 5.8 8.6 9.7
Mean of the study
area (%) 2.9 3 4 4.9 5.9 9.6 10 10 8.4 5 4 3 5.9 8.8 9.9 Ideal CID value (%) 10 10 10 10 10 10 10 10 10 10 10 10 10 10 10
The Daily Comfort Index (CIA) findings
In the study area, the mean annual of CIA for the selected stations is 5.9%, which ranges from 5.3% (Beyşehir) to 6.1% (Tefenni) (Table 7). The CIA values demonstrate the lowest values in winter and the highest values in summer. The lowest CIA value in a year is 2% and the highest value is spotted as 10%. CIA is ideal or nearly ideal in June, September and October months, and decreases slightly in June and August. Accordingly, in June and August, in which the mean temperatures and relative humidity are high in the area, the CIA values decrease but are generally close to the ideal value in May-September period. The mean CIA values in May-September period vary between 8% (Beyşehir) to 9% (Burdur, Dinar,
Korkuteli, Senirkent, Seydişehir). The lowest CIA value is 5% (in Beyşehir in May) and the highest is 10% (at all the stations in summer, except for Uluborlu and Yalvac in June). The CIA values decrease 2% to 6% in the October-April period, especially in the winter period, due to decreasing temperatures.
The Tourism Climate Index (TCI) findings
The annual general mean of the TCI values in the Göller District of Turkey is 69.6% (good category), and varies between 66.6% (good in Seydişehir) to 73.4% (very good in Korkuteli) (Table 1 & 8). Annually, Beyşehir, Isparta, Korkuteli, Tefenni, and Uluborlu may be regarded as having very good tourism climate comfort values, whereas the other stations demonstrate good category TCI values.
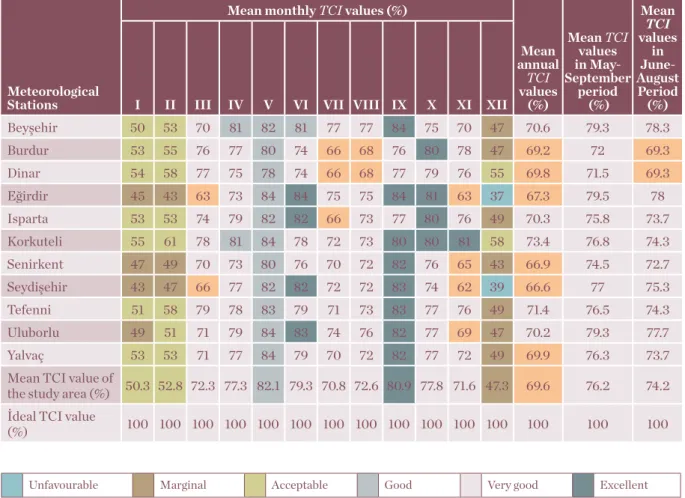
Table 8: The mean monthly, annual, and certain periods TCI values and categories for the selected stations in Göller District of Turkey (1987-2011 period)
Meteorological Stations
Mean monthly TCI values (%)
Mean annual TCI values (%) Mean TCI values in May-September period (%) Mean TCI values in June-August Period (%)
I II III IV V VI VII VIII IX X XI XII
Beyşehir 50 53 70 81 82 81 77 77 84 75 70 47 70.6 79.3 78.3 Burdur 53 55 76 77 80 74 66 68 76 80 78 47 69.2 72 69.3 Dinar 54 58 77 75 78 74 66 68 77 79 76 55 69.8 71.5 69.3 Eğirdir 45 43 63 73 84 84 75 75 84 81 63 37 67.3 79.5 78 Isparta 53 53 74 79 82 82 66 73 77 80 76 49 70.3 75.8 73.7 Korkuteli 55 61 78 81 84 78 72 73 80 80 81 58 73.4 76.8 74.3 Senirkent 47 49 70 73 80 76 70 72 82 76 65 43 66.9 74.5 72.7 Seydişehir 43 47 66 77 82 82 72 72 83 74 62 39 66.6 77 75.3 Tefenni 51 58 79 78 83 79 71 73 83 77 76 49 71.4 76.5 74.3 Uluborlu 49 51 71 79 84 83 74 76 82 77 69 47 70.2 79.3 77.7 Yalvaç 53 53 71 77 84 79 70 72 82 77 72 49 69.9 76.3 73.7 Mean TCI value of
the study area (%) 50.3 52.8 72.3 77.3 82.1 79.3 70.8 72.6 80.9 77.8 71.6 47.3 69.6 76.2 74.2 İdeal TCI value
(%) 100 100 100 100 100 100 100 100 100 100 100 100 100 100 100
Unfavourable Marginal Acceptable Good Very good Excellent
Source: Calculated and organized according to the data of the Ministry of Forestry and Water Affairs, Turkish State Meteorological Service.
to the increased atmospheric activity in winter months, the sunshine duration lessens; rainfall, relative humidity, and wind speeds increase; temperature values fall; and, accordingly, the TCI values are generally low. The lowest TCI value in this period is 37% in Eğirdir (December-unfavour-able), and the highest TCI value is 61% in Korkuetli (February-good).
TCI values demonstrate the lowest general mean 47.3% (acceptable), in December and highest 82.1% (excellent) in May. The ideal TCI values are spotted in May and September throughout the year, and the lowest values are detected in Decem-ber-January-February throughout the year. On the other hand, TCI values are in the good category in May-September and June-August periods. Due