See discussions, stats, and author profiles for this publication at: http://www.researchgate.net/publication/255992533
Comparison of Non-Linear Functions to Describe
the Growth in Mengali Sheep Breed of
Balochistan
ARTICLE in PAKISTAN JOURNAL OF ZOOLOGY · JANUARY 2013 Impact Factor: 0.4 CITATION1
DOWNLOADS340
VIEWS264
6 AUTHORS, INCLUDING: Farhat Iqbal University of Balochistan 20 PUBLICATIONS 9 CITATIONS SEE PROFILE Ecevit Eyduran Iğdır Üniversitesi 50 PUBLICATIONS 52 CITATIONS SEE PROFILE Masroor Bajwa University of Balochistan 25 PUBLICATIONS 21 CITATIONS SEE PROFILE Available from: Abdul Waheed Retrieved on: 09 July 2015Comparison of Non-Linear Functions to Describe the Growth in
Mengali Sheep Breed of Balochistan
Mohammad Masood Tariq,1* Farhat Iqbal,2 Ecevit Eyduran,3 Masroor Ahmad Bajwa,1 Zil E Huma4 and Abdul Waheed5
1
Centre of Advanced Studies in Vaccinology and Biotechnology, University of Balochistan, Quetta
2
Department of Statistics, University of Balochistan, Quetta
3
Igdir University, Faculty of Agriculture, Department of Animal Science, 76000, Igdir, Türkiye
4
Department of Zoology, Sardar Bahadur Khan Women’s University, Quetta
5
Faculty of Veterinary Science, Bahauddin Zakariya University, Multan
Abstract.- The objectives of this study were to estimate and compare the goodness of fit six non-linear growth
models, i.e. Gompertz, Logistic, Von Bertalanffy, Richards, Weibull and Morgan-Mercer-Flodin (MMF), in Mengali sheep of Balochistan. For this purpose, monthly body weight data from 2377 sheep from birth up to 360 days of age were used. The average body weights in each period were used to define the weight – age relationship in these sheep. The models parameters, adjusted coefficient of determination (R2Adj), root mean square error (RMSE), Akaike’s and Bayesian information criteria (AIC and BIC), predicted body weights and residuals were calculated for each model. Among six growth functions, the MMF model was found appropriate for its accuracy of fit according to the highest R2Adj (0.9991) and the lowest RMSE (0.3348) followed by the Von Bertalanffy and Weibull models. The MMF model was also selected the best based on the lowest values of AIC (9.6516) and BIC (10.0489). The results of this study suggest that the MMF model can be used to accurately predict the growth in body weight of Mengali sheep.
Key words: Mengali sheep, weight-age relationship, growth models, non-linear regression models
INTRODUCTION
A
mong many different breeds of sheep in Balochistan, the Mengali sheep is one of the important breed found in black or brown color with white patches on the body, prominent head with black face but white forehead (Khan et al., 2007). According to Kakar and Ahmad (2004) the mature body weight is 34 kg in the rams and 27 kg in the ewes. Though the source of origin of Mengali sheep is not known, it is mostly raised by native “Mengal” tribe (most populated tribe of Kalat Division area) therefore the breed is famous as Mengali (local farmers also name it Budi) Khadkucha (Mastung) is identified to be a hub of this breed (Tariq et al., 2011).Growth is one of the most important traits in farm animals and defined as an increase in body size per unit time (Topal et al., 2004). Body growth is related to an increase in cell number and volume. ________________________
* Corresponding address: [email protected] 0030-9923/2013/0003-0661 $ 8.00/0
Copyright 2013 Zoological Society of Pakistan
Age related changes can be observed in the weight or size of any organ, in the composition of tissues, in cell size and number as well as in live weight (Eisen, 1976). Growth curves are also used for investigating optimum feeding programmes, determining optimum slaughtering age and the effects of selection on curve parameters and on live weight at a certain age (Blasco and Gomes, 1993).
Among statistical procedures available for analyzing growth data, fitting a non-linear function offers an opportunity to summarize the information contained in the entire sequence of size–age points into a small set of parameters that can be interpreted biologically and used to derive other growth traits (Perotto et al., 1992). Numerous growth equations have been developed to describe and fit the nonlinear sigmoid relationship between growth and time. Changes in live weight or dimension for a period of time are explained by the growth curves such as, Brody, Gompertz, Logistic and Von Bertalanffy models in Turkish Kivircik and Daglic male lambs (Akbas et al., 1999), in Awassi lambs (Tekel et al., 2005), in Akkaraman and German black headed mutton x Akkaraman (Kucuk and
M.M. TARIQ ET AL. 662
Eyduran, 2009) and in Mengali sheep (Tariq et al., 2011).
The objectives of this study were to compare the goodness of fit of non-linear function (Gompertz, Logistic, Von Bertalanffy, Richards, Weibull and Morgan-Mercer-Flodin) and to provide a specific shape of the growth curve according to the environmental effects on monthly weight from birth to 360 days of age in Mengali sheep.
MATERIALS AND METHODS
The pedigree and performance data on Mengali sheep of Balochistan recorded on 2377 lambs descended from 581 ewes and 56 rams in four flocks at three different locations were available for the present study. Data on four sheep flocks maintained at three places Mastung (Khadkocha), Nushki (Peer Wala) and Quetta (Killi Hassni) and Experimental station at Centre for Advanced Studies in Vaccinology and Biotechnology (CASVAB) (ESC), University of Balochistan (UoB) Brewery Road, Quetta were collected monthly from birth to 360 days of age during Jan 2005 to Dec 2009. Table I shows the average body weight of these sheep for each period. The same data set was used by Tariq et
al. (2011) and the Gompertz curve was fitted to the
Mengali sheep data.
Table I.- Average body weight of Mengali sheep by age.
Age (days) Weight (kg)
0 3.62 30 8.37 60 12.61 90 16.74 120 20.46 180 25.81 270 31.13 360 36.03
Following fixed effect models were assumed: Model I for birth and weaning weight while Model II for other traits.
Yijklmn = µ+Fi +YOBj +SOBk+
TOBl+ SEXm+ b(Pijklmn) + eijklmn
(Model I) Yijklmn = µ+Fi +YOBj +SOBk+
TOBl+ SEXm + eijklmn
(Model II)
Where; Yijklm = Trait of interest observed; µ = Population mean; Fi = Effect of the flock (1-4); YOBj = Year of birth; SOBk = Season of birth (Spring, Autumn); TOBl = Type of birth(Single, twin); SEXm = Male and female; b= regression coefficient; Pijklmn = maternal effect of dam, eijklmn = random error associated with each observation. It is assumed to be normally distributed with mean zero and variance +e.2.
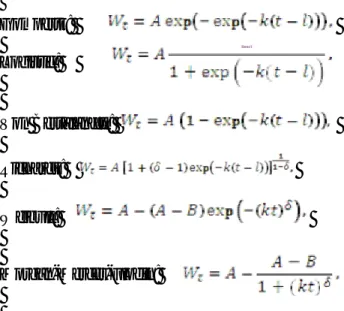
The model for growth curves is the equations which describe the increase of a body weight against age. These models differ according to the number of parameters used in the equation being calculated by the measured data. There are many non-linear models that have been used to model growth of domestic animals. The most in use are three-parameter growth functions (Gompertz, logistic and Von Betalanffy) and four-parameter equations (Richards, Weibull and Morgan-Mercer-Flodin). In the present study, these six widely used non-linear growth models were retained to describe the evolution of body weight of Mengali sheep with time. The mathematical relations of these models are as follows: Gompertz: Logistic: Von Bertalanffy: Richards: Weibull: Morgan-Mercer-Flodin:
where Wt is the live body weight of Mengali sheep at time t; A is the asymptotic weight when age approaches infinity indicating the average weight of mature sheep; k is the maturing rate; l is the - ordinate of the inflection point; is the parameter that controls the point of inflection and B is the
lower asymptote.
The comparison amongst the models were based on the coefficient of determination (R2) which shows how well a model fits the data and the root mean square error (RMSE) which measures the error in squared terms. The adjusted coefficient of determination (R2Adj) was also used for evaluation as the number of parameters in models is different. In addition, two model selection criteria namely Akaike’s information criteria (AIC) and Bayesian information criteria (BIC) were calculated. The best model will have the highest value of R2Adj and the lowest values for RMSE, AIC and BIC.
The data were analyzed using Matlab® 2012 software. The non-linear least squares algorithm of Levenberg-Marquardt with convergence criteria of 1.0E-08 was used for the estimation of the parameters of various models.
RESULTS AND DISCUSSION
Table II represents the estimated parameters along with standard errors of different growth models. All parameters are found significant
(P<0.05) except for two parameters of Richards
model (l and ). Hence, we exclude the Richards model for further evaluation.
Table III shows the predicted values and residuals obtained after fitting each model to the body growth data. The goodness of fit measures (R2,
R2Adj, RMSE, AIC and BIC) are also displayed. The
determination coefficient for the MMF model was found the highest (0.9995) and the lowest for Logistic model (0.9943). The values for Bertalanffy and Weibull models were similar (0.9993) followed by the Gompertz model (0.9943). The adjusted coefficient of determination, in descending order, for MMF, Bertalanffy, Weibul, Gompertz and Logistic models were 0.9991, 0.9990, 0.9987, 0.9921, and 0.9792, respectively. The MMF, Bertalanffy and Weibull models showed the highest values.
When models are evaluated based on RMSE, the MMF model showed the lowest values (0.3348) followed by Bertalanffy (0.3577), Weibull (0.3988), Gompertz (0.9994) and Logistic (1.6167). The MMF model outperformed other competing models according to goodness of fit by RMSE. This model
also showed the minimum AIC and BIC values (AIC=9.6516, BIC=10.0489) followed by Bertalanffy (AIC=10.4654, BIC=10.8132) and Weibull (AIC=12.4501, BIC=12.8473). The values of AIC and BIC we found very high for Gompertz (AIC=26.9336, BIC=27.2514) and Logistic model (AIC=34.6289, BIC=34.9467).
Based on various evaluation measures we found that the MMF model has the best fitting to the body weight data of Mengali sheep. The Bertalannfy and Weibull models showed higher accuracy. The performance of Gompertz model had smaller R2Adj and larger RMSE and AIC/BIC as compared to the three modes mentioned above. The Logistic model had the least performance as compared to other non-linear growth models used in this study showing least values for adjusted coefficient of determination and the highest value for root mean square error, AIC and BIC.
The rank of the model was determined based on three evaluation criteria (R2Adj RMSE, AIC, BIC) and showed as a superscript on models in Table III. We can say that the best three models for describing the growth rate of Mengali sheep are Morgan-Mercer-Flodin, Von Bertalanffy and Weibull model, in descending order.
The Brody function was found to be sufficient for the growth in Morkaraman, Awassi and Tushin sheep by Esenbuğa et al. (2000) and Bilgin and Esenbuga (2003). The Gompertz function was found to be appropriate for describing the growth curve of Suffolk sheep (Lewis et al., 2002). The Gompertz and Bertalanffy were found the best fitted functions for the Morkaraman and Awassi breed, respectively, by Topal et al. (2004). On the other hand, Tekel et al. (2005) concluded that Logistic, Gompertz and Bertalanffy models described growth of Awassi lambs better than Brody and Negative exponential models.
For Kivircik breed, the reported value of R2 was 0.993 (Akbas et al., 1999), for Morkaraman, Awassi and Tushin lambs were 0.99, 0.99 and 0.98, respectively (Esenbuğa et al., 2000) for Awassi lamb the reported values was 0.98 (Tekel et al., 2005) and for Norduz female lamb it was 0.997 (Kum et al., 2010). Tariq et al. (2011) fitted the Gompertz curve to the same Mengali sheep data and the reported values of R2 and
RMSE
were 0.992M.M. TARIQ ET AL. 664
and 1.022, respectively. They concluded that the
Table II.-Estimated parameters±SE of various growth models fitted to body weight. Parameters Model A k l B Gompertz 36.966±1.4049 0.0100±0.0010 70.8299±5.6480 – – Logistic 35.0583±1.6312 0.0156±0.0022 103.2866±10.0145 – – Von Bertalanaffy 44.2992±1.2281 0.0044±0.0003 -18.9810±2.1265 – – Richards 44.0385±2.9052 0.0044±0.0010 -16.0245±29.8712* 0.0158±0.1623* – Weibull 43.8946±2.9209 0.0044±0.0006 – 1.0092±0.0620 3.5383±0.3892 Morgan-Mercer-Flodin 57.0618±4.6581 0.0040±0.0006 – 1.1052±0.0707 3.5992±0.3289
A is the asymptotic weight when age approaches infinity indicating the average weight of mature sheep; k is the maturing rate; l is the
-ordinate of the inflection point; is the parameter that controls the point of inflection and B is the lower asymptote. *Not significant at 10%. All other parameters are significant (P<0.05).
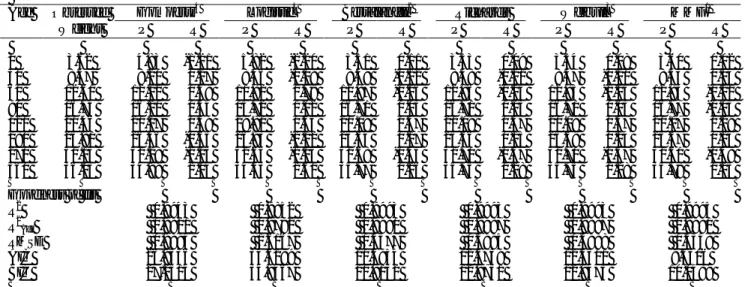
Table III:- Goodness of fit measures for various growth models fitted to the body weight data.
Observed Gompertz4 Logistic5 Bertalanffy2 Richards Weibull3 MMF1
Age Weight P R P R P R P R P R P R 0 3.62 4.83 -1.21 5.82 -2.20 3.51 0.11 3.53 0.09 3.54 0.08 3.60 0.02 30 8.37 8.20 0.17 8.46 -0.09 8.49 -0.12 8.48 -0.11 8.47 -0.10 8.33 0.04 60 12.61 12.12 0.49 11.82 0.79 12.87 -0.26 12.86 -0.25 12.85 -0.24 12.83 -0.22 90 16.74 16.20 0.54 15.72 1.02 16.71 0.03 16.71 0.03 16.71 0.03 16.77 -0.03 120 20.46 20.07 0.39 19.81 0.65 20.09 0.37 20.09 0.37 20.09 0.37 20.17 0.29 180 25.81 26.46 -0.65 26.93 -1.12 25.64 0.17 25.66 0.15 25.69 0.14 25.67 0.14 270 31.13 32.28 -1.15 32.65 -1.15 31.68 -0.55 31.70 -0.57 31.70 -0.57 31.61 -0.48 360 36.03 34.99 1.04 34.43 1.60 35.77 0.26 35.75 0.28 35.75 0.28 35.78 0.25 Goodness of fit R2 0.9943 0.9852 0.9993 0.9993 0.9993 0.9995 R2Adj 0.9921 0.9792 0.9990 0.9987 0.9987 0.9991 RMSE 0.9994 1.6167 0.3577 0.3995 0.3988 0.3348 AIC 26.9336 34.6289 10.4954 12.4759 12.4501 9.6516 BIC 27.2514 34.9467 10.8132 12.8731 12.8473 10.0489
Superscript on model represents the rank of the model; P and R are the predicted weight and residuals, respectively, R2
Adj adjusted coefficient of determination, RMSE: root mean square error, AIC and BIC are Akaike’s and Bayesian information criteria, respectively.
Gompertz curve reliably explained relationship between weight and age in Mengali sheep. The R2 and
RMSE
values of Gompertz curve in this study are in line with Tariq et al. (2011). In addition we calculated the adjusted determination coefficient and model selection criteria (AIC and BIC). A slight difference inRMSE
value may be due to different software we used for estimating non-linear model. The Gompertz curve though fit the data reasonably as mentioned by Tariq et al. (2011) but ranked 4 out of 5 models considered in the present study.Figure 1 shows the fitted Moran-Mercer-Flodin curve and Gompertz curver against the actual
Fig. 1. Morgan-Mercer-Flodin (MMF) and Gompertz growth curve fitted to body weight.
from birth to 360 days of age. The fitted curves of Von Bertalanffy and Weibull model showed the same trend as MMF and therefore not displayed. The Gompertz curve is plotted in order to compare its difference with that of the best fitted curve (MMF) in this study. It is evident from the figure that the MMF growth curve predicted the body weight of Mengali sheep better than the Gompertz growth curve. This further supports our findings that the MMF model describes the growth of body weight better than the Gompertz model.
In this study, six different growth models (Gompertz, Logistic, Von Betalanffy, Richards, Weibull and Morgan-Mercer-Flodin) were studied to determine the growth in the body weight of Mengali sheep breed from birth to 1 year of age. The MMF model was found to be the best model based on various performance measures such as adjusted coefficient of determination, root mean square error and model selection criteria (AIC and BIC).
REFERENCES
AKBAS, Y., TASKIN, T. AND DEMIROREN, E., 1999. Comparison of several models to fit the growth curves of Kivircik and Daglic male lambs. Turk. J. Vet. Anim.
Sci., 23:537–554.
BILGIN, O.C. AND ESENBUGA, N., 2003. Parameter estimation in nonlinear growth models. J. Anim. Prod.,
44:81–90.
BLASCO, A. AND GOMES, E., 1993. A note on growth curves of rabbit lines selected on growth rate or litter size. Anim. Prod., 57:332 – 34.
EISEN, E.J., 1976. Result of growth curve analysis in mice and
rats. J. Anim. Sci., 42;1008–1023.
ESENBUĞA, N., BILGIN, Ö.C., MACIT, M. AND KARAOĞLU, M., 2000. Growth curves in Awassi, Morkaraman and Tushin lambs. Atatürk Univ. The J.
Agric. Fac., 31: 37-41.
KAKAR, M.A. AND AHMED, M., 2004. An over-view of
livestock in Balochistan (2003–2004). Livestock and
Dairy Development Department Balochistan, Quetta. KHAN, S.A., KHAN, M.A., KHAN, S.A. AND MEHMOOD,
S., 2007. Genetic resources and diversity in Pakistani sheep. Int. J. Agric. Biol., 9: 941 – 944.
KUCUK, M. AND EYDURAN, E., 2009. The determination of the best growth model for Akkaraman and German Blackheaded Mutton x Akkaraman B1 crossbreed lamb.
Bulgarian J. Agric. Sci., 15:90–92.
KUM, D., KARAKUS K. AND OZDEMIR , T., 2010. The best nonlinear function for body weight at early phase of Norduz female lambs. Trakia J. Sci., 8:62 – 67. LEWIS, R.M., EMMANS, G.C., DINGWALL, W.S. AND
SIMM, G., 2002. A description of the growth of sheep and its genetic analysis. Anim. Sci., 74: 51-62.
PEROTTO, D., CUE, R.I. AND LEE, A.J., 1992. Comparison of non-linear functions for describing the growth curve of three genotypes of dairy cattle. Canadian J. Anim.
Sci., 72: 773–782.
TARIQ, M.M., BAJWA, M.A., WAHEED, A., EYDURAN, E., ABBAS, F., BOKHARI, A. AND AKBAR, A., 2011. Growth curve in Menagali sheep breed of Balochistan.
J. Anim. Plant Sci., 21: 5 – 7.
TEKEL, N., SIRELI, H.D., ELICIN, M. AND ELICIN, A., 2005. Comparison of growth curve models on Awassi lambs. Indian Vet. J., 82:179 – 182.
TOPAL, M., OZDEMIR, M., AKSAKAL, V., YILDIZ, N. AND DOGRU, U., 2004. Determination of the best nonlinear function in order to estimate growth in Morkaraman and Awassi Lambs. Small Rum. Res., 55: 229–232.