Paraoxonase 1 (PON1) promoter (−107T/C) and coding region (192Q/R and 55L/M) genetic variations in pseudoexfoliation syndrome and pseudoexfoliative glaucoma
risk
Birsen CAN DEMİRDÖĞEN*, Canan KOÇAN AKÇİN, Ezgi GÖKSOY, Gizem YAKAR, Tuğçe ÖZTEPE, Sinem DEMİRKAYA-BUDAK, Sinan OFLAZ
Department of Biomedical Engineering, TOBB University of Economics and Technology, Ankara, Turkey
Corresponding author: Birsen CAN DEMİRDÖĞEN
Address: Department of Biomedical Engineering, TOBB University of Economics and Technology, Söğütözü 06531, Ankara, Turkey
Tel: +90 312 292 42 79
Email: [email protected], [email protected] Orcid ID: 0000-0002-1536-6123
Abstract
Purpose: Pseudoexfoliation syndrome (PEX) is characterized by the accumulation of microscopic extracellular material in the anterior chamber of the eye and can lead to the development of pseudoexfoliative glaucoma (PEG) in some patients. The pathogenesis of PEX is not fully understood, and there are no objective biomarkers for its early diagnosis. Recent research has indicated that oxidative stress and inflammation might play a role in the pathophysiology of the production of pseudoexfoliation material. Therefore, in the present study, we aimed to analyze the possible association between three genetic variants of paraoxonase 1 (PON1), a well-recognized anti-oxidant and anti-inflammatory enzyme, and PEX/PEG.
Methods: The study population consisted of patients with PEX (n=150), patients with PEG (n=150) and control subjects (n=150). PON1 −107T/C, 192Q/R and 55L/M genotypes were determined using PCR followed by restriction fragment length polymorphism analysis. The correlation between these genetic alterations and clinical visual characteristics was also investigated.
Results: The minor allele frequencies and genotype distributions of PON1 did not differ significantly between the PEG, PEX, and control groups. Moreover, PON1 genotypes did not significantly influence visual clinical parameters in stratification analysis. On the other hand, in correlation analysis, pattern standard deviation was significantly correlated with the −107T/C genotypes in PEX group. In addition, intraocular pressure was correlated with the 55L/M genotypes and mean deviation was correlated with the −107T/C genotypes in the control group. Furthermore, intraocular pressure was significantly inversely correlated with sex (r = −0.116, P = 0.011) in the overall study group. Logistic regression analysis showed that having a PON1 −107TC or CC genotype is significantly associated with PEX (OR=1.909, P=0.020).
Conclusions: This study, for the first time, analyzed the relationship between PON1 genetic variants, clinical visual parameters, and PEX/PEG. The results indicated a possible role for the PON1 promoter variant in PEX.
Keywords: IOP; mean deviation; pattern standard deviation; polymorphism; visual field score
Abbreviations
DNA: Deoxyribonucleic acid IOP: Intraocular pressure MD: Mean deviation
PCR: Polymerase chain reaction PEX: Pseudoexfoliation syndrome PEG: Pseudoexfoliative glaucoma PON1: Paraoxonase 1
PSD: Pattern standard deviation
RFLP: Restriction fragment length polymorphism VFS: Visual field score
Introduction
Pseudoexfoliation syndrome (PEX) is an aging-related systemic disorder characterized by the accumulation of microscopic granular extracellular material composed of amyloid-like proteins surrounded by glycosaminoglycans, in the anterior segment of the eye [1]. Pseudoexfoliation material can be observed in the iris, the ciliary body, and the anterior lens capsule. The circulation of aqueous humor is blocked when this material occludes the trabecular meshwork, increasing the intra ocular pressure (IOP), which in turn causes optic nerve damage. This condition is referred to as glaucoma, a group of eye diseases resulting in damage to the optic nerve and vision loss. It is estimated that approximately 40–50% of patients with PEX eventually develop pseudoexfoliative glaucoma (PEG) [2-4]. The onset and progression of PEX is insidious; patients are often diagnosed incidentally via slit lamp examination or when they present with visual symptoms of glaucoma such as peripheral visual field constriction. Unfortunately, no biomarkers have been identified that can be used for the early diagnosis of PEX and to predict which PEX patients will ultimately develop PEG. This is partly because the pathophysiology of PEX is not completely understood.
PEX is a disorder related to abnormal extracellular matrix synthesis. In recent years, a growing body of evidence has implicated that oxidative stress and inflammation might play important roles in the pathology [5-14]. Inflammation, which can be a manifestation of increased oxidative stress, can activate the fibrotic process, which can in turn lead to the formation of characteristic fibrotic deposits in the eye [15]. Hence, some reports have shown increased levels of proinflammatory cytokines in the aqueous humor samples of PEX and PEG patients [14,15].
Human paraoxonase 1 (PON1) (EC.3.1.8.1) is a well-recognized oxidant and anti-inflammatory enzyme, associated with serum high density lipoprotein. It is also found in the aqueous humor and in tears [16,17]. Moreover, several lines of evidence indicate that PON1 reduces inflammation. For example, PON1 knockout has inflammatory and pro-atherogenic effects; and the overexpression of human PON1 is inflammatory and anti-atherogenic [18]. PON1 has also been observed to reduce macrophage inflammatory responses [19]. However, its activity, stability and expression levels are affected by the presence in the PON1 gene of single-nucleotide polymorphisms, which are defined as variants found at a frequency of 1% or higher in a population. The coding region polymorphisms 192Q/R (glutamine (Q) to arginine (R) substitution at codon 192) and 55L/M (leucine (L) to methionine (M) substitution at codon 55) determine the PON1 activity, while the promoter region variants −107T/C and −162A/G influence the PON1 expression levels [20-22]. The –107T/C variation is known as the strongest predictor of the observed variability in PON1 expression levels [22].
Thus, PON1 concentration or activity levels may play a role in the pathogenesis of PEX/PEG, which several studies measuring serum PON1 activity have indicated [10,12]. However, PON1 activity and expression levels are also affected by different physiological states, lifestyle and dietary factors, such as smoking, alcohol consumption, certain pharmaceutical drugs, dietary intake of bioactive compounds such as quercetin, resveratrol, curcumin, betanin, isothiocyanates, olive oil and pomegranate juice [23-28]. As genetic alterations are not affected by such factors, they can serve as better candidates for reliable biomarkers; however, PON1 variations have not been previously studied in PEX/PEG patients.
The worldwide prevalence of PEX is 10–20% in individuals over 60 years old [29]. Considering that average life expectancy has been increasing globally, an informed prediction can be made that PEX and PEG will be much more prevalent in the future. Therefore, in an effort to identify objective biomarkers for the early detection of PEX and PEG, this study aimed to evaluate the association of the PON1 promoter region variant -107T/C (rs705379) and coding region alterations 192Q/R (rs662) and 55L/M (rs854560) with PEX and PEG risk. The correlation between these genetic alterations and some clinical visual characteristics was also investigated.
Materials and Methods Subjects
The study population consisted of consecutive, unrelated adult patients with PEX (n = 150) and PEG (n = 150), and unrelated symptom-free control subjects (n = 150) examined at the Department of Ophthalmology, Gülhane Training and Research Hospital, Ankara, Turkey. All the subjects were Caucasian and from the same geographic region (Central Anatolia, Turkey). The study was approved by the ethics committee of the hospital and written informed consent was obtained from all the subjects. The study was carried out according to the principles of the Declaration of Helsinki.
The diagnosis of PEX and PEG was performed as previously explained [12,30]. Briefly, PEX diagnosis was made via slit lamp examination following mydriasis and included the presence of typical pseudoexfoliation material on the anterior lens capsule and/or the pupillary border. Patients with PEG followed up on by the Glaucoma Service at the Hospital were also recruited into the study. PEG was diagnosed when the anterior segment findings of PEX accompanied an IOP of > 21 mmHg without treatment or of < 21 mmHg with treatment, typical optic nerve head changes, and visual field defects. Consecutive subjects with an IOP of ≤ 21 mmHg, a normal optic disk appearance, and no pseudoexfoliation material on the anterior lens capsule and pupil margin, and no visual field defects were included as controls. Both the healthy subjects and the patients received a comprehensive ophthalmological examination including best-corrected Snellen visual acuity testing, slit lamp examination, Goldmann applanation tonometry, gonioscopic evaluation, dilated fundus examination using a 90-diopter lens, and visual field evaluation using the 30-2 SITA-Standard algorithm (Humphrey Instruments, San Leandro, CA, USA).
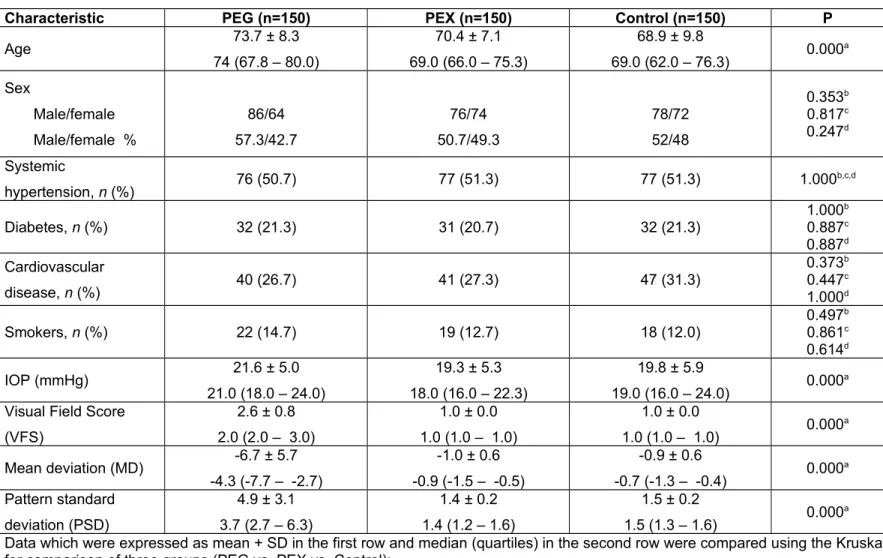
The demographic characteristics of the study participants are given in Table 1. The mean ages in the PEG, PEX and control groups were 73.7± 8.3, 70.4 ± 7.1 and 68.9 ± 9.8, respectively, and the percentages of male subjects were 57.3%, 50.7% and 52%, respectively. Information about systemic hypertension, diabetes, and smoking status is also included in Table 1. Hypertension was defined in subjects with systolic blood pressure > 140 mmHg and/or diastolic blood pressure > 90 mmHg and/or use of antihypertensive drugs. Diabetes was defined as fasting glucose levels ≥ 6.99 mmol/L and/or use of pharmacological treatment. Smoking status was assigned “yes” if the individual was currently smoking or quit less than 3 months previously. No significant difference was found between the study groups in terms of the prevalence of hypertension, diabetes or smoking.
Visual field score (VFS), mean deviation (MD), and pattern standard deviation (PSD) values are also given in Table 1. The visual field was staged using the Advanced Glaucoma Intervention Study scoring system [31], which takes into consideration the number and depth of neighboring depressed test locations on the total deviation plot in the nasal area, upper hemifield, and lower hemifield, dividing the visual field into 4 concentric-like regions, with the outermost being the most sensitive to a depression. Each visual field is given a score between 0 and 20, where 0 indicates that no defective points were measured, and 20 indicates that at least 2 depressed locations in the nasal area and 9 depressed locations in each hemifield were measured. The healthiness of a visual field is categorized based on this score: (i) a score of 0 is a normal field, categorized as stage 1; (ii) scores 1–5 are fields with mild damage, categorized as stage 2; (iii) scores 6–11 are fields with moderate damage, categorized as stage 3; (iv) scores 12–17 are fields with severe damage, categorized as stage 4; (v) scores 18–20 are end-stage fields, categorized as stage 5. All the fields of the study participants could be unambiguously classified.
The exclusion criteria were having other eye disorders such as uveitis and age-related macular degeneration, having kidney disease, having any central nervous system disease that might interfere with a visual field test, and using non-steroidal anti-inflammatory drugs, supplemental vitamin C and/or vitamin E, or diuretics. Peripheral blood samples were taken from all the study participants through venipuncture and stored at −80 °C until use.
Determination of genetic variations
Genomic DNA was isolated from the whole blood samples using the method described by Lahiri and Schnabel [32]. Standard PCR, followed by restriction enzyme digestions was employed to determine the −107T/C (rs705379), 192Q/R (rs662) and 55L/M (rs854560) genotypes of all subjects, as described previously [33,34]. The PCR mixtures contained specific primers as given in Campo et al. [35].
The PCR reaction of a total volume of 50 μL contained 400 ng template genomic DNA, 200 mmol/L of each dNTPs, 400 nmol/L of each primer, 2.0 mmol/L MgCl2, and 1.25 units of Taq polymerase. The PCR conditions were an initial melting temperature of 94 C for 3 min, followed by 35 cycles of melting (95 C, 30 s), annealing (67 C for −107T/C, 60.5 C for 192Q/R and 59 C for 55L/M, 20 s), and extension (72 C, 50 s), with an additional final extension step (72 C, 10 min).
The expected PCR product length for the −107T/C variation was 240 bp. All PCR products with the expected length were subjected to digestion with 10-unit BsrBI at 37 C for 45 min, which resulted in 28 and 212 bp fragments for the C allele and a non-digested 240 bp fragment for the T allele. For the 192Q/R variation, PCR products with the expected length of 238 bp were digested with 2-unit AlwI at 55 °C for 17 h, resulting in 66 and 172 bp fragments for the 192R allele and a non-digested 238 bp fragment for the 192Q allele. The PCR products for the 55L/M variationwith the expected length of 172 bp were digested with 5-unit NlaIII at 37 °C for 17 h. The digestion resulted in 66 and 106 bp fragments for the 55M allele and a non-digested 172 bp fragment for the 55L allele. Digestion products were resolved by 2.5% agarose gel electrophoresis and visualized by ethidium bromide staining. The allele frequencies were obtained by direct gene counting.
Statistical analysis
The continuous variables and the interval variable, namely VFS, are expressed as mean values ± SD, median, and the first and third quartiles. The normality of the sample distribution was investigated with the Kolmogorov–Smirnov test, finding that none of the samples followed a normal distribution. Therefore, differences between the three groups were determined by the Kruskal-Wallis test, and Conover’s formula [36] was used as a post-hoc test to demonstrate which of the two groups differed significantly.When there are two groups (such as the genotypes in Tables 5, 6, and 7), they were compared using the Mann– Whitney U test. The categorical variables are expressed as frequencies and percentages and they were compared using the chi-squared test or Fisher’s exact test. The Bonferroni correction was used to correct for the statistical significance level for multiple testing; for example, a P value of 0.05 was reduced to 0.0083 when 6 comparisons were employed (0.05 / 6). The strength of the association of the genotypes and alleles with PEX or PEG was estimated by calculating the odds ratio (OR) values. Two-tailed probability values with 95% confidence intervals (CIs) were estimated for each OR. Logistic regression analysis with the backward stepwise (likelihood ratio) method was used to test the ability of the study parameters to predict PEX and/or PEG status. The Hosmer–Lemeshow goodness-of-fit test was used for the calibration of the logistic regression. SPSS version 16.0 (Chicago, Illinois, USA) was used for these statistical analyses. P values of < 0.05 were considered statistically significant, unless indicated otherwise. The “Genetic Association Study (GAS) Power Calculator” was used for sample size calculation [37]. A power value > 50% was considered adequate. With the lowest allele frequency being 0.18, disease prevalence 10%, and significance level 0.05, the calculated power at the start of the study was 62% with 150 subjects in each study group. The observed lowest power at the end of the study was 71%, with 0.25 as the lowest observed allele frequency.
Results
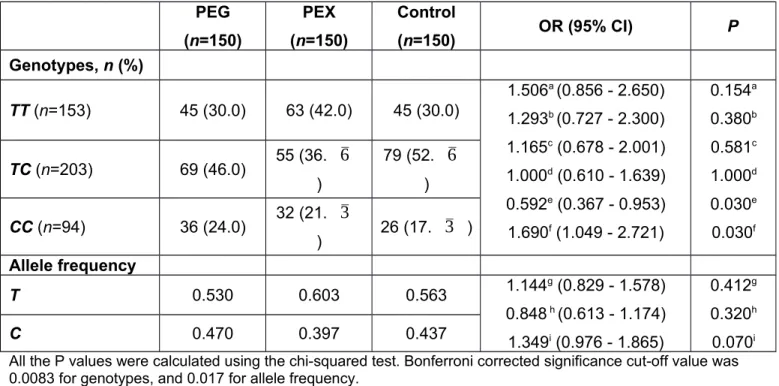
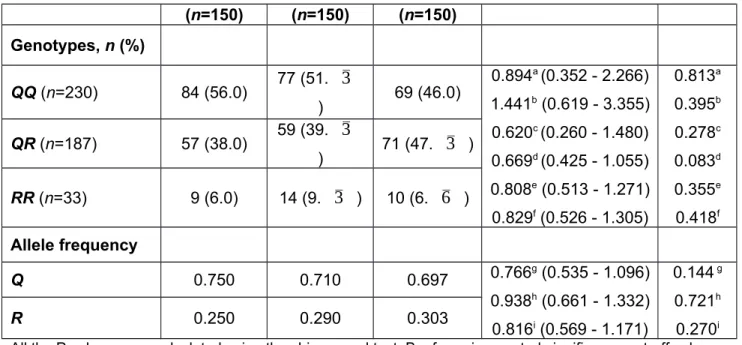
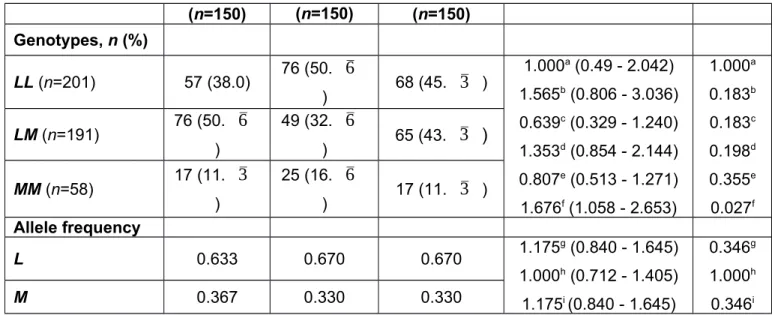
In this study we determined the PON1 −107T/C (rs705379), 192Q/R (rs662) and 55L/M (rs854560) genotypes of PEX patients, PEG patients, and healthy controls. The results are presented in Tables 2, 3, and 4. The −107C allele frequency was found to be 0.397 in the PEX patients, 0.470 in the PEG patients and 0.437 in the controls (Table 2). The distribution of the C allele was not significantly different between the three study groups. Although the genotype distribution in the dominant model (CC + TC vs. TT) resulted in a P value of 0.030 between the PEX patients and the controls as well as between the PEG patients and the PEX patients, this result showed no significant association after multiple testing with a significance cut-off value of 0.0083. The 192Q/R genotype and allele frequencies did not differ significantly between the groups (Table 3). The R allele frequencies were 0.250, 0.290 and 0.303 in the PEG, PEX, and control groups, respectively. Similarly, the frequencies of the 55M allele were not different between the three study groups (Table 4). The genotype distribution was also not significantly different between the study groups after multiple testing correction is applied.
We also analyzed the distribution of the triple combined genotypes of the PON1 gene in the study groups. It was observed that the QQLLCC genotype was more expressed in PEX patients than in the controls (OR = 3.222, P = 0.035). Likewise, QQLMTC genotype was
more represented in the PEG patients than the PEX group (OR = 2.037, P = 0.041). The prevalence of the QRLLTC genotype was lower in the PEX patients (OR = 0.469, P = 0.029) and PEG patients (OR = 0.396, P = 0.010) compared with the controls. However, after multiple testing correction, only the distribution of QRLLTC genotype between PEG patients and controls reached statistical significance.
Stratification analysis was carried out to reveal any differences in visual clinical parameters according to the presence of the minor PON1 alleles (Tables 5, 6, and 7). Even though PSD was higher in PEX patients with at least one −107C allele compared with PEX patients with the wild type genotype (−107TT) (P = 0.038), and having at least one 55M allele decreased the IOP of the controls (P = 0.041), none of these P values reached statistical significance after correction for multiple testing by Bonferroni. PON1 192Q/R genotypes had no significant effect on visual clinical parameters. In Table 8, we have shown the comparison between the frequencies of minor PON1 alleles across the 5 VFS groups, no significantly over- or underrepresented allele was observed.
Correlation coefficients were also calculated to reveal the strength of the association between the parameters in this study. In the overall study population, IOP was found to be significantly inversely correlated with sex (r = −0.116, P = 0.011), in other words IOP was significantly directly correlated with being female. The same significant correlation was also observed in the PEG group (r = −0.189, P = 0.019). In the overall study population, IOP was also correlated with VFS (r =0.179, P = 0.000), MD (r = −0.149, P = 0.001) and PSD (r = 0.134, P = 0.003). In the PEG group, VFS was significantly correlated with MD (r = −0.946, P = 0.000) and PSD (r = −0.829, P = 0.000), as expected. In the PEX group, PSD was significantly correlated with the PON1 −107T/C genotypes (r = 0.176, P = 0.031). In the control group, IOP was correlated with the PON1 55L/M genotypes (r = −0.249, P = 0.002) and MD was correlated with the PON1 −107T/C genotypes (r = 0.199, P = 0.014).
Logistic regression analysis was performed with the PON1 192Q/R, 55L/M and −107T/C genotypes, and the age, sex, hypertension, diabetes, cardiovascular disease, smoking, IOP, VFS, MD and PSD parameters entered on step 1. In the bivariate regression analysis using the backward LR method, only a PEG–control, PEX–control or PEG–PEX risk analysis was performed at each time. The PON1 −107TC + CC genotype was found to be significantly associated with the PEX group compared with the control (OR = 1.909, 95% CI = 1.107– 3.293, P=0.020). No parameter was found to be a significant predictor through the PEG– control and PEG–PEX comparisons. The model correctly predicted 60% of the cases, and the Hosmer–Lemeshow goodness-of-fit test demonstrated that the calibration of the model was satisfactory (χ2 = 9.854, 8 df, P = 0.275) for logistic regression.
Discussion
Glaucoma is one of the leading causes of blindness in the elderly, and PEG is one of the rare forms of glaucoma. As previously mentioned, PEX and PEG are insidious diseases; the presence of pseudoexfoliation material, even with an increase in IOP, cannot be recognized by patients themselves. Moreover, the prognosis for PEG is worse than that for primary open angle glaucoma (POAG); as the IOP in PEG can rise dramatically within months and is much higher than in POAG. IOP-lowering medication is used as the first step in the management of
PEG. Although early diagnosis is therefore very important in PEX/PEG, there are unfortunately no valid objective biomarkers that can be used for this [38].
Moreover, PEG is known to be more resistant to medical therapy than POAG. While the success of laser trabeculoplasty to enhance aqueous drainage is high in PEG patients, its effects might diminish over time and IOP may increase again. The last treatment option would be advanced surgical interventions such as trabeculectomy or glaucoma drainage device implantation[39].
The ultimate treatment solution for PEX and PEG requires that PEX pathogenesis be fully elucidated and its early biomarkers defined. The disturbed local oxidative/antioxidative environment leading to PEX development can be a result of a PON1 enzyme with low activity and/or low expression levels. The main physiological function of PON1 is to degrade oxidized lipids and oxidized cholesteryl esters in lipoproteins. The anti-inflammatory roles of PON1 include coordinating the inflammatory response by inactivating oxidant and pro-inflammatory mediators and inhibiting the production of cytokine monocyte chemoattractant protein-1 [40]. Hence, PON1 has been shown to be involved in the pathogenesis of diseases such as diabetes, coronary artery disease (CAD), cerebrovascular disease, and ischemic stroke, which share the common pathophysiology of oxidative stress and inflammation [33,41-43]. In our previous studies, we also determined that some genotypes of PON1 are significantly related with atherothrombotic ischemic stroke [33]. The pathophysiology of PEX shares common features with that of cardiovascular and cerebrovascular diseases, such as vascular endothelial dysfunction, elastosis in the vessel wall, increased vascular resistance, and decreased blood flow velocity, hyperhomocysteinemia, and disorders of the extracellular matrix [44]. Thus, PON1 is the candidate protein with the most potential to have an important role in the pathogenesis of PEX/PEG as well as other types of glaucoma.
Liton et al. [45] analyzed the genome-wide expression profile of human trabecular meshwork cultured cells from nonglaucomatous and POAG tissue, observing statistically significant upregulation of several genes associated with inflammation and acute-phase response, including E-selectin, as well as the downregulation of the antioxidants paraoxonase 3 and ceruloplasmin. Joe and Tomarev [46] found that antioxidant proteins paraoxonase 2 and glutathione peroxidase 3 are down-regulated in the eye angle tissue of transgenic mice expressing a myocilin mutant. Mutations in the myocilin gene are associated with juvenile and adult-onset primary open-angle glaucoma.
Some previous research has investigated PON1 enzyme activity in PEX, PEG, and other types of glaucoma [10,12,13,47,48]. Yağcı et al. [10] reported lower serum paraoxonase activity in PEX patients. Dursun et al. [13] found that the serum and aqueous humor paraoxonase and arylesterase activity of PEX and PEG patients were significantly decreased compared with the control group. Moreover, these parameters were found to be significantly different between PEX and PEG groups. However, the paraoxonase and arylesterase activities of the aqueous humor did not differ significantly between the PEX and PEG patients [13]. Decreased PON1 activity, as well as increased MDA and 8-hydroxy-2′-deoxyguanosine (8-OHdG) levels, implying increased oxidative stress, were observed in patients with primary open-angle glaucoma [47]. In our previous study, we observed that the basal serum PON1 activity of PEX patients was significantly higher than that of the controls; on the other hand, there was no difference between the PEG patients and the controls in terms of basal PON1 activity. Salt-induced PON1 activity and arylesterase activity did not differ significantly
between the patients and controls either. Three phenotypes were then determined by considering the proportion of stimulated PON1 activity to arylesterase activity: AA (low activity), AB (moderate activity), and BB (high activity). The BB phenotype was more common in the PEX patients (25%) than in the controls (3.1%) [12]. The BB phenotype has a low antioxidant protection capacity, but a high (salt-induced) paraoxon hydrolysis rate [49]. Thus, our findings indicated a possible role for the anti-oxidant and anti-inflammatory PON1 enzyme in the pathogenesis of PEX [12]. A recent study in the Turkish population also analyzed PON1 phenotypes in PEG as well as normal tension glaucoma (NTG). The prevalence of the RR phenotype (corresponding to the BB phenotype in our previous work) was reported to be 6.5%, 3.1%, and 7.5% in the PEG, NTG, and control groups, respectively. However, this study did not identify any statistically significant variation in the PON1 phenotypes of the PEG, NTG, and control groups [48].
There is considerable variation in the activity and expression levels of PON1 even in healthy populations [50-53], which is determined by the coding region (192Q/R, 55L/M) and the promoter region (−107T/C) variations of the PON1 gene as well as life-style and dietary factors [23-28, 54]. Nevertheless, the largest effect on PON1 activity levels, which can vary by over 40-fold between individuals, comes from PON1 genetic variations [28]. Therefore, in the present study we investigated the possible association between three important PON1 variants (192Q/R, 55L/M and −107T/C) and PEX/PEG risk. The results did not indicate a significant role of the minor alleles of these varaints alone in PEX/PEG. However, the 55L/M and −107T/C genotype distributions and some triple combined haplotypes were significantly related with PEX/PEG status. Logistic regression analysis revealed that having at least one C allele in the −107 position of the PON1 gene is significantly associated with PEX. A T allele at position –107 disrupts the recognition sequence for stimulating protein-1, and –107TT genotype is associated with the lowest serum PON1 levels [22]. The high expressor −107C allele and 55L alleles of the PON1 gene are in strong linkage disequilibrium [55], and PON1 enzyme with leucine as the 55th amino acid (the L allele) has the lowest lipid peroxide protection activity [49]. Therefore, even though individuals with the PON1 −107C allele have high expression levels of PON1, the enzyme conveys low protection against oxidation. Knowledge about patients’ PON1 genetic profile can also be of interest to glaucoma patients and ophthalmologists because some medications used in glaucoma treatment are metabolized by the PON1 enzyme. For example, the major metabolic pathways of pilocarpine, a medication used for the treatment of angle closure glaucoma to decrease IOP, includes hydrolysis by the PON1 enzyme. Moreover, it has been shown that the PON1 192Q/R variation affects pilocarpine hydrolase activity [56].
No other genetic association studies in the literature have analyzed the role of PON1 variants in PEG and PEX risk. However, in a Chinese population the PON1 192Q/R genetic variation was reported as significantly associated with POAG [57]. On the other hand, in a study analyzing the associations of PON1 55L/M and 192Q/R, as well as PON2 311S/C and PAF-AH/V279F with POAG and normal-tension glaucoma in a Japanese population, the genotype and allele frequencies of these alterations did not differ significantly between any patient group and controls. Interestingly, the IOP at diagnosis was significantly higher in glaucoma patients carrying PON1 192R than in patients not carrying it (P = 0.006) [58]. We also analyzed the relationship between PON1 genetic variations and visual clinical characteristics. Even though we did not find any association between the 192Q/R variation
and visual clinical characteristics, PEX patients with at least one −107C allele had higher PSD scores. Moreover, PSD was correlated with the −107T/C genotypes of the PEX patients and MD was correlated with the −107T/C genotypes of the controls. Furthermore, having at least one 55M allele was associated with lower IOP, and IOP was negatively correlated with the 55L/M genotypes of the controls. This finding may be due to the association of the 55M allele of PON1 with the greatest protective capacity against LDL oxidation, and the association of 55L with the lowest [48]. On the other hand, we did not observe any allele to be overrepresented according to visual field severity stage; in other words, VFS was not associated with the PON1 variants. The inconsistency of our findings with those of Inagaki et al. [58] and Zhou and Liu [57] might be due to differences in the pathogenesis of PEX/PEG and open angle glaucoma, as well as differences in the ethnicities and life-style (e.g., smoking, diet, exercise) of the populations studied.
PEX is best described as a systemic disorder because pseudoexfoliation deposits have also been found in the skin, lung, heart, liver, gall bladder, kidneys and meninges [59]. The presence of PEX is significantly associated with a high risk of hypertension, myocardial infarction, CAD, and stroke [60-63]. Moreover, PEX patients have been observed to have myocardial ischemia at a subclinical stage, verified by tissue Doppler echocardiography, in a Turkish population [64]. In addition, PEG was also found to be significantly associated with the presence of cardiovascular disorders [65]. On the other hand, some studies have reported no significant relationship between PEX and any systemic diseases such as hypertension, cardiovascular disease, and diabetes [66], as well as cerebrovascular disease [67-71]. Similarly, Emiroglu et al. did not find any association between PEX and CAD, aortic aneurysm, or peripheral artery disease [72]. In the present study, the prevalence of systemic hypertension, diabetes, and the percentage of smokers did not differ significantly between the PEG, PEX, and control groups.
A limitation of this study was the lack of access to serum samples of all the subjects, for the evaluation of their PON1 enzyme activity levels. Further studies analyzing PON1 status and genetic variations at the same time might provide more information about their relation with PEX/PEG. There are still no valid and objective early biomarkers for these disorders. Therefore, carefully designed multidisciplinary studies are still needed to find objective parameters that can be used for the early diagnosis of PEX and the discrimination of PEX patients prone to developing PEG so that precautions can be taken before the damage to the optic nerve advances.
In conclusion, this study, for the first time, evaluated PON1 genetic variations in relation to their association with PEX and PEG, and the results indicate that the PON1 promoter variation might have has some involvement in the pathogenesis of PEX. Given the large inter-ethnic variability in PON1 expression levels which result mainly from different distribution of genetic variations, further studies in other populations might help clear the role of PON1 in these disorders.
Acknowledgment
The authors thank the subjects for their participation in this study, Dr. Tarkan Mumcuoğlu and Dr. Gökhan Özge for sample collection.
Funding
This study was supported by a research grant from TUBITAK 315S190. Compliance with Ethical Standards:
Conflict of interest
The authors declare that they have no conflict of interest. Informed consent
Informed consent was obtained from all individual participants included in the study.
Ethical approval
All procedures performed in studies involving human participants were in accordance with the ethical standards of the institutional and/or national research committee and with the 1964 Helsinki declaration and its later amendments or comparable ethical standards.
References
1. Elhawy E, Kamthan G, Dong CQ, Danias J (2012) Pseudoexfoliation syndrome, a systemic disorder with ocular manifestations. Hum Genomics 6:22.
https://doi.org/10.1186/1479-7364-6-22
2. Colin J, Gall GL, Jeune BL, Cambrai MD (1988) The prevalence of exfoliation syndrome in different areas of France. Acta Ophthalmol Suppl 184:86-89.
https://doi.org/10.1111/j.1755-3768.1988.tb02634.x
3. Grødum K, Heijl A, Bengtsson B (2005) Risk of glaucoma in ocular hypertension with and without pseudoexfoliation. Ophthalmology 112(3):386-390.
https://doi.org/10.1016/j.ophtha.2004.09.024
4. Jeng SM, Karger RA, Hodge DO, Burke JP, Johnson DH, Good MS (2007) The risk of glaucoma in pseudoexfoliation syndrome. J Glaucoma 16(1):117-121.
https://doi.org/10.1016/j.sjopt.2011.07.001
5. Koliakos GG, Konstas AGP, Schlotzer-Schrehardt U, Bufidis T, Georgiadis N, Ringvold A (2002) Ascorbic acid concentration is reduced in the aqueous humor of patients with exfoliation syndrome. Am J Ophthalmol 134:879-883
https://doi.org/10.1016/S0002-9394(02)01797-X
6. Funatsu H, Yamashita H, Ikeda T, Mimura T, Eguchi S, Hori S (2003) Vitreous levels of interleukin-6 and vascular endothelial growth factor are related to diabetic macular edema. Ophthalmology 110(9):1690-1696.
https://doi.org/10.1016/S0161-6420(03)00568-2
7. Yilmaz A, Adiguzel U, Tamer L, Yildirim O, Oz O, Vatansever H, Ercan B, Değirmenci US, Atik U (2005) Serum oxidant/antioxidant balance in exfoliation syndrome. Clin Exp Ophthal 33:63-66.
8. Gartaganis SP, Patsoukis NE, Nikolopoulos DK, Georgiou CD (2007) Evidence for oxidative stress in lens epithelial cells in pseudoexfoliation syndrome. Eye (Lond) 21(11):1406-11.
https://doi.org/10.1038/sj.eye.6702596
9. Koliakos GG, Befani CD, Mikropoulos D, Ziakas NG, Konstas AG (2008) Prooxidant-antioxidant balance, peroxide and catalase activity in the aqueous humour and serum of patients with exfoliation syndrome or exfoliative glaucoma. Graefes Arch Clin Exp Ophthalmol 246(10):1477-83.
https://doi.org/10.1007/s00417-008-0871-y
10. Yağci R, Gürel A, Ersöz I, Karadağ R, Hepşen IF, Duman S (2009) The activities of paraoxonase, xanthine oxidase, adenosine deaminase and the level of nitrite in pseudoexfoliation syndrome. Ophthalmic Res 42(3):155-9.
https://doi.org/10.1159/000229306
11. Yildirim Z, Yildirim F, Uçgun NI, Sepici-Dinçel A (2013) The role of the cytokines in the pathogenesis of pseudoexfoliation syndrome. Int J Ophthalmol 6(1):50-53. https://doi.org/10.3980/j.issn.2222-3959.2013.01.10
12. Can Demirdöğen B, Ceylan OM, Işıkoğlu S, Mumcuoğlu T, Erel Ö (2014) Evaluation of oxidative stress and paraoxonase phenotypes in pseudoexfoliation syndrome and pseudoexfoliation glaucoma. Clin Lab 60(1):79-86.
https://doi.org/10.7754/Clin.Lab.2013.121229
13. Dursun F, Ozec AV, Aydin H, Topalkara A, Dursun A, Toker MI, Erdogan H, Arici MK (2015) Total oxidative stress, paraoxonase and arylesterase levels at patients with pseudoexfoliation syndrome and pseudoexfoliative glaucoma. Int J Ophthalmol 8(5):985-990.
https://doi.org/10.3980/j.issn.2222-3959.2015.05.24
14. Sarenac-Vulovic TS, Pavlovic SM, Jakovljevic VLJ, Janicijevic KB, Zdravkovic NS (2016a) Nitric oxide and tumour necrosis factor alpha in the process of pseudoexfoliation glaucoma. Int J Ophthalmol 9(8):1138-42.
https://doi.org/10.18240/ijo.2016.08.09
15. Sarenac-Vulovic TS, Pavlovic SM, Zdravkovic NS (2016b) Proinflammatory cytokines induce XFG development. Ocul Immunol Inflamm 24(6):671-677.
https://doi.org/10.3109/09273948.2015.1063672
16. Chowdhury UR, Madden BJ, Charlesworth MC, Fautsch MP (2010) Proteome Analysis of Human Aqueous Humor. Invest Ophthalmol Vis Sci 51(10):4921-31. https://doi.org/10.1167/iovs.10-5531
17. Zhou L, Zhao SZ, Koh SK, Chen L, Vaz C, Tanavde V, Li XR, Beuerman RW (2012) In-depth analysis of the human tear proteome. Journal of Proteomics 75(13):3877-85. https://doi.org/10.1016/j.jprot.2012.04.053
18. Mackness B, Mackness M (2010) Anti-inflammatory properties of paraoxonase-1 in atherosclerosis. Adv Exp Med Biol 660:143-51.
https://doi.org/10.1007/978-1-60761-350-3_13
19. Aharoni S, Aviram M, Fuhrman B (2013) Paraoxonase 1 (PON1) reduces macrophage inflammatory responses. Atherosclerosis 228(2):353-61.
20. Deakin SP, James RW (2004) Genetic and environmental factors modulating serum concentrations and activities of the antioxidant enzyme paraoxonase-1. Clin Sci (Lond) 107(5):435-447.
https://doi.org/10.1042/CS20040187
21. Garin MC, James RW, Dussoix P, Blanché H, Passa P, Froguel P, Ruiz J (1997) Paraoxonase polymorphism Met-Leu 54 is associated with modified serum concentrations of the enzyme. A possible link between the paraoxonase gene and increased risk of cardiovascular disease in diabetes. J Clin Invest 99:62-6. https://doi.org/10.1172/JCI119134
22. Brophy VH, Jampsa RL, Clendenning JB, McKinstry LA, Jarvik GP, Furlong CE (2001) Effects of 5’ regulatory-region polymorphisms on paraoxonase gene (PON1) expression. Am J Hum Genet 68:1428-36.
https://doi.org/10.1086/320600
23. Debord J, Dantoine T, Bollinger JC, Abraham MH, Verneuil B, Merle L (1998) Inhibition of arylesterase by aliphatic alcohols. Chem Biol Interact 113:105-15. https://doi.org/10.1016/S0009-2797(98)00018-0
24. James RW, Leviev I, Righetti A (2000) Smoking is associated with reduced serum paraoxonase activity and concentration in patients with coronary artery disease. Circulation 101:2252-57.
https://doi.org/10.1161/01.CIR.101.19.2252
25. Tomás M, Sentí M, Elosua R, Vila J, Sala J, Masià R, Marrugat J (2001) Interaction between the Gln-Arg 192 variants of the paraoxonase gene and oleic acid intake as a determinant of high-density lipoprotein cholesterol and paraoxonase activity. Eur J Pharmacol 432(2-3):121-128.
https://doi.org/10.1016/S0014-2999(01)01482-0
26. Rao MN, Marmillot P, Gong M, Palmer DA, Seeff LB, Strader DB, Lakshman MR (2003) Light, but not heavy alcohol drinking, stimulates paraoxonase by upregulating liver mRNA in rats and humans. Metabolism 52:1287-94.
https://doi.org/10.1016/S0026-0495(03)00191-4
27. Aviram M, Rosenblat M, Gaitini D, Nitecki S, Hoffman A, Dornfeld L, Volkova N, Presser D, Attias J, Liker H, Hayek T (2004) Pomegranate juice consumption for 3 years by patients with carotid artery stenosis (CAS) reduces common carotid intima-media thickness (IMT), blood pressure and LDL oxidation. Clin Nutr 23:423-433. https://doi.org/10.1016/j.clnu.2003.10.002
28. Mackness M, Mackness B (2015) Human paraoxonase-1 (PON1): gene structure and expression, promiscuous activities and multiple physiological roles. Gene 567:12-21. https://doi.org/10.1016/j.gene.2015.04.088
29. Ritch R, Schlötzer-Schrehardt U (2001) Exfoliation syndrome. Surv Ophthalmol 45(4):265-315.
https://doi.org/10.1016/S0039-6257(00)00196-X
30. Ceylan OM, Can Demirdöğen B, Mumcuoğlu T, Aykut O (2013) Evaluation of essential and toxic trace elements in pseudoexfoliation syndrome and pseudoexfoliation glaucoma. Biol Trace Elem Res 153(1-3):28-34.
31. The Advanced Glaucoma Intervention Study Investigators (1994) Advanced Glaucoma Intervention Study. 2. Visual field test scoring and reliability. Ophthalmology 101:1445-1455.
https://doi.org/10.1016/S0161-6420(94)31171-7
32. Lahiri DK, Schnabel B (1993) DNA isolation by a rapid method from human blood samples: effects of MgCl2, EDTA, storage time, and temperature on DNA yield and quality. Biochem Genet 31(7-8):321-328.
https://doi.org/10.1007/BF02401826
33. Can Demirdöğen B, Türkanoğlu A, Bek S, Sanisoğlu Y, Demirkaya Ş, Vural O, Arınç E, Adalı O (2008) Paraoxonase/arylesterase ratio, PON1 192Q/R polymorphism and PON1 status are associated with increased risk of ischemic stroke. Clin Biochem 41(1-2):1-9.
https://doi.org/10.1016/j.clinbiochem.2007.08.010
34. Can Demirdöğen B, Demirkaya Ş, Türkanoğlu A, Bek S, Arınç E, Adalı O (2009) Analysis of paraoxonase 1 (PON1) genetic polymorphisms and activities as risk factors for ischemic stroke in Turkish population. Cell Biochem Funct 27(8):558-567. https://doi.org/10.1002/cbf.1607
35. Campo S, Sardo MA, Trimarchi G, Bonaiuto M, Fontana L, Castaldo M, Bonaiuto A, Saitta C, Bitto A, Manduca B, Riggio S, Saitta A (2004) Association between serum paraoxonase (PON1) gene promoter T(-107)C polymorphism, PON1 activity and HDL levels in healthy Sicilian octogenarians. Exp Gerontol 39:1089-94. https://doi.org/10.1016/j.exger.2004.03.017
36. Conover WJ (1980) Chapter 5 Some methods based on ranks, Section 5.2 Several independent samples.In: Conover WJ (ed) Practical Nonparametric Statistics, 2nd edn. John Wiley & Sons, New York, pp 229-239.
37. http://csg.sph.umich.edu/abecasis/cats/gas_power_calculator/ last accessed: May 3rd, 2019.
38. Majka CP, Challa P (2006) Diagnosis and Management of Pseudoexfoliation Glaucoma. EyeNet Magazine.
https://www.aao.org/eyenet/article/diagnosis-management-of-pseudoexfoliation-glaucoma. Accessed 10 January 2019.
39. Brissette AR, Schweitzer K, Campbell RJ (2011) Answer: Can you identify this condition? Can Fam Physician 57(6):687-688.
40. Camps J, García-Heredia A, Rull A, Alonso-Villaverde C, Aragonès G, Beltrán-Debón R, Rodríguez-Gallego E, Joven J (2012) PPARs in Regulation of Paraoxonases: Control of Oxidative Stress and Inflammation Pathways. PPAR Res 2012:616371. http://dx.doi.org/10.1155/2012/616371
41. Mackness B, Mackness MI, Arrol S, Turkie W, Julier K, Abuasha B, Miller JE, Boulton AJ, Durrington PN (1998) Serum paraoxonase (PON1) 55 and 192 polymorphism and paraoxonase activity and concentration in non-insulin dependent diabetes mellitus. Atherosclerosis 139:341-49.
https://doi.org/10.1016/S0021-9150(98)00095-1
42. McElveen J, Mackness MI, Colley CM, Peard T, Warner S, Walker CH (1986) Distribution of paraoxon hydrolytic activity in the serum of patients after myocardial infarction. Clin Chem 32:671-3.
Furlong CE (2000) Paraoxonase (PON1) phenotype is a better predictor of vascular disease than is PON1 (192) or PON1 (55) genotype. Arterioscler Thromb Vasc Biol 20:2441-2447.
https://doi.org/10.1161/01.ATV.20.11.2441
44. Andrikopoulos GK, Alexopoulos DK, Gartaganis SP (2014) Pseudoexfoliation syndrome and cardiovascular diseases. World J Cardiol 6(8):847-54. https://doi.org/10.4330/wjc.v6.i8.847
45. Liton PB, Luna C, Challa P, Epstein DL, Gonzalez P (2006) Genome-wide expression profile of human trabecular meshwork cultured cells, nonglaucomatous and primary open angle glaucoma tissue. Mol Vis 12:774-90.
46. Joe MK, Tomarev SI (2010) Expression of myocilin mutants sensitizes cells to oxidative stress-induced apoptosis: implication for glaucoma pathogenesis. Am J Pathol 176(6):2880-90.
https://doi.org/10.2353/ajpath.2010.090853
47. Mumcu UY, Kocer I, Ates O, Alp HH (2016) Decreased paraoxonase1 activity and increased malondialdehyde and oxidative DNA damage levels in primary open angle glaucoma. Int J Ophthalmol 9(10):1518-1520.
https://doi.org/10.18240/ijo.2016.10.24
48. Yilmaz N, Coban DT, Bayindir A, Erol MK, Ellidag HY, Giray O, Sayrac S, Tekeli SO, Eren E (2016) Higher serum lipids and oxidative stress in patients with normal tension glaucoma, but not pseudoexfoliative glaucoma. Bosn J Basic Med Sci 16(1):21-27. https://doi.org/10.17305/bjbms.2016.830
49. Aviram M, Billecke S, Sorenson R, Bisgaier C, Newton R, Rosenblat M, Erogul J, Hsu C, Dunlop C, La Du B (1998) Paraoxonase active site required for protection against LDL oxidation involves its free sulfhydryl group and is different from that required for its arylesterase/paraoxonase activities: selective action of human paraoxonase alloenzymes Q and R. Arterioscler Thromb Vasc Biol 10:1617-24.
https://doi.org/10.1161/01.ATV.18.10.1617
50. Zech R, Zurcher K (1974) Organophosphate splitting serum enzymes in different mammals. Comp Biochem Physiol 48:427-433.
51. Playfer JR, Eze LC, Bullen MF, Evans DA (1976) Genetic polymorphism and interethnic variability of plasma paraoxonase activity. J Med Genet 13:337-342. 52. Furlong CE, Richter RJ, Seidel SL, Motulsky AG (1988) Role of genetic polymorphism
of human plasma paraoxonase/arylesterase in hydrolysis of the insecticide metabolites chlorpyrifos oxon and paraoxon. Am J Hum Genet 43:230-238.
53. Eckerson HW, White CM, La Du BN (1983) The human serum paraoxonase/arylesterase polymorphism. Am J Hum Genet 35:1126-38.
54. Aviram M (2003) Dietary antioxidants stimulate the expression of paraoxonases which provides protection against atherosclerosis development. Curr Topics Nutraceutical Res 3:161-9.
55. Brophy VH, Jarvik GP, Furlong CE (2002) PON1 polymorphisms. In: Costa LG, Furlong CE (eds) Paraoxonase (PON1) in Health and Disease: Basic and Clinical Aspects. Norwell, MA: Kluwer Acad, pp 53-77.
56. Hioki T, Fukami T, Nakajima M, Yokoi T (2011) Human paraoxonase 1 is the enzyme responsible for pilocarpine hydrolysis. Drug Metab Dispos 39(8):1345-52.
57. Zhou G, Liu B (2010) Single nucleotide polymorphisms of metabolic syndrome-related genes in primary open angle glaucoma. Int J Ophthalmol 3(1):36-42.
https://doi.org/10.3980/j.issn.2222-3959.2010.01.09
58. Inagaki Y, Mashima Y, Funayama T, Ohtake Y, Fuse N, Yasuda N, Fukuchi T, Murakami A, Hotta Y (2006) Paraoxonase 1 gene polymorphisms influence clinical features of open-angle glaucoma. Graefes Arch Clin Exp Ophthalmol 244(8):984-90. https://doi.org/10.1007/s00417-005-0200-7
59. Schlötzer-Schrehardt UM, Koca MR, Naumann GO, Volkholz H (1992) Pseudoexfoliation syndrome. Ocular manifestation of a systemic disorder? Arch Ophthalmol 110(12):1752-6.
https://doi.org/10.1001/archopht.1992.01080240092038
60. Mitchell P, Wang JJ, Smith W (1997) Association of pseudoexfoliation syndrome with increased vascular risk. Am J Ophthalmol 124(5):685-7.
https://doi.org/10.1016/S0002-9394(14)70908-0
61. Citirik M, Acaroglu G, Batman C, Yildiran L, Zilelioglu O (2007) A possible link between the pseudoexfoliation syndrome and coronary artery disease. Eye (Lond) 21(1):11-5.
https://doi.org/10.1038/sj.eye.6702177
62. Andrikopoulos GK, Mela EK, Georgakopoulos CD, Papadopoulos GE, Damelou AN, Alexopoulos DK, Gartaganis SP (2009) Pseudoexfoliation syndrome prevalence in Greek patients with cataract and its association to glaucoma and coronary artery disease. Eye (Lond) 23(2):442-7.
https://doi.org/10.1038/sj.eye.6702992
63. Sekeroglu MA, Bozkurt B, Irkec M, Ustunel S, Orhan M, Saracbasi O (2008) Systemic associations and prevalence of exfoliation syndrome in patients scheduled for cataract surgery. Eur J Ophthalmol 18(4):551-5.
https://doi.org/10.1177/112067210801800408
64. Demir N, Ulus T, Yucel OE, Kumral ET, Singar E, Tanboga HI (2011) Assessment of myocardial ischaemia using tissue Doppler imaging in pseudoexfoliation syndrome. Eye (Lond) 25(9):1177-80.
https://doi.org/10.1038/eye.2011.145
65. French DD, Margo CE, Harman LE (2012) Ocular pseudoexfoliation and cardiovascular disease: a national cross-section comparison study. N Am J Med Sci 4(10):468-73.
https://doi.org/10.4103/1947-2714.101987
66. Anastasopoulos E, Topouzis F, Wilson MR, Harris A, Pappas T, Yu F, Koskosas A, Founti P, Coleman AL (2011) Characteristics of pseudoexfoliation in the Thessaloniki Eye Study. J Glaucoma 20(3):160-166.
https://doi.org/10.1097/IJG.0b013e3181d9d8bd
67. Brajković J, Kalauz-Surać I, Ercegović A, Miletić-Jurić A, Sušić N, Burić Z (2007) Ocular pseudoexfoliation syndrome and internal systemic diseases. Acta Clin Croat 46(Supp 1):57-61.
68. Allingham RR, Loftsdottir M, Gottfredsdottir MS, Thorgeirsson E, Jonasson F, Sverisson T, Hodge WG, Damji KF, Stefánsson E (2001) Pseudoexfoliation syndrome in Icelandic families. Br J Ophthalmol 85:702-707.
http://dx.doi.org/10.1136/bjo.85.6.702
69. Viso E, Rodríguez-Ares MT, Gude F (2010) Prevalence of pseudoexfoliation syndrome among adult Spanish in the Salnés eye Study. Ophthalmic Epidemiol 17:118-124.
https://doi.org/10.3109/09286581003624970
70. Praveen MR, Shah SK, Vasavada AR, Diwan RP, Shah SM, Zumkhawala BR, Thomas R (2011) Pseudoexfoliation as a risk factor for peripheral vascular disease: a case-control study. Eye (Lond) 25:174-179.
https://doi.org/10.1038/eye.2010.175
71. Spečkauskas M, Tamošiūnas A, Jašinskas V (2012) Association of ocular pseudoexfoliation syndrome with ischaemic heart disease, arterial hypertension and diabetes mellitus. Acta Ophthalmol 90:e470-e475.
https://doi.org/10.1111/j.1755-3768.2012.02439.x
72. Emiroglu MY, Coskun E, Karapinar H, Capkın M, Kaya Z, Kaya H, Akcakoyun M, Kargin R, Simsek Z, Acar G, Aung SM, Pala S, Ozdemir B, Esen AM, Kırma C (2010) Is pseudoexfoliation syndrome associated with coronary artery disease? N Am J Med Sci 2(10):487-90.
Table 1. Demographic and visual clinical characteristics of PEG and PEX patients and control subjects.
Characteristic PEG (n=150) PEX (n=150) Control (n=150) P
Age 73.7 ± 8.3 74 (67.8 – 80.0) 70.4 ± 7.1 69.0 (66.0 – 75.3) 68.9 ± 9.8 69.0 (62.0 – 76.3) 0.000 a Sex Male/female Male/female % 86/64 57.3/42.7 76/74 50.7/49.3 78/72 52/48 0.353b 0.817c 0.247d Systemic hypertension, n (%) 76 (50.7) 77 (51.3) 77 (51.3) 1.000 b,c,d Diabetes, n (%) 32 (21.3) 31 (20.7) 32 (21.3) 1.000b 0.887c 0.887d Cardiovascular disease, n (%) 40 (26.7) 41 (27.3) 47 (31.3) 0.373b 0.447c 1.000d Smokers, n (%) 22 (14.7) 19 (12.7) 18 (12.0) 0.497b 0.861c 0.614d IOP (mmHg) 21.6 ± 5.0 21.0 (18.0 – 24.0) 19.3 ± 5.3 18.0 (16.0 – 22.3) 19.8 ± 5.9 19.0 (16.0 – 24.0) 0.000 a
Visual Field Score (VFS) 2.6 ± 0.8 2.0 (2.0 – 3.0) 1.0 ± 0.0 1.0 (1.0 – 1.0) 1.0 ± 0.0 1.0 (1.0 – 1.0) 0.000 a Mean deviation (MD) -6.7 ± 5.7 -4.3 (-7.7 – -2.7) -1.0 ± 0.6 -0.9 (-1.5 – -0.5) -0.9 ± 0.6 -0.7 (-1.3 – -0.4) 0.000 a Pattern standard deviation (PSD) 4.9 ± 3.1 3.7 (2.7 – 6.3) 1.4 ± 0.2 1.4 (1.2 – 1.6) 1.5 ± 0.2 1.5 (1.3 – 1.6) 0.000 a
Data which were expressed as mean + SD in the first row and median (quartiles) in the second row were compared using the Kruskal-Wallis test; a P value is
for comparison of three groups (PEG vs. PEX vs. Control);
Data which were expressed as frequencies and percentages were compared using the chi-squared test; b PEG vs. control, c PEX vs. control, d PEG vs. PEX.
PEG (n=150) PEX (n=150) Control (n=150) OR (95% CI) P Genotypes, n (%) TT (n=153) 45 (30.0) 63 (42.0) 45 (30.0) 1.506a (0.856 - 2.650) 1.293b (0.727 - 2.300) 1.165c (0.678 - 2.001) 1.000d (0.610 - 1.639) 0.592e (0.367 - 0.953) 1.690f (1.049 - 2.721) 0.154a 0.380b 0.581c 1.000d 0.030e 0.030f TC (n=203) 69 (46.0) 55 (36. 6 ) 79 (52. 6 ) CC (n=94) 36 (24.0) 32 (21. 3 ) 26 (17. 3 ) Allele frequency T 0.530 0.603 0.563 1.144g (0.829 - 1.578) 0.848 h (0.613 - 1.174) 1.349i (0.976 - 1.865) 0.412g 0.320h 0.070i C 0.470 0.397 0.437
All the P values were calculated using the chi-squared test. Bonferroni corrected significance cut-off value was 0.0083 for genotypes, and 0.017 for allele frequency.
a PEG vs. Control, CC vs. TC+TT b PEX vs. Control, CC vs. TC+TT c PEG vs. PEX, CC vs. TC+TT d PEG vs. Control, CC+TC vs. TT e PEX vs. Control, CC+TC vs. TT f PEG vs. PEX, CC+TC vs. TT g PEG vs. Control, C vs. T h PEX vs. Control, C vs. T i PEG vs. PEX, C vs. T
Table 3. PON1 192Q/R (rs662) genotype and allele frequencies of PEG patients, PEX patients and controls
(n=150) (n=150) (n=150) Genotypes, n (%) QQ (n=230) 84 (56.0) 77 (51.
3
) 69 (46.0) 0.894a (0.352 - 2.266) 1.441b (0.619 - 3.355) 0.620c (0.260 - 1.480) 0.669d (0.425 - 1.055) 0.808e (0.513 - 1.271) 0.829f (0.526 - 1.305) 0.813a 0.395b 0.278c 0.083d 0.355e 0.418f QR (n=187) 57 (38.0) 59 (39. 3 ) 71 (47.3
) RR (n=33) 9 (6.0) 14 (9. 3 ) 10 (6. 6 ) Allele frequency Q 0.750 0.710 0.697 0.766g (0.535 - 1.096) 0.938h (0.661 - 1.332) 0.816i (0.569 - 1.171) 0.144 g 0.721h 0.270i R 0.250 0.290 0.303All the P values were calculated using the chi-squared test. Bonferroni corrected significance cut-off value was 0.0083 for genotypes, and 0.017 for allele frequency.
a PEG vs. Control, RR vs. QR+QQ b PEX vs. Control, RR vs. QR+QQ c PEG vs. PEX, RR vs. QR+QQ d PEG vs. Control, RR+QR vs. QQ e PEX vs. Control, RR+QR vs. QQ f PEG vs. PEX, RR+QR vs. QQ g PEG vs. Control, R vs. Q h PEX vs. Control, R vs. Q i PEG vs. PEX, R vs. Q
Table 4. PON1 55L/M (rs854560) genotype and allele frequencies of PEG patients, PEX patients and controls
(n=150) (n=150) (n=150) Genotypes, n (%) LL (n=201) 57 (38.0) 76 (50. 6 ) 68 (45.
3
) 1.000a (0.49 - 2.042) 1.565b (0.806 - 3.036) 0.639c (0.329 - 1.240) 1.353d (0.854 - 2.144) 0.807e (0.513 - 1.271) 1.676f (1.058 - 2.653) 1.000a 0.183b 0.183c 0.198d 0.355e 0.027f LM (n=191) 76 (50.6
) 49 (32.6
) 65 (43.3 )
MM (n=58) 17 (11. 3 ) 25 (16. 6 ) 17 (11. 3 ) Allele frequency L 0.633 0.670 0.670 1.175 g (0.840 - 1.645) 1.000h (0.712 - 1.405) 1.175i (0.840 - 1.645) 0.346g 1.000h 0.346i M 0.367 0.330 0.330All the P values were calculated using the chi-squared test. Bonferroni corrected significance cut-off value was 0.0083 for genotypes, and 0.017 for allele frequency.
a PEG vs. Control, MM vs. LM+LL b PEX vs. Control, MM vs. LM+LL c PEG vs. PEX, MM vs. LM+LL d PEG vs. Control, MM+LM vs. LL e PEX vs. Control, MM+LM vs. LL f PEG vs. PEX, MM+LM vs. LL g PEG vs. Control, M vs. L h PEX vs. Control, M vs. L i PEG vs. PEX, M vs. L
Table 5. Stratification of visual clinical characteristics of PEG, PEX and control groups with respect to PON1 −107T/C genotypes Clinical
characteristic −107T/C Genotype PEG PEX Control P
IOP (mmHg) TT 21.2 ± 4.9
2.0 (18.0 – 25.0) 18.0 (16.0 – 23.0)19.6 ± 4.8 18.0 (14.0 – 22.0)19.1 ± 6.3 0.051
a
0.335c 0.100d TC + CC 21.8 ± 5.0 21.0 (18.0 – 24.0) 18.0 (15.0 – 22.0)19.1 ± 5.6 19.0 (16.0 – 24.0)20.1 ± 5.8 0.001 a 0.011b 0.168c 0.000d P* 0.654 0.335 0.172 VFS TT 2.5 ± 0.8 2.0 (2.0 – 3.0) 1.0 (1.0 – 1.0)1.0 ± 0.0 1.0 (1.0 – 1.0)1.0 ± 0.0 0.000 a 0.000b 1.000c 0.000d TC + CC 2.7 ± 0.8 2.0 (2.0 – 3.0) 1.0 ± 0.0 1.0 (1.0 – 1.0) 1.0 ± 0.0 1.0 (1.0 – 1.0) 0.000a 0.000b 1.000c 0.000d P* 0.275 1.000 1.000 MD TT -6.0 ± 5.9 -3.6 (-7.5 – -2.3) -1,1 (-1.5 – -0.4)-1.0 ± 0.6 -0.8 (-1.5 – -0.6)-1.0 ± 0.6 0.000 a 0.000b 0.963c 0.000d TC + CC -7.0 ± 5.6 -4.3 (-8.0 – -3.3) -0.8 (-1.4 – -0.6)-1.0 ± 0.5 -0.7 (-1.3 – -0.3)-0.8 ± 0.6 0.000 a 0.000b 0.006c 0.000d P* 0.109 0.915 0.066 PSD TT 3.5 (2.3 – 6.2) 4.6 ± 3.0 1.3 (1.2 – 1.6) 1.4 ± 0.2 1.5 (1.2 – 1.6)1.5 ± 0.2 0.000a 0.000b 0.123c 0.000d TC + CC 3.8 (2.8 – 6.5)5.1 ± 3.1 1.5 (1.3 – 1.7)1.5 ± 0.2 1.4 (1.3 – 1.7)1.5 ± 0.2 0.000a 0.000b 0.591c 0.000d P* 0.273 0.038 0.908
a Comparison of three groups (PEG vs. PEX vs. Control) by Kruskal-Wallis test, b PEG vs. Control; c PEX vs. Control; d PEG vs. PEX by Conover’s formula.
*TC+CC vs. TT by Mann-Whitney U test and Bonferroni corrected significance cut-off value was 0.0125.
Table 6. Stratification of visual clinical characteristics of PEG, PEX and control groups with respect to PON1 192Q/R genotypes Clinical
characteristic
192Q/R Genotype
PEG PEX Control P
IOP (mmHg) QQ 21.4 ± 4.8
21.0 (18.0 – 23.8) 18.0 (16.0 – 22.5)19.5 ± 5.6 18.0 (14.0 – 20.5)18.4 ± 5.8 0.000
a
0.133c 0.008d QR+ RR 21.7 ± 5.1 20.0 (18.0 – 25.3) 18.0 (16.0 – 22.5)19.2 ± 5.0 18.0 (16.0 – 22.0)19.4 ± 5.8 0.007 a 0.006b 0.933c 0.005d P* 0.974 0.841 0.169 VFS QQ 2.7 ± 0.8 2.0 (2.0 – 3.0) 1.0 (1.0 – 1.0)1.0 ± 0.0 1.0 (1.0 – 1.0)1.0 ± 0.0 0.000 a 0.000b 1.000c 0.000d QR+ RR 2.6 ± 0.8 2.0 (2.0 – 3.0) 1.0 ± 0.0 1.0 (1.0 – 1.0) 1.0 ± 0.0 1.0 (1.0 – 1.0) 0.000a 0.000b 1.000c 0.000d P* 0.375 1.000 1.000 MD QQ -6.9 ± 5.5 -4.5 (-8.1 – -3.1) -1.1 (-1.5 – -0.6)-1.0 ± 0.5 -0.7 (-1.3 – -0.4)-0.9 ± 0.6 0.000 a 0.000b 0.051c 0.000d QR+ RR -3.7 (-7.3 – -2.4)-6.3 ± 6.0 -0.8 (-1.6 – -0.4)-1.0 ± 0.6 -0.8 (-1.4 – -0,4)-0.9 ± 0.6 0.000a 0.000b 0.393c 0.000d P* 0.148 0.644 0.547 PSD QQ 3.7 (2.8 – 6.2)4.8 ± 3.0 1.5 (1.3 – 1.7)1.5 ± 0.2 1.5 (1.3 – 1.7)1.5 ± 0.2 0.000a 0.000b 0.768c 0.000d QR+ RR 4.2 (2.5 – 6.5)5.0 ± 3.2 1.4 (1.2 – 1.6)1.4 ± 0.2 1.5 (1.3 – 1.6)1.6 ± 0.2 0.000a 0.000b 0.126c 0.000d P* 0.678 0.193 0.739
a Comparison of three groups (PEG vs. PEX vs. Control) by Kruskal-Wallis test, b PEG vs. Control; c PEX vs. Control; d PEG vs. PEX by Conover’s formula.
*QR+RR vs. QQ by Mann-Whitney U test and Bonferroni corrected significance cut-off value was 0.0125.
Table 7. Stratification of visual clinical characteristics of PEG. PEX and control groups with respect to PON1 55L/M genotypes Clinical
characteristic 55L/M Genotype PEG PEX Control P
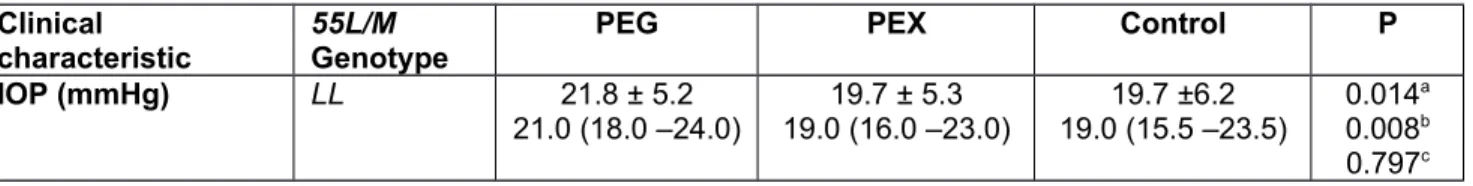
IOP (mmHg) LL 21.8 ± 5.2 21.0 (18.0 –24.0) 19.7 ± 5.3 19.0 (16.0 –23.0) 19.7 ±6.2 19.0 (15.5 –23.5) 0.014a 0.008b 0.797c
0.012d LM + MM 21.0 (18.0 –24.0)21.4 ± 4.7 18.0 (14.5 –22.0)18.6 ± 5.3 17.0 (14.0 –20.0)17.7 ± 4.9 0.000a 0.000b 0.330c 0.000d P* 0.871 0.151 0.041 VFS LL 2.0 (2.0 – 3.0)2.6 ± 0.8 1.0 (1.0 –1.0)1.0 ± 0.0 1.0 (1.0 –1.0)1.0 ± 0.0 0.000a 0.000b 1.000c 0.000d LM + MM 3.0 (2.0 – 3.0)2.7 ± 0.8 1.0 (1.0 –1.0)1.0 ± 0.0 1.0 (1.0 –1.0)1.0 ± 0.0 0.000a 0.000b 1.000c 0.000d P* 0.267 1.000 1.000 MD LL -3.9 (-7.5 – -2.4)-6.3 ± 5.4 -0.9 (-1.5 – -0.6)-1.0 ± 0.6 -0.8 (-1.4 – -0.4)-0.9 ± 0.6 0.000a 0.000b 0.278c 0.000d LM + MM -6.3 (-7.8 – -2.9)-7.0 ± 6.0 -1.1 (-1.4 – -0.4)-1.0 ± 0.6 -0.7 (-1.3 – -0.4)-0.8 ± 0.5 0.000a 0.000b 0.110c 0.000d P* 0.186 0.838 0.408 PSD LL 3.7 (2.8 – 6.2)4.8 ± 3.1 1.4 (1.3 – 1.6)1.5 ± 0.2 1.5 (1.3 – 1.7)1.5 ± 0.2 0.000a 0.000b 0.172c 0.000d LM + MM 4.4 (2.7 –6.4)5.0 ± 3.0 1.4 (1.2 – 1.6)1.4 ± 0.2 1.4 (1.2 –1.7)1.4 ± 0.3 0.000a 0.000b 0.586c 0.000d P* 0.561 0.191 0.079
Data given as mean ± SD in the first row and as median and quartiles (first quartile-third quartile) in the second row.
*LM+MM vs. MM by Mann-Whitney U test and Bonferroni corrected significance cut-off value was 0.0125.
Table 8. Distribution of PON1 -107T/C, 192Q/R and 55L/M minor allele frequencies in different visual field severity stages (VFS)
VFS Minor allele frequency
PON1 -107C PON1 192R PON1 55M
1 0.417 0.297 0.330
3 0.522 0.200 0.402
4 0.500 0.278 0.306
5 0.500 0.250 0.625
The highest and lowest frequencies were compared using the chi-squared test. None of the frequencies differed significantly across the VFS groups