Exports and Investment Indicators Accelerate in the Last Quarter of 2010
Z¨umr¨ut ˙Imamo˘glu† ve Barı¸s Soybilgen‡
Executive Summary
December data on the Industrial Production Index (IPI) and foreign trade are released by TurkStat a few weeks ago. According to the figures, IPI and exports increased considerably in December from a month ago, by 5.7 and 9.6 percent, respectively. This increase contributed to the overall growth in the fourth quarter which had gained pace since Octo-ber. After the release of the December data Betam revised its estimate of quarter to quarter real GDP growth to 2.6 percent in 2010 - 4th Quarter from its previous estimate of 2.2 percent. Betam also revised its yearly growth rate in 2010 upwards to 8.9 percent from the preceding 8.7 percent.
Balance of payments data released by the Cen-tral Bank of Turkey show a current account deficit of $7.5 billion in December. The current account deficit in total in 2010 stands at $48.6 billion. Using Betam’s GDP estimates, this amounts to a current account deficit of 6.5% of the GDP in 2010, a con-siderably high figure. The Central Bank of Turkey’s aim with its new policy mix was to reduce capital in-flows and the current account deficit, however, we do not see any such sign in the data, yet. Foreign trade
†
Dr. Z¨umr¨ut ˙Imamo˘glu, Betam, Research Associate. [email protected]
‡
Barı¸s Soybilgen, Betam, Research Assistant. [email protected]
deficit in January was $7.3 billion and in February estimates point to similar figures which undermines Central Bank’s hopes of reducing the current ac-count but we might have to wait a little longer to see the effects of the new policy.
To this date, data for only a limited number of Be-tam’s indicators are released for the month of Jan-uary, but it looks like the first quarter will not be as promising as the last quarter in terms of economic growth. Both the real sector and consumer confi-dence look weak and some indicators are down from their December levels. We are not sure yet whether this is a consequence of the Central Bank’s new pol-icy mix or the confusion it created in the markets.
Table 1: Betam’s quarterly and annual growth fore-casts
Real GDP Current Account Growth Deficit (%) (% of GDP) 2010 Q4 (quarter-on-quarter) 2.6 -2010 Q4 (year-on-year) 7.7 -2010 (annual) 8.9 6.5
Source: Betam. Seasonally and calendar day adjusted figures.
Investment indicators increase in Decem-ber, consumption is strong
Table 1 lists the monthly indicators Betam fol-lows and their monthly and quarterly percentage changes.1 A high increase in almost all indicators
are observed in the fourth quarter, however, the in-crease in the investment indicators are remarkable.
Production of investment goods increased by 15.6 percent in the fourth quarter from the previous quar-ter and investment good imports increased by 28.6 percent. These numbers are considerably high when compared to the increases in the previous quarter and suggest an acceleration in the growth rate of in-vestment. Our view is fortified by the increase in the Real Sector Confidence Index, 9.2 percent from the previous quarter.
Consumption indicators are all up as well. The Special Consumption Tax increased by 5.7 percent in the fourth quarter. Some of the increase is due to increases in imports. Imports of consumer goods increased by 13.7 percent in the fourth quarter. Pro-duction of durable and non-durable consumption goods also increased, 1.1 and 1.9 percent, respec-tively. Consumer confidence index was up 10.4 per-cent in the fourth quarter. These figures suggest that consumption demand is strong in Turkey although the unemployment rate is still above its pre-crisis level.
Demand for Turkey’s exports is increasing as the world economy is recovering from the crisis, however, high economic growth fuels the surge in import de-mand. In the fourth quarter, exports increased by 5.1 percent while imports increased twice as faster, by 10.2 percent. Hence, we expect net exports to contribute negatively to real GDP growth in the fourth quarter.
1All indicators are real (or inflation adjusted) and
season-ally adjusted.
Betam’s forecasts for 2010-Q4 revised Betam releases its forecasts on a monthly basis and revises its forecasts every month after updating its monthly indicators. Table 1 summarizes Betam’s forecasts for the year end and quarterly growth rate of real GDP. We expect the real GDP to grow by 2.6 percent in the fourth quarter from the previous quarter.
Our forecast of real GDP growth rate from the same quarter of the previous year is 7.7 percent and finally we estimate the yearly growth rate in 2010 to be 8.9 percent.
IPI is at its historically highest level, CUR is still below the pre-crisis rates
Figure 1 shows monthly changes of real and sea-sonally adjusted Capacity Utilization Rate (CUR) and Industrial Production Index (IPI) since January 2007. As shown in the figure, IPI reached a new his-torical level ,that is 128 point, in December. On the other hand, CUR is not back to its pre-crisis level yet. CUR’s 2007 average was 80.2 percent. In January 2011, CUR reached 77.1 percent according to Turkish Central Bank’s seasonally adjusted num-bers. We think that the high increase in investment expanded capacity at a fast rate and hence the rise of CUR is limited despite the surge in production. According to these numbers, we expect that the in-dustry will stay below pre-crisis capacity utilization level for a few quarters more.
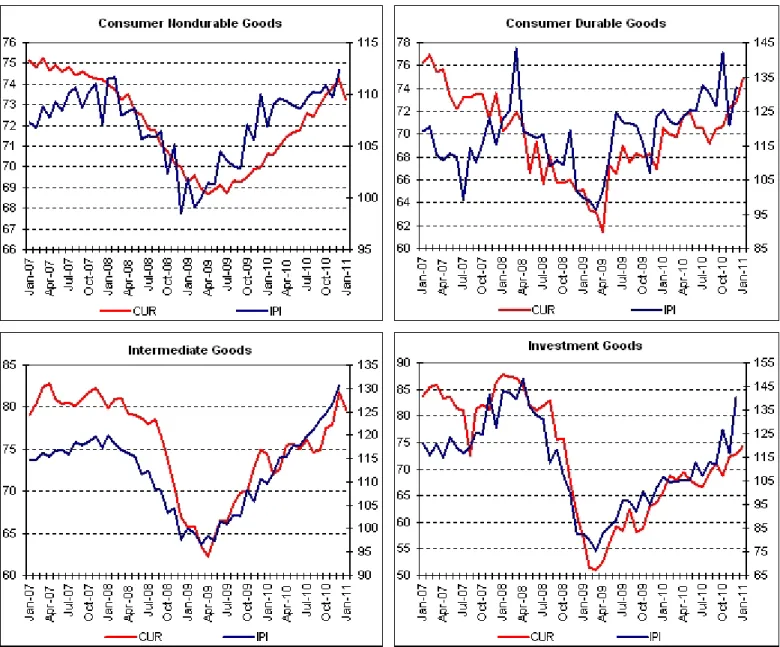
Figure 4 shows the monthly changes of real and seasonally adjusted IPI’s and CUR’s components. Figures clearly show that intermediate and invest-ment goods manufacturing was the engine of the Turkish economy in 2010. Since December 2009 termediate and investment goods manufacturing in-creased by 18 percent and 37.7 percent, respectively. Investment goods manufacturing showed a real surge in December. As shown in table 2, invest-ment goods manufacturing increased by 20.2 percent
in December and it is followed by durable consumer goods manufacturing which increased by 9.2 percent. The surge in exports in December became the driving force behind industrial produc-tion
Figure 2 shows monthly changes of seasonally ad-justed import and export volume indices. Between December 2009 and December 2010, exports in-creased by 1.2 percent per month on average. On the other hand, the monthly average growth of im-ports was 2.4 percent. In December exim-ports enjoyed the largest increase of the year, a 9.6 percent in-crease from the previous month. This surge became the driving force behind the increase in industrial production. On the other hand imports showed a smaller increase of 4 percent in December.
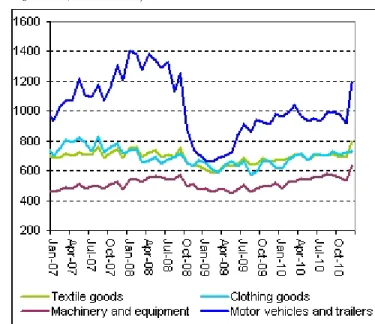
Figure 3 shows the monthly changes in exports for major manufacturing industries in Turkey. In De-cember, all the major manufacturing sectors showed a great increase. Especially exports of automobile industry had the highest growth, increasing by 27 percent. Furthermore, textile goods, machine and equipment sectors both increased over 10 percent.
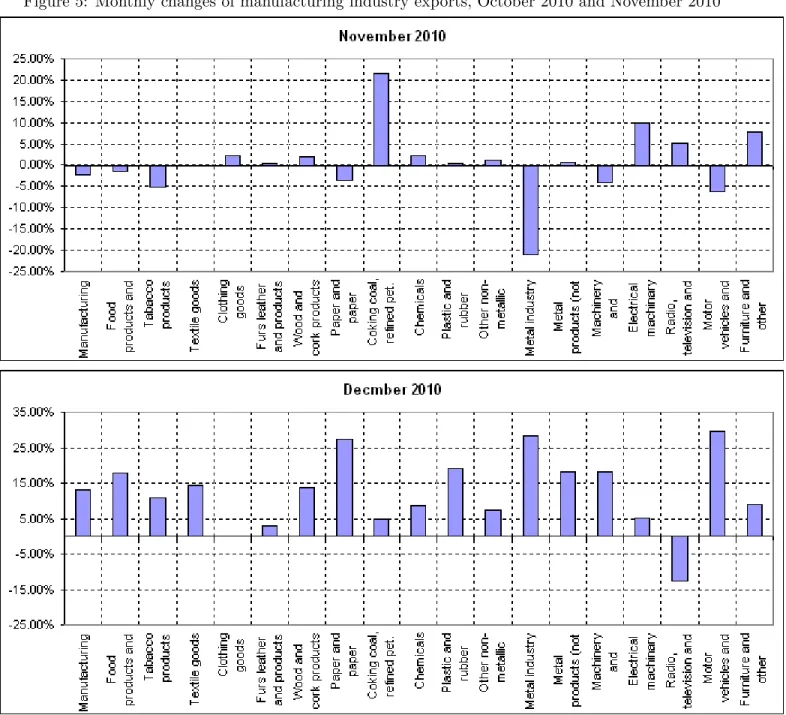
Figure 5 shows the export performance of all man-ufacturing firms in November and December. After the fall in November, it is surprising to see a large increase in December. Furthermore, the increase in December is ubiquitous among all manufactur-ing sectors and provides an optimistic outlook for coming months.
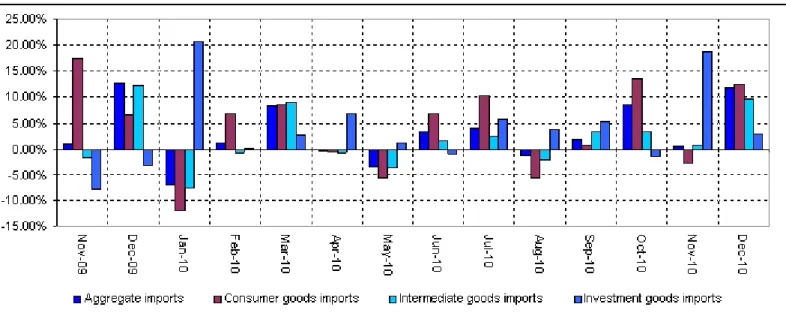
Figure 6 shows the monthly changes of real and seasonally adjusted imports of basic economic cat-egories. About 70% of Turkey’s imports are inter-mediate goods which includes oil and natural gas, though lately the surge in imports is caused by im-ports of investments goods. In December, imim-ports of investment goods increased by 10.7 percent. It is followed by the increase in consumer good imports which was 9.8 percent. Between December 2009 and December 2010, imports of investment goods,
con-sumer goods and intermediate goods increased by 7, 2.9 and 1.5 percent per month on average respec-tively.
First signals of 2011
Table 2 shows the monthly indicators for January 2011. Although some of the data is still to be an-nounced, we can see early signs of a slowing down in economic activity in the first quarter of 2011.
The consumer confidence index is flat for January. The Special Consumption Tax and automobile pro-duction have both decreased. Automobile produc-tion is quite volatile in Turkey since a large fracproduc-tion of it is exported, however, it still is a good predictor of consumption demand. The Special Consumption Tax is more stable and a good measure of demand for gasoline and luxury items. The fall in both indi-cators might be a signal of weakening consumption demand.
The real sector confidence index is down in Jan-uary, first time since August, by -1.1 percent and IMKB 100 is steady after a decrease in December. This is probably due to the confusion Central Banks’ new policy mix created in the markets as uncertainty always undermines confidence.
We believe that as the market’s view of the new policy mix becomes more clear, there is no need for the Turkish economy to slow down. However, the uprisings in the Middle East and North Africa might impact exports and the industrial production for a short time.
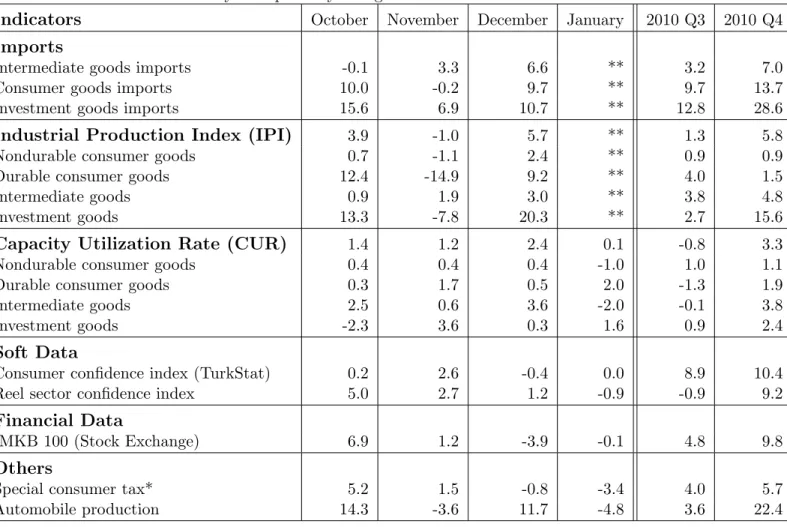
Table 2: Monthly and quarterly changes of Betam’s selected indicators
Indicators October November December January 2010 Q3 2010 Q4 Imports
Intermediate goods imports -0.1 3.3 6.6 ** 3.2 7.0
Consumer goods imports 10.0 -0.2 9.7 ** 9.7 13.7
Investment goods imports 15.6 6.9 10.7 ** 12.8 28.6
Industrial Production Index (IPI) 3.9 -1.0 5.7 ** 1.3 5.8
Nondurable consumer goods 0.7 -1.1 2.4 ** 0.9 0.9
Durable consumer goods 12.4 -14.9 9.2 ** 4.0 1.5
Intermediate goods 0.9 1.9 3.0 ** 3.8 4.8
Investment goods 13.3 -7.8 20.3 ** 2.7 15.6
Capacity Utilization Rate (CUR) 1.4 1.2 2.4 0.1 -0.8 3.3
Nondurable consumer goods 0.4 0.4 0.4 -1.0 1.0 1.1
Durable consumer goods 0.3 1.7 0.5 2.0 -1.3 1.9
Intermediate goods 2.5 0.6 3.6 -2.0 -0.1 3.8
Investment goods -2.3 3.6 0.3 1.6 0.9 2.4
Soft Data
Consumer confidence index (TurkStat) 0.2 2.6 -0.4 0.0 8.9 10.4
Reel sector confidence index 5.0 2.7 1.2 -0.9 -0.9 9.2
Financial Data
IMKB 100 (Stock Exchange) 6.9 1.2 -3.9 -0.1 4.8 9.8
Others
Special consumer tax* 5.2 1.5 -0.8 -3.4 4.0 5.7
Automobile production 14.3 -3.6 11.7 -4.8 3.6 22.4
Source: TurkStat, TCMB, Treasury, IMKB, Betam. All series are real (or inflation adjusted) wherever necessary and seasonally adjusted.
*This tax is collected on sales of selected goods such as gas, fuel oils, alcohol, tobacco products and automobiles. **Data not yet released.
Figure 1: CUR ve IPI (real, calendar day corrected and seasonally adjusted, left axis for CUR and right axis for IPI)
Source: TurkStat, Betam.
Figure 2: Volume indices of exports and imports (real, calendar day corrected and seasonally ad-justed)
Source: TurkStat, Betam.
Figure 3: Monthly changes of important industries’ exports (real, calendar day corrected and seasonally adjusted, million $)
Source: TurkStat, Betam. Each component of exports are transformed into real series by using TUIK’s price index of the corresponding component and then it is seasonally adjusted.
Figure 4: Monthly changes of CUR’s and IPI’s components
Figure 5: Monthly changes of manufacturing industry exports, October 2010 and November 2010
Figure 6: Monthly changes of imports’ components