TURKEY’S SLUGGISH SLOWDOWN
Zümrüt İmamoğlu* ve Barış Soybilgen
†Executive Summary
Following this month’s data releases, all economic indicators for the fourth quarter are available. The Industrial Production Index (IPI) in the fourth quarter increased by 2.5 percent, import volume index decreased by 1.9 percent and export volume index stayed same from the previous quarter. The increase in the IPI despite no change in the export volume index indicates a revival in domestic demand in the fourth quarter. Therefore, Betam expects an increase in both consumption and investment expenditure. Because of the decline in imports, net exports will contribute positively to GDP growth. According to new data, we update our growth forecast upward. Betam’s quarter on quarter growth forecast for third quarter is now 1.5 percent up from 1.2. Our corresponding year on year growth forecast is 6.2 percent, while we estimate the annual growth rate at 8.4 percent.
Growth rates of both the trade deficit and current account deficit slowed down in the third quarter compared to the previous quarters. Moreover in the fourth quarter, current account deficit began to
* Dr. Zümrüt İmamoğlu, Betam, Research Associate. [email protected]
† Barış Soybilgen, Betam, Research Assistant,
decrease in nominal terms as well. At the end of the third quarter, the 12-month current account deficit was $77.5 billion, but at the end of the fourth quarter it stands at $77.1 billion. This is the first time since the last quarter of 2009 that the 12-month current account deficit has decreased. Betam’s current account forecast for the year end (2011) is 9.9 percent.
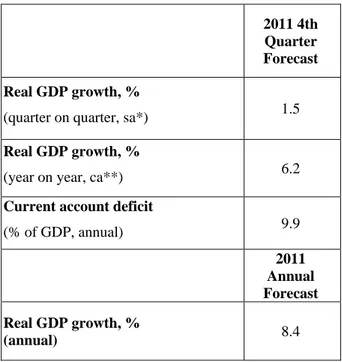
Table 1. Betam’s quarterly and annual growth rate forecasts
Source: Betam
*sa: seasonally and calendar day adjusted **ca: calendar day adjusted
2011 4th Quarter Forecast Real GDP growth, %
(quarter on quarter, sa*) 1.5
Real GDP growth, %
(year on year, ca**) 6.2
Current account deficit
(% of GDP, annual) 9.9 2011 Annual Forecast Real GDP growth, % (annual) 8.4
Economic Outlook and Forecasts:
February 2012
Is domestic demand picking up?
In the third quarter, investment demand slumped and we believe that investment may have also decreased in the fourth quarter. However, in December, investment goods imports increased by 12.5 percent and investment goods manufacturing increased by 8.4 percent. Therefore, we now forecast that investment expenditure made a small positive contribution to QoQ GDP growth and update our QoQ GDP growth from 1.2 to 1.5 percent.
On the other hand, fourth quarter economic indicators continue exhibiting signals for a slowdown in 2012. While imports are declining, IMKB 100 continued to fall as it did in the third quarter. Consumer confidence index deteriorated and real sector confidence index decreased both in December and January.
Altough all indicators show signs of slowdown, it’s not coming fast. In the beginning of 2012, FED’s announcement of low interest rates triggered money flow to emerging countries. Turkish Lira appreciated by 8 percent since then. An increase in capital inflows might delay the decrease in investment demand and support credit expansion which in turn might cause consumption demand to pick up in the short-term.
Domestic demand is strong in the fourth quarter
In the fourth quarter of 2011 compared to the previous quarter, consumer confidence index and consumer goods imports decreased by 0.7 and 1.7
percent respectively. On the other hand, nondurable goods manufacturing and durable goods manufacturing increased by 2 and 0.9 percent, respectively, in the fourth quarter. Despite the decline in imports, Special Consumption Tax (SCT) income increased by 2.3 percent because government increaed SCT rates in many consumer goods. Overall, we believe that consumption expenditures made a positive contribution to the QoQ GDP growth in the fourth quarter.
IPI accelerated in the 4th quarter
In the fourth quarter, all economic indicators except investment goods imports are positive. In the fourth quarter compared to the previous quarter, IPI and Capacitiy Utilization Rate increased by 3.6 and 1.6 percent respectively. Real sector confidence index also increased by 0.4 percent in the fourth quarter. However, investment goods imports decreased by 2.7 percent. In the third quarter investment expenditure had decereased by 10 percent. However, our expectation for investment expenditure in the fourth quarter is that it might increase slightly.
Exports continue to increase while imports decrease
Figure 2 shows monthly changes of seasonally adjusted import and export volume indices. In the fourth quarter, compared to the previous quarter, export volume index increased by 0.3 percent and import volume index decreased by 1.9 percent. In the fourth quarter, increase in SCT, appreciation of the Turkish Lira and the slowdown in Turkish economy caused imports to decline. We believe
that net exports positively contributed to GDP growth in the fourth quarter. In 2012, the biggest risk for Turkish export sector is an economic slowdown in the Eurpean Union because Turkey earns nearly half of its export revenue from its sales to the EU.
Current account deficit is almost 10 percent
In December, current account deficit was $6.5 billion. Like in November, current account deficit was nearly 1 billion lower than the previous year of the same month. Current account deficit fell from $77.5 billion to $77.1 billion in the fourth quarter compared to the third quarter.
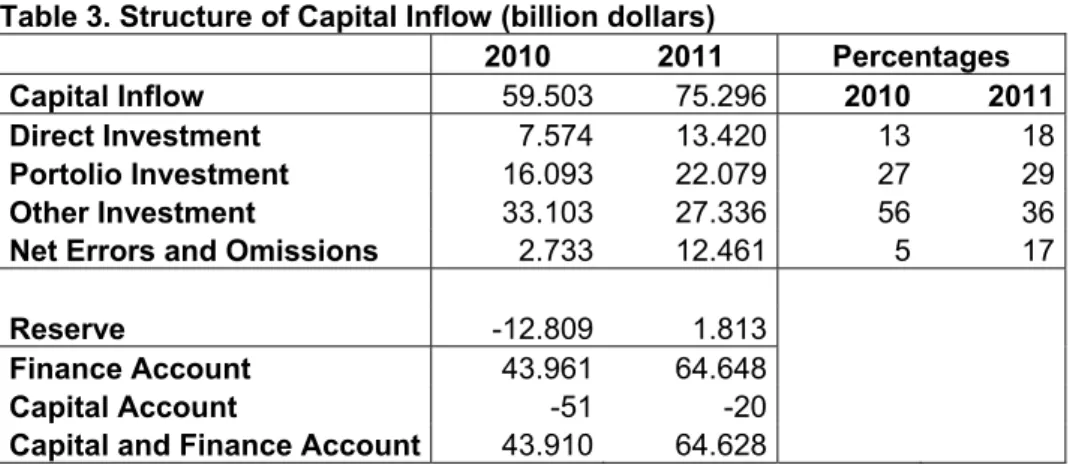
There were important changes in the composition of how the current account was financed in 2011 compared to 2010. Table 3 summarizes the composition of capital inflows to Turkey in 2011 and 2010. In 2010, 13 percent of capital inflows was in the form of foreign direct investment. In 2011 this figure increased to 18 percent. Share of
portfolio investment, which consists mostly of equity and debt bills, increased only by 2 percentage points while share of other investment, which mainly consists of credit and deposit accounts, fell by 20 percentage points from 56 to 36 percent. The fall in the share of other investment is mainly caused by the decline in foreign banks’ TL accounts in domestic banks. What’s abnormal is that the net errors and omissions in 2011 amounted to 17 percent of total capital inflows, an unprecedented high figure which makes it hard to evaluate the quality of the capital inflows to the economy.
In the third quarter annual current account deficit was 9.8 percent of GDP. Betam’s current account forecast for the end of year in 2011 is 9.9 percent of GDP.
Table 2. Monthly and quarterly changes of Betam’s selected indicators (real and sa)
Indicators October November December January
2011 4. Quarter 2011 1. Quarter Exports 5.5 1.8 3.3 ** 0.3 ** Imports -3.8 -2.1 0.4 ** -1.9 **
Intermediate goods import -4.8 1.2 -3.3 ** -1.1 **
Consumer goods import -0.8 -5.7 1.1 ** -1.7 **
Investment goods import -8.6 -2.7 12.5 ** -2.7 **
Industrial Production Index (IPI) 3.7 -2.2 2.7 ** 3.6 **
Nondurable consumer goods 3.5 -3.4 1.1 ** 2.0 **
Durable consumer goods 2.4 -1.7 -3.2 ** 0.9 **
Intermediate goods -0.2 1.3 0.9 ** 1.3 **
Investment goods 5.1 2.5 8.4 ** 8.2 **
Capacity Utilization Rate (CUR) 0.3 0.4 1.0 0.3 1.5 1.1
Nondurable consumer goods -0.2 0.4 0.3 0.8 0.0 1.1
Durable consumer goods 0.3 0.7 -0.2 -0.6 1.1 -0.5
Intermediate goods 2.3 -0.1 0.7 -0.5 2.8 -0.1
Investment goods -3.0 1.7 1.2 -0.8 -0.1 0.5
Soft Data
Consumer confidence index
(Turkstat) -1.9 1.5 1.0 ** -0.7 **
Reel sector confidence index -2.6 2.7 -3.2 -2.3 0.4 -3.6
Financial Data
IMKB 100 (Stock Exchange) -2.9 -5.8 -3.6 -1.2 -10.3 -5.5
Other
Special consumer tax* (SCT) 7.3 -3.1 -3.1 ** 2.3 **
Automobile production 5.1 -0.0 -6.7 -0.3 3.8 -4.8
Source: TurkStat. TCMB. Treasury. IMKB. Betam. All series are real (or inflation adjusted) wherever necessary and seasonally adjusted.
*This tax is collected on sales of goods such as gas. fuel oils. alcohol. tobacco products and automobiles. **Data not yet released
Table 3. Structure of Capital Inflow (billion dollars)
2010 2011 Percentages
Capital Inflow 59.503 75.296 2010 2011
Direct Investment 7.574 13.420 13 18
Portolio Investment 16.093 22.079 27 29
Other Investment 33.103 27.336 56 36
Net Errors and Omissions 2.733 12.461 5 17
Reserve -12.809 1.813
Finance Account 43.961 64.648
Capital Account -51 -20
Capital and Finance Account 43.910 64.628
Figure 1: Capacity utilization rate and industrial production index (sa. left axis for CUR and right axis for IPI)
60 65 70 75 80 85 Ja n-07 Ap r-07 Ju l-0 7 Oc t-07 Ja n-08 Ap r-08 Ju l-0 8 Oc t-08 Ja n-09 Ap r-09 Ju l-0 9 Oc t-09 Ja n-10 Ap r-10 Ju l-1 0 Oc t-10 Ja n-11 Ap r-11 Ju l-1 1 Oc t-11 Ja n-12 95 100 105 110 115 120 125 130 135 CUR IPI
Source : TurkStat. Betam
Figure 2: Volume indices of exports and imports (sa) 120.00 130.00 140.00 150.00 160.00 170.00 180.00 190.00 200.00 210.00 Ja n-07 Ma y-07 S ep-07 Ja n-08 Ma y-08 S ep-08 Ja n-09 Ma y-09 S ep-09 Ja n-10 Ma y-10 S ep-10 Ja n-11 Ma y-11 S ep-11 Export Import
Source : TurkStat. Betam
Figure 3: Ratio of current account deficit to Figure 4: Ratio of current account deficit to
GDP (yearly) GDP’ growth rate (QoQ, percentage point)
Source: TCMB. TurkStat. Betam * Betam’s forecasts -1.5 -1 -0.5 0 0.5 1 1.5 2 2008 (1) 2008 (2) 2008 (3) 2008 (4) 2009 (1) 2009 (2) 2009 (3) 2009 (4) 2010 (1) 2010 (2) 2010 (3) 2010 (4) 2011 (1) 2011 (2) 2011 (3) 2011 (4) 0 2 4 6 8 10 12 2008 (1 ) 2008 (2 ) 2008 (3 ) 2008 (4 ) 2009 (1 ) 2009 (2 ) 2009 (3 ) 2009 (4 ) 2010 (1 ) 2010 (2 ) 2010 (3 ) 2010 (4 ) 2011 (1 ) 2011 (2 ) 2011 (3 ) 2011 (4 )
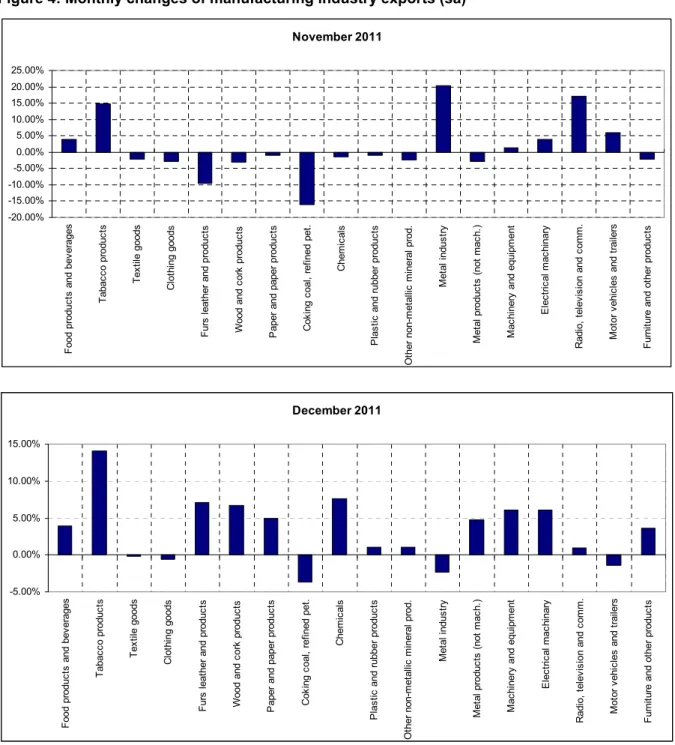
Figure 4: Monthly changes of manufacturing industry exports (sa)
Source: TurkStat. Betam
December 2011 -5.00% 0.00% 5.00% 10.00% 15.00% F ood pr oduc ts and bev erages T abac co produc ts T ex til e goods C lot hi ng goods F urs leat her and pr oduc ts Wood and co rk produc ts P aper and paper pr oduc ts C ok ing c oal , ref ine d pet . C hem ic al s P las tic and r ubber pro duc ts O ther non-m et allic m in er al p ro d. M et al indus tr y M et al produc ts (not m ac h. ) M ac hi nery and e qui pm ent E lec tr ic al m ac hi nary R adi o, t el ev is ion and c om m . M ot or v ehi cl es and t rai le rs F urni tur e and ot her pr oduc ts November 2011 -20.00% -15.00% -10.00% -5.00% 0.00% 5.00% 10.00% 15.00% 20.00% 25.00% F ood produc ts and bev erages T abac co produc ts T ex til e goods C lot hi ng goods F urs leat her and produc ts Wood and c or k produc ts P aper and paper produc ts C ok ing c oal , r ef ined pet . C hem ic al s P las tic
and rubber produc
ts O ther non-m et al lic m iner al prod. M et al indus tr y M et al pr oduc ts ( not m ac h. ) M ac hi nery an d equi pm ent E lec tr ic al m ac hi nary R adi o, t el ev is ion and c om m . M ot or v ehi cl es and t rai le rs F ur ni ture and ot her produc ts