www.betam.bahcesehir.edu.tr
1
Annual Growth: Last Time in Two Digit Numbers
Seyfettin Gürsel•, Arda Aktaş‡ ve Barış Soybilgen†
Executive Summary Growth slows down
According to data released by Turkstat, Turkey’s real GDP increased at an annual rate of 11 percent in the first quarter of 2011 from the same quarter of the previous year. In the last quarter of 2010, the year on year (yoy) growth was 9.2 percent. Therefore, 11 percent yoy growth in the 1st quarter gives an impression of acceleration. However, this high yoy growth is caused by the unprecedented growth in the last quarter of 2010. The quarterly growth rate in the last quarter of 2010 was 3.6 percent which was very high. This unusual high growth increased the GDP level considerably and created a base affect.
To analyze the growth rate of GDP, it’s better to look at the quarterly growth rates instead of annual growth rates. Turkstat announced that seasonally adjusted GDP increased by 1.4 percent in the 1st quarter of 2011 from the 4th quarter of 2010. Also in Betam’s Economic Outlook and Forecast research briefs, we perform regular forecasts on growth rates of real GDP and the current account deficit. We believe that the quarterly GDP growth decreased significantly in the 2nd quarter of 2011. The base affect will disappear in the 4th quarter of 2011 and annual growth rate may reduce to 4 percent.
•Prof. Dr. Seyfettin Gürsel, Betam, Director
† Barış Soybilgen, Betam, Research Associate
‡ Arda Aktaş , Betam, Research Assistant
Figure 1: GDP components: Change from the previous quarter
Seasonally Adjusted Indicators
Imports Exports Government spendings Investment Consumption -4% -2% 0% 2% 4% 6%
Source: Turkstat, Betam. Quarterly indicators are seasonally adjusted and calendar day corrected
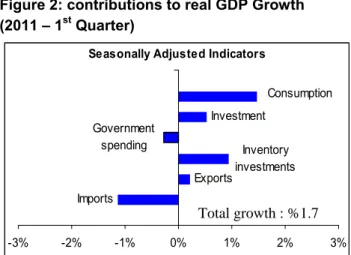
Figure 2: contributions to real GDP Growth (2011 – 1st Quarter)
Source: Turkstat, Betam. Quarterly indicators are seasonally adjusted and calendar day corrected
Growth is fuelled by private consumption
To analyze the contributions of GDP components to growth, Betam seasonally adjusts and calendar day corrects each component of GDP separately. Figure 1 and Figure 2 show the change in GDP components and their contributions to growth in the 1st quarter of 2011, respectively.
Seasonally Adjusted Indicators
Imports Exports Investment Inventory investments Government spending Consumption -3% -2% -1% 0% 1% 2% 3% Total growth : %1.7
Growth Review:
2011, 1
st
Quarter
30.06.2011 Research Note 11/119www.betam.bahcesehir.edu.tr
2
The greatest contribution to growth came from theincrease in consumption. Consumption increased by 2.1 percent quarterly and it contributed 1.5 percent points to quarterly real GDP growth.
Investment decelerated
In the fourth quarter of 2010, the increase in private investment demand was unexpectedly high, an increase of 19.3% quarter on quarter (qoq). However from the 4th quarter of 2010 to 1st quarter of 2011, investments decelerated significantly. Investments increased by 2.5 percent in the first quarter and contributed only 0.5 percentage points to real GDP growth.
Private inventory investment made 0.9 percentage point contribution which was the second highest contribution to real GDP growth after consumption.
Government expenditure decreased
In the 1st quarter of 2011, government expenditure decreased by 1.9 percent quarterly and subtracted 0.3 percentage points from the quarterly real GDP growth. This negative contribution shows that government took some austerity measures to cool down the economy. In the coming quarters, we expect the government expenditures to swing around this level.
Net exports contribution is negative
In the first quarter, exports increased by 0.9 percent and only added 0.2 percentage points to real GDP. This limited increase in Turkey’s exports is mainly caused by disturbances in Middle East. Uncertainty in Middle East also continued in the second quarter. Therefore, we expect only a small increase in Turkish exports in the second quarter.
On the other hand, imports surged because of high growth rate of Turkey. In the first quarter, imports increased by 3.9 percent and subtracted 1.1 percentage points from quarterly change in real GDP.
Overall, sum of GDP components equal to 1.7 percentage increase in the 1st quarter of 2011 from the 4th quarter of 2010. Our result is very similar to Turkstat’s seasonally adjusted 1.4 percentage quarterly growth.
Forecasts for the rest of the year
Betam forecasted 1.6 percentage qoq growth and 10.6 percentage yoy growth for the first quarter in Economic Outlook and Forecast Briefs (March, April, May and June 2011). Turkstat announced qoq growth as 1.4 percent and yoy growth as 11 percent for the first quarter. Betam’s annual current account deficit forecast was 7.9 percent of GDP for the 1st quarter and according to Turkstat releases, it is officially 7.9 percent.
Betam expects that economy continued to decelerate in the second quarter of 2011. According to leading indicators, Betam’s qoq forecast is 0.3 percent for the 2nd quarter (see Economic Outlook and Forecasts: July 2011). According to this forecast, yoy growth decreased to 6.6 percent in the second quarter. If quarterly GDP growth continues to be low in the third and fourth quarters, yoy growth may reduce to 4 percent in the last quarter.
We expect the current account deficit to go up to 9 percent of GDP at the end of second quarter. If the exchange rate and energy prices don’t change much, then given the slowdown in the economy and a tight fiscal policy, we can expect current account deficit to decrease in the coming quarters.
Figure 3 : Quarter-on-quarter real GDP growth
-8% -6% -4% -2% 0% 2% 4% 6% 2007( 4) 2008( 1) 2008( 2) 2008( 3) 2008( 4) 2009( 1) 2009( 2) 2009( 3) 2009( 4) 2010( 1) 2010( 2) 2010( 3) 2010( 4) 2011( 1) 2011( 2) Betam's f orecast Realized
www.betam.bahcesehir.edu.tr
3
Box 1: Calculation of quarterly GDP growth and contributions.
Sub-components of GDP are grouped into 3 cate-gories:
1. Final domestic demand consist of final consump-tion expenditure of resident households (Con-sumption), sum of government final consumption and investment expenditure (Government ex-penditure), investment expenditure of private sector (Investment)
2. Net foreign demand for goods and services rep-resents the difference between exports and imports of goods and services.
3. Change in inventories (stocks) shows how stocks changes with compared to previous quarter (for details look Box 2)
In order to find quarterly GDP growth, the following formulation is used for all sub components of GDP separately:
Since X represents 'Change in GDP component' Contribution of X to growth can be calculated as follows:
= (Xt– Xt-1) / GDPt-1
Differences between the methodologies used by Betam and TurkStat in seasonally adjusting the real GDP
TurkStat seasonally adjusts and calendar day corrects total GDP series but not its components separately. However, each component of GDP may show different seasonal characteristics. Therefore, Betam eliminates the effects of seasonality and calendar day from the components separately and constructs the adjusted GDP series as the sum of the adjusted components. These two methodologies yield quantitatively different results and both of them are used frequently in the related literature.
Box 2: Change in inventories (stocks) and its contribution to growth
'Stock change' shows that how stocks change compared to previous period
Stock change t = Stock t – Stock t-1
Therefore increase (decrease) in inventories is caused by increase (decrease) in the difference between two period rather than increase (decrease) in stocks. However, TurkStat estimates the change in stocks is as residual between production and expenditure accounts. Moreover this sub-component also includes statistical discrepancy.
Let's say the difference between production and expenditure account εt-1, 'stock change' in time t is as
follows:
Stock changet = Stock t – Stock t-1 + εt-1
Finally, contribution of change in 'Stock change' can be found as follows:
Contribution of 'Stock change t = (Stock t – Stock t-1) / GDP t-1
or
Contribution of 'Stock change t = ((Stock t – Stock t-1 + εt )