Tar. Bil. Der.
Dergi web sayfası: www.agri.ankara.edu.tr/dergi
Journal homepage: www.agri.ankara.edu.tr/journal
Modeling of Water Absorption of Ultrasound Applied
Chickpeas (Cicer arietinum L.) Using Peleg’s Equation
Ali YILDIRIMa, Mehmet Durdu ÖNERb, Mustafa BAYRAMb
a
Gaziantep University, Vocational School of Higher Education in Nizip, Department of Food Technology, 27700 Gaziantep, TURKEY b
Gaziantep University, Faculty of Engineering, Department of Food Engineering, 27310 Gaziantep, TURKEY
ARTICLE INFO
Research Article Agricultural Food
Corresponding author: Mehmet Durdu ÖNER, e-mail: [email protected], Tel: +90(342) 317 23 05 Received: 19 July 2010, Received in revised form: 14 January 2011, Accepted: 08 February 2011
ABSTRACT
In this study, water absorption of chickpea was modeled with Peleg’s equation during soaking process at different temperatures (20, 30, 40, 50, 60, 70, 87, 92 and 97) °C with ultrasound (25 100 W, 40 100 W and 25 kHz-300 W) and without ultrasound. K1 (Peleg rate constant) and K2 (capacity constant) significantly decreased from
96.28 to 5.43 s % d.b.-1 and from 7.45x10⁻³ to 5.94x10⁻³ % d.b.-1 with increase in temperature (20 to 97°C) and ultrasound treatments, 25 kHz-100 W and 25 kHz-300 W, respectively. Decrease in K1 and K2 demonstrating that the
water absorption rate and water absorption capacity increased with time and temperature. High power ultrasound affected the rate of water absorption of chickpea more than low power ultrasounds. On the other hand, the rate of water absorption of chickpea was not affected with 40 kHz-100 W ultrasound application. Gelatinization temperature of chickpea from Peleg model was found as 60°C. Peleg model was successfully fitted to correlate water absorption of chickpea with soaking time and temperature.
Keywords: Chickpea; Water absorption; Ultrasound; Peleg Model
Ultrason Uygulanmış Nohudun (Cicer arietinum L.) Su
Absorbsiyonun Peleg Eşitliği ile Modellenmesi
ESER BĐLGĐSĐ
Araştırma Makalesi Tarımsal Gıda
Sorumlu Yazar: Mehmet Durdu ÖNER, e-posta: [email protected], Tel: +90(342) 317 23 05 Geliş tarihi: 19 Temmuz 2010, Düzeltmelerin gelişi: 14 Ocak 2011, Kabul: 08 Şubat 2011
ÖZET
Bu çalışmada, ultrasonlu (25 kHz-100 W, 40 kHz-100 W ve 25 kHz-300 W) ve ultrasonsuz farklı sıcaklıktaki (20, 30, 40, 50, 60, 70, 87, 92 ve 97 °C) nohudun su absorbsiyonun modellenmesi için Peleg modeli kullanılmıştır. K1
(Peleg hız sabiti) ve K2 (kapasite sabiti) değerleri, sıcaklık ve ultrasondaki artışla sırasıyla 96.28’den 5.43 s % k.b.-1
ye ve 7.45x10⁻³’ten 5.94x10⁻³ % k.b.-1 ye önemli ölçüde azalmıştır. K
1 ve K2 değerlerinin azalması su absorbsiyon
hızının ve su absorpsiyon kapasitesinin arttığını göstermiştir. Nohudun su absorpsiyonunu yüksek güçteki ultrason uygulaması düşük güçteki ultrasondan daha fazla etkilemiştir. Diğer taraftan, 40 kHz-100 W’lık ultrason uygulaması,
T
A
R
IM
B
İL
İM
LE
R
İ
D
E
R
G
İS
İ
J
O
U
R
N
A
L
O
F
A
G
R
IC
U
LT
U
R
A
L
S
C
IE
N
C
E
S
16 ( 20 10 ) 27 8 -2 8 6
bulunmuştur. Peleg modeli nohudun su absorbsiyon hızını ıslatma sıcaklığı, süre ve ultrasonla ilişkilendirilmesinde başarılı bir şekilde kullanılmıştır.
Anahtar sözcükler: Nohut; Su absorbsiyonu; Ultrasound; Peleg model
© Ankara Üniversitesi Ziraat Fakültesi
1. Introduction
Chickpea (Cicer arietinum L.) is one of the most readily produced and consumed pulses (grain legume) worldwide, particularly in the Indian subcontinent and Mediterranean countries (FAO 2008). Legumes are economical sources of protein, energy, vitamins and minerals. Food legumes decreased incidence of several diseases, such as cancer, cardiovascular diseases, obesity and diabetes (Bhathena & Velasquez 2002).
Whether used at home to prepare a variety of dishes or in commercial practice (e.g. canning), dry legumes need to be rehydrated by soaking in water or other pre-treatments before further processing. Researchers have already demonstrated that increasing the temperature of the soaking medium is an effective way to accelerate water uptake by various seeds and hence, to shorten the soaking time. Bean hydration prior to cooking has been reported to have an important role in determining the cooking time, appearance and the extent of protein denaturation and starch gelatinisation of legumes (Quast & da Silva 1977; Ekpenyong & Borchers 1980; Davis & Gordon 1982). The soaking process has been characterised as a time consuming step and many attempts have been directed towards shortening it (Rockland & Metzler 1967; Kon et al 1973). As soaking conditions vary depending upon the particular legume under study, it is necessary for practical applications to characterise and optimise these conditions. Hence, water absorption during soaking needs to be predictable as a function of time and temperature.
Modeling moisture transfer in grains and legumes during soaking has attracted considerable attention. The water absorption kinetics of dry legumes during soaking has been described by a two-parameter empirical Peleg model (Peleg 1988). The empirical model is simple to apply and has
been shown to successfully describe the water absorption behaviour of various legumes (Hung et al 1993; Nussinovitch & Peleg 1990). There have been many attempts directed towards analysing the hydration data and the modes of water transport in many legume varieties (Hsu et al 1983; King & Ashton 1985). However, as most of these analyses were based on the laws of diffusion (Hayakawa 1974) which usually involve numerous functions and parameters, it is difficult to describe the water absorption process in simple terms.
In an attempt to simplify the mode of water absorption by food materials, non-exponential empirical equation is proposed and become known as the Peleg’s equation. In general, the Peleg model shows the same or better fit than the models that used in the water absorption analyses. Additionally, it is basic model to describe the water absorption, that moisture absorption can be described easily. To select the most suitable model, degree of fit to the experimental data and simplicity of the model should be considered.
Presoaking of chickpeas alone may not be enough for decreasing the cooking time. Ultrasonic waves can cause a rapid series of alternative compressions and expansions, in a similar way to a sponge when it is squeezed and released repeatedly. Ultrasound cavitations can result in the occurrence of microstreaming which is able to enhance heat and mass transfer (Jayasooriya et al 2004; Zheng & Sun 2006). Ultrasonic is a rapidly growing field of research, which is finding increasing use in the food industry for both the analysis and modification of food products (Zbigniew et al 2007).
In this experiment, it was aimed to examine the capability of Peleg model in modelling the water absorption behaviour of ultrasonic application on the chickpea and to characterise the equation constants and to determine suitable conditions for rehydration.
2. Material and Methods
2.1. Materials
Chickpea samples (Cicer arietinum L.) which is certified as Inci-2003, was provided by Çukurova Agricultural Research Institute (Adana, Turkey). Initial moisture content of the samples was 11.58% dry basis (d.b.). After removing foreign materials and damaged seeds, it was sieved using thescreens with the opening of 7.50 and 9 mm in order to standardize the sizes. The average diameter was found to be 8.00±0.27 mm using digital micrometer.
2.2. Water absorption determination during soaking
The soaking of chickpea was performed at (20, 30, 40, 50, 60, 70, 87, 92 and 97; are arbitrarily selected between room and local boiling temperatures) °C with 25 kHz-100 W (acoustic energy density of 0.020 W cm-3), 40 kHz-100 W (acoustic energy density of 0.020 W cm-3) and 25 kHz-300 W (acoustic energy density of 0.015 W cm-3) and without ultrasound treatments. One hundred grams of chickpea seeds were immersed in 2000 ml deionized water (1:20); conventional and ultrasonic soaking were both performed in ultrasonic tanks (Intersonik Co., Turkey) until seeds were fully hydrated. For every 30 min, 4 g chickpea and 80 ml soaking water (1:20) were quickly removed from the tanks for the moisture content determination. Chickpea seeds were gently wiped with clean paper towel in order to remove excess water and grinded for the moisture content determination. The moisture content of randomly selected grains was determined in dry basis at 105°C using the AOAC method (AOAC 2002). Moisture contents were used to model with Peleg’s equation for water absorption characteristics of chickpeas. Tests were done in two replicates.
2.3. Modeling of chickpea water absorption as a function of time
Among many theoretical, empirical, and semi-empirical models, the most popular model which has been used to model the water absorption process of agricultural products is the Peleg model (Jideani & Mpotokwana 2009). Peleg (1988) proposed a two-parameter sorption equation and
tested its prediction accuracy during water vapor adsorption of milk powder and whole rice, and soaking of whole rice. This equation has since been known as the Peleg model:
M= Mo ± t K K t 2 1+ (1) where M is moisture content at time t in % d.b.; M0
is initial moisture content in % d.b.; K1 is the Peleg
rate constant in s % d.b.-1; K2 is the Peleg capacity
constant in % d.b-1.
The rate of sorption (R) can be obtained from first derivative of the Peleg equation:
2 2 1 1 ) (K K t K dt dM R + ± = = (2)
The Peleg rate constant K1 relates to sorption rate at
the very beginning (Ro), i.e., R at t = to
1 1 K dt dM R o t o = =± (3)
The Peleg capacity constant K2 relates to maximum
(or minimum) attainable moisture content. As
∞
→
t
, Equation (1) gives the relation between equilibrium moisture content (Me) and K2:2 1 K M Me = o± (4) 2.4. Statistical analysis
Calculated parameters for modeling and plots were compared using SIGMAPLOT 10 (Jandel Scientific, San Francisco, USA). ANOVA test (SPSS version 16) at P<0.05 was performed to predict theoptimum processing conditions.
3. Results and Discussion
3.1. Water absorption characteristics of chickpea during soaking
Food legumes are usually soaked before cooking to provide sufficient amount of moisture for gelatinization of starch and/or gelation of protein. It can be achieved either through conditioning below the gelatinization temperature and then cooking above the gelatinization temperature, or through direct cooking above the gelatinization temperature.
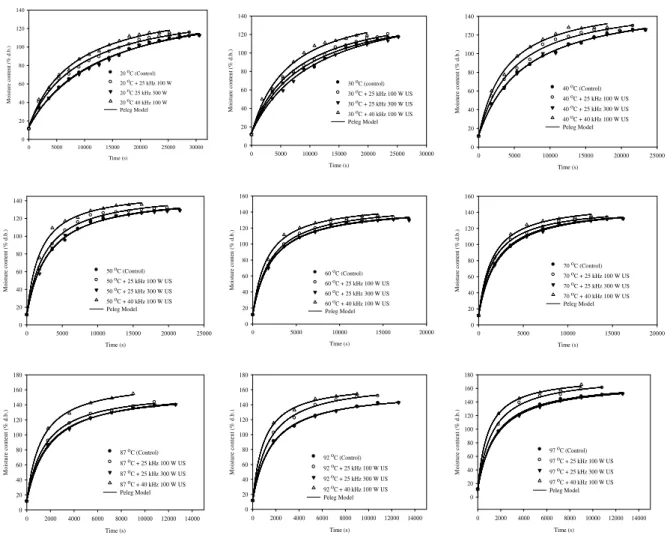
The mean moisture contents of soaked chickpeas at 20, 30, 40, 50, 60, 70, 87, 92 and 97°C without ultrasound and with 25 kHz-100 W, 40 kHz-100 W and 25 kHz-300 W ultrasounds were illustrated in Figure 1. The moisture content of chickpea during soaking were significantly (P<0.05) increased as the temperature, time and power of ultrasounds increased (Figure 1). Rate of increase in moisture content was higher during the early stages of soaking but lower in the late soaking periods. Chickpea water absorption curves are characterized by an initial phase of rapid water pickup followed by an equilibrium phase, during which the chickpea approaches its full soaking capacity. The rate of water absorption increased with increasing temperature as suggested by the slopes of the absorption curves getting steeper with increased temperature.
3.2. Modeling of chickpea water absorption as a function of time
The parameters Me, K1 and K2 were estimated by
using the non-linear regression analysis of Equations 1-4 (Table 1). The course of the hydration, adequately fitted by Peleg’s nonlinear equation with coefficients, shows that the seed water content increases with soaking time at all temperatures without and with ultrasound treatments.
K1 values of the Peleg model decreased from
88.74 to 9.82 s % d.b.-1 with increasing temperature from 20 to 97°C as seen in Table 1 and Figure 1. The order of magnitude of K1 values of this work is
in agreement with those of other researcher for chickpeas (Hung et al 1993; Turhan et al 2002). In the study of Turhan et al (2002), the values of K1
for spring chickpeas were found as between 61.56 and 3.42 s % d.b.-1 for a temperature range of 20-100°C. Similarly, K2 decreased from 7.02x10⁻³ to
6.25x10⁻³ % d.b.-1 for chickpea as the temperature increased from 20 to 97°C (Table 1). In the study of Hung et al. (1993) for Kabuli type chickpeas K2
values decreased from 9.1x10⁻² to 8.4x10⁻² % d.b.-1 at a temperature range of 5-42°C. Change of K2
value of chickpea with change in temperature was due to the differences in solid losses at different temperatures and Me could be different and K2
would be dependent upon the temperature (Table 1). The equilibrium moisture content of chickpeas increased from 155.47 to 171.45 % d.b.-1 with increase in temperature from 20 to 97°C. The Peleg model was successfully fitted to correlate water absorption of chickpea with soaking time and temperature (R2
=0.9895-0.9996 and RMSE (%) = 0.79-7.10).
3.3. Modeling of chickpea water absorption as a function of time and temperature
In order to find the effect of temperature on water absorption of chickpea, an Arrhenius type equation was used for modeling the dependence of Peleg rate constant (K1) on temperature, which had been used
previously to describe the temperature dependent hydration kinetics of legumes (Abu-Ghannam and McKenna 1997; Turhan et al 2002):
)
1
(
)
(
)
ln(
)
/
1
ln(
1T
R
E
K
K
a ref−
×
=
(5)where Kref, Ea, Rand T are reference hydration rate
constant in s % d.b.-1; activation energy in kJ mol-1; ideal gas constant in 8.314 x10⁻³ kJ mol-1 K-1; and soaking temperature in K-1, respectively.
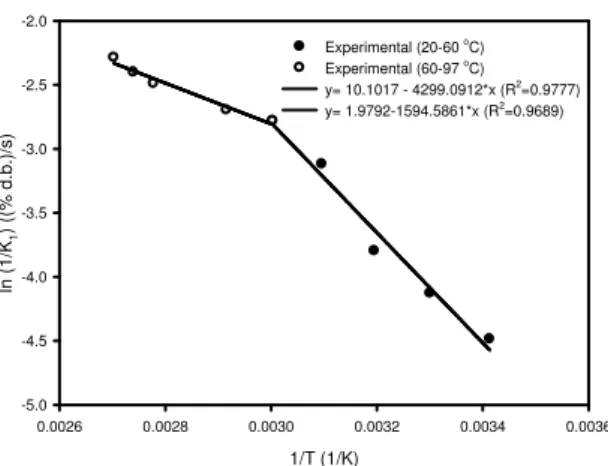
Arrhenius plot for chickpeas was superposed in Figure 2. The activation energy Ea is related to the
slope of this graph, and is indicative of the temperature dependence of K1. For soaked
chickpeas, a break seemed to occur at a certain soak temperature in the Arrhenius curve. The estimated natural log of rate constant K1 was fitted to a linear
model with break point, and the break temperature was found to be 59.96 (≈ 60)°C. Such a discontinuity in the Arrhenius curve has been observed during the soaking of chickpeas (Turhan et al 2002; Yıldırım et al 2011), and it has been suggested that the break is linked to the early onset of starch gelatinization.
From the regression of linear fit of Arrhenius curves below and above break point (60°C) in Figure 2, the following general models were derived to describe the water absorption kinetics of chickpeas as a function of time, temperature, initial and equilibrium moisture content during soaking process.
Time (s) 0 5000 10000 15000 20000 25000 30000 M oi st ur e co nt en t (% d .b .) 0 20 40 60 80 100 120 140 20 oC (Control) 20 oC + 25 kHz 100 W 20 oC 25 kHz 300 W 20 oC 40 kHz 100 W Peleg Model Time (s) 0 5000 10000 15000 20000 25000 30000 M oi st ur e co nt en t ( % d .b .) 0 20 40 60 80 100 120 140 30 oC (control) 30 oC + 25 kHz 100 W US 30 oC + 25 kHz 300 W US 30 oC + 40 kHz 100 W US Peleg Model Time (s) 0 5000 10000 15000 20000 25000 M oi st ur e co nt en t ( % d .b .) 0 20 40 60 80 100 120 140 40 oC (Control) 40 oC + 25 kHz 100 W US 40 oC + 25 kHz 300 W US 40 oC + 40 kHz 100 W US Peleg Model Time (s) 0 5000 10000 15000 20000 25000 M oi st ur e co nt en t ( % d .b .) 0 20 40 60 80 100 120 140 50 oC (Control) 50 oC + 25 kHz 100 W US 50 oC + 25 kHz 300 W US 50 oC + 40 kHz 100 W US Peleg Model Time (s) 0 5000 10000 15000 20000 M oi st ur e co nt en ( % d .b .) 0 20 40 60 80 100 120 140 160 60 oC (Control) 60 oC + 25 kHz 100 W US 60 oC + 25 kHz 300 W US 60 oC + 40 kHz 100 W US Peleg Model Time (s) 0 5000 10000 15000 20000 M oi st ur e co nt en t ( % d .b .) 0 20 40 60 80 100 120 140 160 70 oC (Control) 70 oC + 25 kHz 100 W US 70 oC + 25 kHz 300 W US 70 oC + 40 kHz 100 W US Peleg Model Time (s) 0 2000 4000 6000 8000 10000 12000 14000 M oi st ur e co nt en t ( % d .b .) 0 20 40 60 80 100 120 140 160 180 87 oC (Control) 87 oC + 25 kHz 100 W US 87 oC + 25 kHz 300 W US 87 oC + 40 kHz 100 W US Peleg Model Time (s) 0 2000 4000 6000 8000 10000 12000 14000 M oi st ur e co nt en t ( % d .b .) 0 20 40 60 80 100 120 140 160 180 92 oC (Control) 92 oC + 25 kHz 100 W US 92 oC + 25 kHz 300 W US 92 oC + 40 kHz 100 W US Peleg Model Time (s) 0 2000 4000 6000 8000 10000 12000 14000 M oi st ur e co nt en t ( % d .b .) 0 20 40 60 80 100 120 140 160 180 97 oC (Control) 97 oC + 25 kHz 100 W US 97 oC + 25 kHz 300 W US 97 oC + 40 kHz 100 W US Peleg Model
Figure 1-Means of experimental and predicted moisture contents of chickpeas at different temperatures without and with ultrasound during soaking
Şekil 1-Nohudun ıslatma sırasında ultrasonsuz ve ultrasonlu farklı sıcaklıktaki ortalama deneysel ve hesaplanmış nem içerikleri
− + × + = − o e o M M t T t M M ) 10 . 4299 exp( 10 08 . 4 5 ≤60°C (6) − + + = o e o M M t T t M M ) 59 . 1594 exp( 14 . 0 >60°C (7)
To estimate the model parameters Mo, Me, T and t, a
generalized non-linear regression on Equations 6 & 7 can be done using the entire data set. The
dependence of constant (K1) on temperature was
modeled using the Arrhenius equation, which has been used previously to describe the temperature dependent hydration kinetics of grains, and chickpea (Maskan 2002; Turhan et al 2002; Yıldırım et al 2011).
As it is evident from Figure 2, the linearity indicates an Arrhenius relationship for this model. When the Arrhenius equation (5) was applied to the values of K1 for temperatures below and above
break points (60°C), the activation energy values were predicted. The activation energy values of soaked chickpeas bellow and above 60°C for this
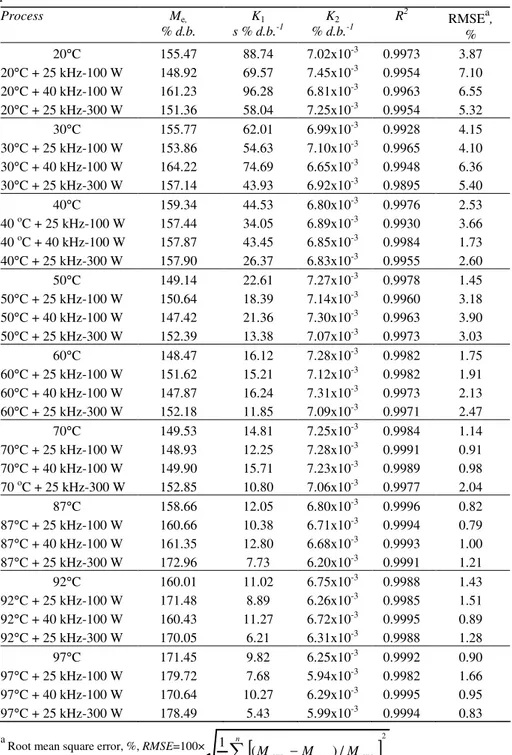
Table 1-Values of parameters from Peleg model for different temperatures without and with ultrasound application of chickpeas during soaking
Çizelge 1-Nohudun farklı sıcaklıkta ultrasonsuz ve ultrasonlu ıslatma sırasında Peleg modelinden elde edilen parametreleri Process Me, % d.b. K1 s % d.b.-1 K2 % d.b.-1 R2 RMSEa, % 20°C 155.47 88.74 7.02x10⁻³ 0.9973 3.87 20°C + 25 kHz-100 W 148.92 69.57 7.45x10⁻³ 0.9954 7.10 20°C + 40 kHz-100 W 161.23 96.28 6.81x10⁻³ 0.9963 6.55 20°C + 25 kHz-300 W 151.36 58.04 7.25x10⁻³ 0.9954 5.32 30°C 155.77 62.01 6.99x10⁻³ 0.9928 4.15 30°C + 25 kHz-100 W 153.86 54.63 7.10x10⁻³ 0.9965 4.10 30°C + 40 kHz-100 W 164.22 74.69 6.65x10⁻³ 0.9948 6.36 30°C + 25 kHz-300 W 157.14 43.93 6.92x10⁻³ 0.9895 5.40 40°C 159.34 44.53 6.80x10⁻³ 0.9976 2.53 40 oC + 25 kHz-100 W 157.44 34.05 6.89x10⁻³ 0.9930 3.66 40 oC + 40 kHz-100 W 157.87 43.45 6.85x10⁻³ 0.9984 1.73 40°C + 25 kHz-300 W 157.90 26.37 6.83x10⁻³ 0.9955 2.60 50°C 149.14 22.61 7.27x10⁻³ 0.9978 1.45 50°C + 25 kHz-100 W 150.64 18.39 7.14x10⁻³ 0.9960 3.18 50°C + 40 kHz-100 W 147.42 21.36 7.30x10⁻³ 0.9963 3.90 50°C + 25 kHz-300 W 152.39 13.38 7.07x10⁻³ 0.9973 3.03 60°C 148.47 16.12 7.28x10⁻³ 0.9982 1.75 60°C + 25 kHz-100 W 151.62 15.21 7.12x10⁻³ 0.9982 1.91 60°C + 40 kHz-100 W 147.87 16.24 7.31x10⁻³ 0.9973 2.13 60°C + 25 kHz-300 W 152.18 11.85 7.09x10⁻³ 0.9971 2.47 70°C 149.53 14.81 7.25x10⁻³ 0.9984 1.14 70°C + 25 kHz-100 W 148.93 12.25 7.28x10⁻³ 0.9991 0.91 70°C + 40 kHz-100 W 149.90 15.71 7.23x10⁻³ 0.9989 0.98 70 oC + 25 kHz-300 W 152.85 10.80 7.06x10⁻³ 0.9977 2.04 87°C 158.66 12.05 6.80x10⁻³ 0.9996 0.82 87°C + 25 kHz-100 W 160.66 10.38 6.71x10⁻³ 0.9994 0.79 87°C + 40 kHz-100 W 161.35 12.80 6.68x10⁻³ 0.9993 1.00 87°C + 25 kHz-300 W 172.96 7.73 6.20x10⁻³ 0.9991 1.21 92°C 160.01 11.02 6.75x10⁻³ 0.9988 1.43 92°C + 25 kHz-100 W 171.48 8.89 6.26x10⁻³ 0.9985 1.51 92°C + 40 kHz-100 W 160.43 11.27 6.72x10⁻³ 0.9995 0.89 92°C + 25 kHz-300 W 170.05 6.21 6.31x10⁻³ 0.9988 1.28 97°C 171.45 9.82 6.25x10⁻³ 0.9992 0.90 97°C + 25 kHz-100 W 179.72 7.68 5.94x10⁻³ 0.9982 1.66 97°C + 40 kHz-100 W 170.64 10.27 6.29x10⁻³ 0.9995 0.95 97°C + 25 kHz-300 W 178.49 5.43 5.99x10⁻³ 0.9994 0.83 a
Root mean square error, %, RMSE=100×
[
]
2 1 exp exp )/ ( 1
∑
− n pre M M M n1/T (1/K) 0.0026 0.0028 0.0030 0.0032 0.0034 0.0036 ln ( 1 /K 1 ) (( % d .b .) /s ) -5.0 -4.5 -4.0 -3.5 -3.0 -2.5 -2.0 Experimental (20-60 oC) Experimental (60-97 oC) y= 10.1017 - 4299.0912*x (R2=0.9777) y= 1.9792-1594.5861*x (R2=0.9689)
Figure 2-Change in K1 with temperature during
soaking of chickpea
Şekil 2-Nohudun ıslatılması sırasında K1’in sıcaklıkla
değişimi
model was found as 35.74 kJ mol-1 (R2=0.9777) and
13.26 kJ mol-1 (R2=0.9689), respectively. The
activation energies of chickpea at 25-60°C was found as 42.45 kJ mol-1 by Goven et al (2007) and 48 kJ mol-1 for temperature below 55°C, and 18 kJ mol-1 for temperature above 55°C by Turhan et al (2002) which is reasonably in a good agreement with the results of the present study.
3.4. Effect of ultrasounds on water absorption during soaking of chickpeas
One emergent application of power ultrasound in food industry is the enhancement of mass transfer in processes where diffusion takes place. Ultrasound introduces pressure variations at solid/liquid interfaces, and therefore increases the moisture absorption rate. Furthermore, ultrasonic waves also produce rapid series of alternative contractions and expansions (sponge effect) of the material in which they are travelling (Mulet et al 2003); this alternating stress creates microscopic channels which may make the moisture gain easier. Han & Baik (2006) reported that the oligosaccharide content of chickpeas effectively reduced by soaking with ultrasound for 3 h (64.7%).
Application of 25 kHz ultrasound significantly (P<0.05) increased the water absorption of chickpea at all temperatures (20-97°C) (Figure 1 and Table
1). The moisture content values of chickpea increased from 76.91 to 85.14% d.b. with 25 kHz-100 W ultrasound application for 20°C and 180 min soaking. A similar increase was observed for other soaking times at constant temperatures. Increase in power of ultrasound (from 100 to 300 W) significantly (P<0.05) increased the moisture content (from 85.14 to 91.89 % d.b. of chickpea during soaking at 20°C. When the higher ultrasound powers such as 300 W at 20°C and 180 min soaking was compared with control, moisture content of chickpea was found to be increased from 76.91 to 91.89 % d.b. However, 40 kHz ultrasound application did not significantly affect the moisture content of chickpea.
Ultrasound application changed with values of
K1 (Table 1). When the ultrasound such as 25
kHz-100 W was applied to chickpeas during soaking at 20°C, K1 value changed from 88.74 to 69.57 s %
d.b.-1. Also, increase in power of ultrasound (from 100 to 300 W) changed K1 value from 88.74 to
58.04 s % d.b.-1 at the same soaking temperature of 20°C (Table 1). Similarly, for 60°C without ultrasound, with 25 kHz-100 W and 25 kHz-300 W ultrasound applied chickpea the value of K1
decreased from 16.12 to 15.21 s % d.b.-1. A significant change in K1 value was observed for
other soaking temperatures (20 to 97°C) when ultrasound was applied to chickpeas during soaking (P<0.05). The ultrasound increased the water absorption of chickpea during soaking due to increasing of mass diffusion rate (Fuente et al 2004). However, application of high frequency ultrasound (40 kHz) did not significantly (P<0.05) affect the water absorption rate and the diffusion coefficient of chickpea.
Use of 25 kHz-100 W and 25 kHz-300 W ultrasounds reduced soaking time of chickpea by 24 and 45%, respectively. Wambura et al (2008) has reported that use of ultrasound made to reduce in cooking time of rice by 70%. These studies show that thermosonication can be used to speed up the water absorption during soaking operation. Finally, the ultrasound enhanced soaking described in this study will facilitate the advancement in the study of the mechanisms involved for the aim of extending the application of this technology.
4. Conclusions
Water absorption rate of chickpea significantly increased with increasing of soaking time, temperature and power of ultrasound (100 W and 300 W). High ultrasound frequencies such as 40 kHz did not significantly affect the water absorption of chickpea during soaking. K1 for a temperature
range of 20-97°C with 25 kHz-100 W, 40 kHz-100 W and 25 kHz-300 W ultrasound applications decreased from 96.28 to 5.43 s % d.b.-1 due to increasing of water absorption of chickpea during
soaking. Peleg model was successfully fitted to correlate water absorption of chickpea with soaking time and temperature. Average gelatinization temperature of chickpea from the water absorption model was found as 60±1°C. Ea value of chickpea
was found as 34.74 kJ mol-1 for below 60°C and 12.35 kJ mol-1 for above 60°C.
Acknowledgement
Thanks to Intersonik Co., Turkey for the support.
Nomenclature
Ea Activation energy, kJ mol-1
K1 Peleg rate constant, s % d.b.-1
K2 Peleg capacity constant, % d.b.-1
Kref reference hydration rate constant, s % d.b.-1
M Moisture content at time t, % d.b.
M0 Initial moisture content, % d.b.
Me Equilibrium moisture content, % d.b.
Mexp Experimental moisture content, % d.b.
Mpre Predicted moisture content, % d.b.
R Ideal gas constant, 8.314 x10⁻³ kJ mol-1 K-1
RMSE Root mean square error
T Temperature, K
t Time, seconds
% d.b. Percentage, dry basis.
US Ultrasound
References
AOAC (2002). Official methods of analysis of AOAC International, 17th Ed., Revision I, Gaithersburg, M. D, USA
Bhathena S J & Velasquez M T (2002). Beneficial role of dietary phytoestrogens in obesity and diabetes.
Journal of Clinical Nutrition 76: 1191-201
Davis E & Gordon J (1982). Food microstructure: An integrative approach. Food Microstructure 1: l-12 Ekpenyong T E & Borchers R L (1980). Effect of
cooking on the chemical composition of winged
beans (Psophocarpus tetragonolohus). Journal of
Food Science 45: 1559-1565
FAO (2008). Food and Agricultural Commodities Production. World pulses/ chickpea production and harvesting area. http://faostat.fao.org
Fuente D L S, Riera E & Gallego J A (2004). Effect of Power Ultrasound on Mass Transfer in Food Processing. The 18th
International Congress on Acoustics, pp 1853-1854
Han I H & Baik B K (2006). Oligosaccharide content and composition of legumes and their reduction by soaking, cooking, ultrasound, and high hydrostatic
pressure. Cereal Chemistry 83: 428-433
Hayakawa K I (1974). Predicting an equilibrium state value from transient state data. Journal of Food
Science 39: 272-275
Hsu K H, Kim C J & Wilson L A (l983). Factors affecting water uptake of soybeans during soaking.
Cereal Chemistry 60: 208-211
Hung T V, Liu K H, Black R G & Trewhella M A (1993). Water absorption in chickpea (C. arietinum) and field pea (P. sativum) cultivars using the Peleg model. Journal of Food Science 58: 848-852
Jayasooriya S D, Bhandari B R, Torley P & D’Arcy B R (2004). Effect of high power ultrasound waves on properties of meat: a review. International Journal of
Food Properties 7: 301-319
Jideani V A & Mpotokwana S M (2009). Modeling of water absorption of Botswana bambara varieties using Peleg’s equation. Journal of Food Engineering
92:182-188
King R D & Ashton S J (1985). Effect of seed coat thickness and blanching on the water absorption by soybeans. Journal of Food Technology 20: 505-509 Kon S, Brown A H, Ohanneson J G & Booth A N
(1973). Split peeled beans: preparation and some properties. Journal of Food Science 38: 496-498 Maskan M (2002). Effect of processing on hydration
kinetics of three wheat products of the same variety.
Journal of Food Engineering 52: 337-341
Mulet A, Carcel J A, Sanjuan N & Bon J (2003). New food drying Technologies-use of ultrasound. Food
Science and Technology International 9: 215-221
Nussinovitch A & Peleg M (1990). An empirical model for describing weight changes in swelling and shrinking gels. Food Hydrocolloids 4: 69-76
Quast D G & da Silva S D (1977). Temperature dependence of hydration rate and effect of hydration on the cooking rate of dry legumes. Journal of Food
Science 42: 1299-1303
Peleg M (1988). An empirical model for description of moisture sorption curves. Journal of Food Science
41: 57-72
Rockland L B & Metzler E A (1967). Quick-cooking lima and other dry beans. Food Technology 21: 344-348
Turhan M, Sayar S & Gunasekaran S (2002). Application of Peleg model to study water absorption in chickpea during soaking. Journal of Food Engineering 53: 153-159
Wambura P, Yang W & Wang Y (2008). Power ultrasound enhanced one-step soaking and gelatinization for rough rice parboiling. International
Journal of Food Engineering 4: 1-12
Yıldırım A, Öner M D & Bayram M (2011). Fitting Fick’s Model to analyze water diffusion into chickpeas during soaking with ultrasound treatment.
Journal of Food Engineering 104(1): 134-142 Zbigniew J D, Stadnik J & Stasiak D (2007).
Applications of ultrasound in food technology. Acta
Scientiarum Polonorum Technologia Alimentaria
6(3): 89-99
Zheng L & Sun D W (2006). Innovative applications of power ultrasound during food freezing processes-a review. Food Science and Technology 17: 16-23