2328
Received: 29 January 2015 Revised: 9 July 2015 Accepted article published: 22 July 2015 Published online in Wiley Online Library: 21 August 2015
(wileyonlinelibrary.com) DOI 10.1002/jsfa.7348
Casein/natamycin edible films efficiency
for controlling mould growth and on
microbiological, chemical and sensory
properties during the ripening of Kashar
cheese
Filiz Yangılar
a*
and Pınar O ˘guzhan Yıldız
b
Abstract
BACKGROUND: The objective of the present study was to investigate the effects of the dipping application of coating materials such as casein (Cas), casein/natamycin (Cas/N) and natamycin (N) solutions on chemical (e.g. pH, dry matter, fat, acidity, salt, protein, water-soluble nitrogen, ripening index, 12% trichloroacetic acid-soluble nitrogen and pH 4.6 soluble nitrogen), microbial (e.g. total number of aerobic mesophilic bacteria, lactic acid bacteria in MRS, lactic acid bacteria in M17, coliforms and mould) and organoleptic properties of Kashar cheese samples during ripening (3, 30, 60 and 90 days).
RESULTS: The difference in microbiological and chemical changes between samples were found to be significant (P< 0.05) during the ripening period. The highest and lowest mould counts were determined for the control (2.87 log cfu g−1) and the Cas/N (<1 log cfu g−1) samples, respectively, at 90 days of ripening. Compared to other cheeses, control and Cas/N-coated cheeses had higher levels of water-soluble nitrogen and ripening index at in the end of storage. The Cas/N-coated cheese samples were preferred more by the panellists, while N-coated cheese samples received the lowest scores.
CONCLUSION: This study suggests that coating could be used to improve the quality of Kashar cheese during ripening. © 2015 Society of Chemical Industry
Keywords: casein/natamycin; edible coating; shelf life; Kashar cheese
INTRODUCTION
Traditional dairy products, including cheese, have an important place in rural food culture, thus contributing to the formation of a whole country’s culture. Today, most of cheese types have reg-istered trademarks and have protected geographic indications.1,2
Kashar cheese is one of the most important cheese types in Turkey and it can also be seen as the most typically stretched curd or pasta-filata cheese.3Kashar cheese is traditionally made from raw
sheep’s or cow’s milk or their mixture, and the natural flora of milk is effective in the maturation process. According to Turkish Stan-dards Code 3272, this cheese type is classified as ‘fresh or aged (i.e. ripened) Kashar’. Fresh Kashar should be ripened within a period of 90 days to obtain aged Kashar, according to the related standards.4
Microbial growth and oxidation reactions occurring on the food surface are two of the main causes of deterioration and loss of fresh and processed solid food products. In order to prolong shelf life, some types of preservatives are added widely to most types of food, including cheese, at the rate required (by legislation on food additives)5,6to control degradation processes such as growth
of natural microflora or oxidation of native vitamins, colorants and flavours etc.
Being among the ready-made food types, cheese may be quickly and easily contaminated with harmful microorganisms, some of
which can spoil, causing undesired appearance and economic losses. Among such spoiling microorganisms are Yarrowia
lipoly-tica, Pseudomonas aeruginosa and Penicillium spp., while those
such as Listeria monocytogenes are pathogenic and may cause foodborne listeriosis.7,8 Packaging films based on antimicrobial
polymers could prove to be more efficient by maintaining high concentrations of the active substance on the food surface while preventing its migration, thereby maintaining a critical concen-tration for an extended period of time.9,10Natamycin (pimaricin)
is an agent showing antifungal features and is categorized as a polyene macrolide antibiotic. Natamycin is produced as the result of fermenting aerobically Streptomyces natalensis and other similar species which can be used as a food additive (E235) for the
∗ Correspondence to: Filiz Yangılar, Department of Nutrition and
Dietet-ics, School of Health, Erzincan University, 24000 Erzincan, Turkey, E-mail: [email protected]
a Department of Nutrition and Dietetics, School of Health, Erzincan University,
24000 Erzincan, Turkey
b Department of Food Engineering, Faculty of Engineering, Ardahan University,
2329
Casein/natamycin coatings in production of Kashar cheese www.soci.orgsurface treatment of hard, semi-hard and semi-soft cheese types and dry-cured sausages because of its activity against yeasts and moulds.11–13
It has recently been stated that antimicrobial films and coatings, including organic acids, enzymes, fungicides and natural antimi-crobial compounds such as spices, are used for various types of cheese.14–16Several studies have been conducted on the
applica-tion of various antimicrobial films in Kashar cheese in the literature, however; only a few of them dealt with the use of coating mate-rial. From this point of view, the objectives of the present study were to determine the effectiveness of casein, casein/natamycin and natamycin solution-based film coatings in the prevention of mould growth and to investigate their effects on microbiological and chemical properties, proteolysis levels and sensory evaluation of traditional Kashar cheese during ripening.
MATERIALS AND METHODS
MaterialsCow’s milk was obtained from a livestock farm in Göle district, Ardahan province. Microbial rennet (1:15 000) was purchased from Mayasan Co., Istanbul, Turkey, while the analytical grade reagents (casein and natamycin) were obtained from Merck (Darmstadt, Germany) and Sigma Chemical Co. (St Louis, MO, USA).
Production of traditional Kashar cheese
Cheese was manufactured in Alibey Plant in Göle, Ardahan. Cheese was produced in the traditional way from raw cow’s milk without using starter culture. In the production of cheese, raw cow’s milk (400 kg) was filtrated and heated to 33 ∘C, and rennet diluted with water (1/10) was added to the milk for coagulation. When curds attained sufficient maturity they were cut automatically in the process tank. Whey was removed from the cheese in a press cloth and the fresh cheese was taken to the press and cut into blocks. The blocks were then grated and kept at room temperature for 6–8 h to remove whey-developed acid. Thereafter, the fresh cheese was again cut into blocks and grated. After this process, the cheese sample was examined to determine if it had reached a suitable level for boiling by removing whey and developing acidity. Cheese suitable for boiling was weighed and 2 kg sam-ples were placed into baskets and boiled at 69–80 ∘C in 8% salt solution for 2–2.5 min. Boiled fresh cheese sample was plasti-cized and placed into moulds, which were sometimes reversed and allowed to gain suitable shapes. Kashar dough forming air bubbles was pricked with a probe and air was removed. Moulded cheese samples were stored in the mould for 12 h, then taken from moulds to the pre-ripening room. Kashar cheese samples manufactured traditionally were stored for 20 days to ripen at ambient temperature and 60–70% relative humidity. Following pre-ripening, samples were stored for an additional period of 70 days in four blocks at 4 ± 1 ∘C and 70–80% relative humidity. Thus cheese samples were ripened within a total of 90 days. Follow-ing the pre-ripenFollow-ing process, cheese samples were divided into four groups: control (C; without edible films); Cas (covered with casein solution); Cas/N (covered with casein solution containing natamycin; and N (covered with natamycin solution). Cheese sam-ples were first analysed at the end of the pre-ripening process and before coating. Other analyses were carried out at 30-day inter-vals (i.e. on the 3rd, 30th, 60th and 90th days) by duplicating all the analyses.
Preparation of casein/natamycin film-forming solution In the preparing the coating solution, a modified procedure of Chick and Hernandez17and Mezgheni et al.18was used, in which
acid casein (7.5%, w/w) was dispersed in deionized water, the pH was adjusted to 10.0 with 0.1 mol L−1 NaOH and heated at
75 ∘C for 20 min. The solution was then cooled to 25 ∘C, pH was adjusted to 7.0 and 2.5% (w/w) glycerol, 0.0125% (w/w) CaCl2and
0.07% (w/w) natamycin were added.19This solution was applied
to cheese sample groups by dipping the cheese wheels twice for 60 s only and then left to dry for 2 h. The residual natamycine was allowed to drip off and then the cheeses were dried for 1 h at 22 ∘C to allow the coating to cake.
Microbiological analysis
The dried coating solution was removed from each cheese wheel using sterile gloves and the sample groups were subjected to microbiological analysis. For each sample, 11 g cheese was taken and diluted in 99 mL of 0.85% (w/v) sterile saline solution. After that, a homogenizer (Lab. Stomacher Blender 400 BA 7021, Swardmedical) was used to homogenize the samples in a ster-ile polyethylene bag for 1.5 min. A sterster-ile NaCl solution (9 mL 0.85%, w/v) was used for dilution and the number of total aer-obic mesophilic bacteria (TAMB; Merck, at 30 ± 1 ∘C for 72 h),20
lactic acid bacteria (LAB) (in MRS; Merck, at 30 ∘ C for 48 h under anaerobic conditions),21 LAB (in M17; Merck, at 30 ∘C for 48 h),22
coagulase-positive staphylococci on Baird–Parker agar with egg yolk tellurite enrichment (Merck, at 37 ∘C for 24 h),20coliforms
(Vio-let Red Bile Agar, Oxoid, at 35 ± 2 ∘C for 48 h)21and moulds (Potato
Dextrose Agar, Oxoid, at 25 ∘C for 5–7 days)23were counted.
Chemical analysis
After the removal of coating materials, each of the cheese samples was fully shredded. Parameters of moisture, fat and salt were con-veniently measured by the method of Kurt et al.,24while titratable
acidity was detected by AOAC Official Method 920.124.25The
Kjel-dahl method26was used to determine total nitrogen (TN), while
pH was measured using a pH meter (WTW 340-1) as in the study of Savello et al.27
Nitrogen fractions
Water-soluble nitrogen (WSN), pH 4.6 soluble-nitrogen (pH 4.6-SN) and 12% trichloroacetic acid-soluble nitrogen (TCA-SN) nitrogen fractions as percent of total nitrogen of the cheese were deter-mined by Kuchroo and Fox.28A 20 g grated cheese sample was
homogenized in 40 mL H2O for 2 min using an Ultra Turrax blender
(IKA, Wilmington, NC, USA); stored at 40 ∘C for 1 h; centrifuged at 3000 × g for 30 min at 4 ∘C; then its fatty layer was removed and the supernatant was filtered with filter paper (Whatman 113). A 25 mL extract prepared for WSN was taken at an equal volume of 24% (w/v) and TCA was added for further fractionation of the nitrogenous compounds. The mixtures were incubated for 2 h at room temperature. Precipitates were filtered through filter paper.29The contents of WSN, TCA-SN and pH 4.6-SN were
determined using the Kjeldahl method. The ripening index (RI) was determined using the formula WSN/TN × 100.
Sensory evaluation
Eight panellists experienced in the sensorial evaluation of Kashar cheese assessed the cheese samples on the 3rd, 30th, 60th and 90th days of ripening, employing the method of Bodyfelt
2330
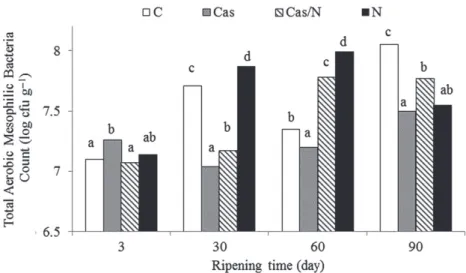
Figure 1. Changes in total aerobic mesophilic bacteria counts (log cfu g−1) after coating Kashar cheese samples during ripening. Different letters above
the bars indicate significant differences by Duncan’s multiple comparison test (P< 0.05).
et al.30and modifying the sensory criteria for the characteristics of
Kashar cheese. Samples were scored considering the five sensorial features – colour–appearance, texture, taste, odour and general acceptability – ranging from 1 (poor) to 9 (excellent).
Statistical analysis
The experimental design consisted of a completely randomized design in a factorial arrangement: four treatments of Kashar cheese (C, Cas, Cas/N and N), four ripening times (3, 30, 60 and 90 days) and two replicates. All statistical calculations were performed using SAS Statistical Software (SPSS 17.0; Chicago, IL, USA).31Duncan’s
multiple range test and variance analysis were used to evaluate the significance level (P< 0.05) for statistical differences.
RESULTS AND DISCUSSION
Dry matter, fat and protein contents and acidity, SH and pH rates of the cow’s milk used in the manufacturing process of Kashar cheese samples were 12.71 ± 0.28%, 3.5 ± 1.24%, 3.21 ± 0.11%, 5.8 ± 0.04 and 6.52 ± 0.07, respectively. Where ∘SH is the Soxhlet Henkel degrees, obtained by titrating 100 ml of milk with N/4 NaOH, using phenolphtalein as the indicator.
Microbiological evaluation
The results of the microbiological analysis carried out over cheese samples are given in Figs 1–5. Microbiological counts in cheese samples were found to be significant (P< 0.05) during the ripening period. TAMB counts of C samples were determined to be higher than the others on the 90th day of ripening. As can be seen in Fig. 1, total numbers of mesophilic aerobic bacteria in cheese samples were determined to range from 7.04 to 8.05 log cfu g−1. Fajardo
et al.10found mesophilic bacteria counts to be between 6.29 and
7.51 log cfu g−1in natamycin-coated Saloio cheese. Such results
found in previous studies are consistent with the present study. Generally, TAMB counts showed an increase for all samples during the 90th day in the present study. Similar results were obtained by several other researchers.32,33
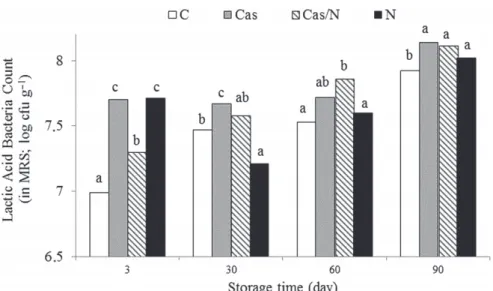
Counts of LAB in MRS were determined in cheese samples to range between 6.99 and 8.14 log cfu g−1, which were found to be
significantly lower (P< 0.05) in control and N samples on the 3rd
and 30th days of ripening, respectively. These results were found to be consistent with the values found in previous studies.33 Di
Pierro et al.34found LAB (MRS) to be in the range of 5–6 log cfu g−1
for the control on the14th day and for the chitosan/whey protein film-coated cheese samples on the 30th day, which are lower than the findings in the present study.
As can be seen in Fig. 3, the LAB (in M17) values found in cheese samples were between 6.90 and 7.89 log cfu g−1. In particular, LAB
counts of N samples were found to be 7.47 on the 60th and 6.93 on the 90th day of ripening. Such results showed that coating with natamycin had a negative effect on the growth of microorganisms compared with other coating materials. Yılmaz and Dagdemir33
obtained similar results, of between 6.73 and 8.13 for 120 days for beeswax-coated Kashar cheese samples. Lucera et al.35stated
that the total bacterial counts showed an increasing trend in fresh mozzarella cheese. The initial microbial count between samples was about 4.5 log cfu g−1and slightly faster in control samples than
in another cheese coated with potassium sorbate. Such results found in previous studies are not consistent with the present study. These results showed that coating with casein, casein/natamycin and natamycin solutions did not have any negative influences on the growth of microorganisms necessary for the maturation of cheese.
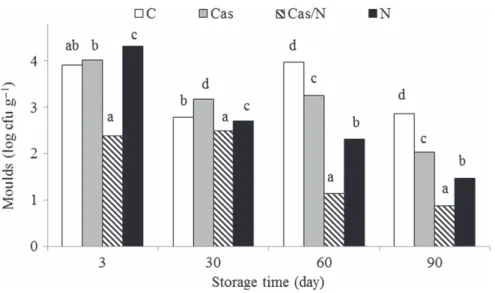
The treatment and ripening processes were found to affect sig-nificantly the moulds (P< 0.05) in cheese samples, being between
<1 and 4.32 log cfu g−1. Microbiological analyses showed that
sam-ples coated with casein, casein/natamycin and natamycin solu-tions exhibited a decrease in moulds compared to control after 90 days of storage, while the Cas sample represented higher mould counts than the sample Cas/N and N at the end of the ripening period. Similar results have been reported by several studies.32,33Baseline mould counts were reported to be 102cfu g−1
for all samples in Yılmaz and Dagdemir,33but increased in
con-trol sample from 2.75 to 4.60 log cfu g−1in the storage period
and from the 15th day of ripening. Sarıoglu and Oner32 stated
that mould and yeast could not be counted in Na-caseinate film-coated Kashar cheese samples from the 60th day while in uncoated samples counting could not be done from the 90th day. Fajardo et al.10reported the counts of mould and yeast to be
4.53 and 6.06 (log cfu g−1), respectively, and that on the 27th day
2331
Casein/natamycin coatings in production of Kashar cheese www.soci.orgFigure 2. Changes in LAB (in MRS agar) counts (log cfu−1) after coating Kashar cheese samples during ripening. Different letters above the bars indicate
significant differences by Duncan’s multiple comparison test (P< 0.05).
Figure 3. Changes in LAB (in M17 agar) counts (log cfu−1) after coating Kashar cheese samples during ripening. Different letters above the bars indicate
significant differences by Duncan’s multiple comparison test (P< 0.05). mould/yeast rate (4.95 ± 0.27). Ramos et al.36studied the efficacy
of edible films produced from whey protein isolate, glycerol and natamycin as antimicrobial agent. The authors showed through the viable cell count assay that natamycin incorporated in the film displayed a cidal effect against Yarrowia lipolytica. Balaguer et al.37
observed no fungi in the cheese samples packaged with the active film on the 26th day of storage at 4 ∘C, while there was fungal growth in control samples on the16th day of storage. Ollé Resa
et al.38studied the effectiveness of natamycin against yeast in Port
Salut cheese and found that it exerted an initial fungicidal effect against Saccharomyces cerevisiae. The barrier test was performed on cheese with Cas/N films, which means that the edible film exerted a fungicidal effect against moulds. Additionally, coated materials prevented contamination of the cheese by microorgan-isms inoculated in the dipping.
Counts of coliform bacteria found in cheese samples were between 0.90 and 4.10 log cfu g−1in the present study, while it
was<1 log cfu g−1in Yılmaz and Dagdemir’s study.33Sarıoglu and
Oner32stated that counts of coliform microorganisms could not
be detected in Na-caseinate film-coated Kashar cheese on the 90th day, while it was possible to count them in control samples on the 60th day.
The presence of human- or animal-sourced Staphylococcus in food at a high level indicates that the procedures of sanitation and heating are not enough. The use of antimicrobial films was also highly effective in inhibiting Staphylococcus aureus during ripen-ing time. Staphylococcus aureus count was below detectable levels (2 log cfu g−1) in all samples, which can be attributed to the
scald-ing process applied in the production of traditional Kashar cheese. A similar result was also reported by Yılmaz and Dagdemir.33
Pra-noto et al.39determined the inhibitor effect of antimicrobial
algi-nate film containing 0.4% garlic oil on Staph. aureus. Torlak and Nizamoglu40reported that in Kashar cheese samples coated with
renewable films the counts of Staph. aureus decreased on 14th day compared to the control group between 0.90–2.66 log cfu g−1and
all the film types exhibited an antimicrobial effect at a significant level compared to the control group (P< 0.05). Furthermore, Mei
2332
Figure 4. Changes in mould counts (log cfu−1) after coating Kashar cheese samples during ripening. Different letters above the bars indicate significant
differences by Duncan’s multiple comparison test (P< 0.05).
Figure 5. Changes in coliform counts (log cfu−1) after coating Kashar cheese samples during ripening. Different letters above the bars indicate significant
differences by Duncan’s multiple comparison test (P< 0.05).
storage of Mongolian cheese for controlling microbial populations was effective.
Chemical evaluation
The chemical composition of the cheese samples is given in Table 1. Chemical changes in samples were found to be statis-tically significant (P< 0.05) during a ripening period of 90 days. The dry matter values of cheese samples significantly increased. Dry matter of the samples was found to change between 56.73% and 64.61%. This increase was higher in the cheese samples without coating. The results also showed that the coating process with casein, casein/natamycin and natamycin solution might have delayed moisture losses compared to control. Fajardo
et al.10 reported the moisture content of coated Saloio cheese
before storage to be significantly higher than that of uncoated cheese samples, resulting mainly from the water content of the coating itself, while this difference was valid at 4 ∘C only for natamycin + chitosan-coated cheese samples. Yıldırım et al.42
found that the dry matter content in Kashar cheese samples A (control), C (coating with casein solution), D (coating with casein solution containing natamycin) and E (dipping in natamycin
solution) increased until the 60th day of storage (P< 0.05), after which it did not change significantly (P> 0.05).
The pH values of control and coated Kashar cheese samples during ripening are shown in Table 1. pH values of the coated samples decreased linearly during ripening. Fluctuations in pH during ripening were reported by Yıldırım et al.42in Kashar cheese
coated with casein solution. It was found by Di Pierro et al.34that
pH values of CWP-coated Ricotta cheese decreased after 7 days of storage. These findings are consistent with those in the present study.
Both the lowest (24.06%, w/w) and the highest (31.33%, w/w) fat contents were observed in the control sample. In coated Kashar cheese samples, Sarıoglu and Oner32reported that the lowest and
highest fat rates were 31.37% and 43.25%, while in the control group they were 30.5% and 42.25%. Similar results were obtained by Yılmaz and Dagdemir33and Yıldırım et al.42
Our data demonstrated that salt values found in the samples were between 2.22% and 4.74%. Gulec et al.43 also found the
lowest and highest salt rates of casein-coated Kashar cheese samples and control to be from 1.54% to 2.54% and from 1.54% to 2.43%, respectively.
2333
Casein/natamycin coatings in production of Kashar cheese www.soci.orgT able 1. T h e changes in chemical charac te ristics o f K ashar cheeses during ripening Cheese sample Ri p e n in g (da ys) Dr y m att e r (%) Fa t (%) Salt (%) p H A cidit y (%) Pr o te in (%) WSN (%) R ipening index (%) TC A -S N (%) pH 4.6-SN (%) C 3 59.17 ± 0.49d 24.06 ± 0.09d 2.22 ± 0.12a 5.05 ± 0.05a 1.22 ± 0.02b 24.51 ± 0.34a 3.44 ± 0.13b 14.04 ± 0.34c 4.52 ± 0.04b 5.94 ± 0.04c 30 59.53 ± 0.09b 29.87 ± 0.06c 3.08 ± 0.08a 5.17 ± 0.02a 1.30 ± 0.02a 27.11 ± 0.62a 3.94 ± 0.02b 14.55 ± 0.25c 5.51 ± 0.19c 6.74 ± 0.53c 60 60.09 ± 0.08a 30.19 ± 0.08d 3.30 ± 0.01c 5.29 ± 0.01a 1.50 ± 0.04a 28.15 ± 0.01a 4.27 ± 0.03c 15.18 ± 0.07b 6.39 ± 0.27c 9.94 ± 0.11d 90 64.48 ± 0.46b 31.33 ± 0.24d 4.74 ± 0.05d 5.31 ± 0.03c 2.82 ± 0.01c 28.49 ± 0.21a 5.34 ± 0.76b 18.71 ± 2.47b 7.25 ± 0.08d 10.59 ± 0.20d C a s 3 58.79 ± 0.16c 24.43 ± 0.01a 2.75 ± 0.62ab 5 .30 ± 0.01b 1.10 ± 0.01a 28.52 ± 0.10c 2.20 ± 0.01a 7.67 ± 0.02a 2.50 ± 0.12a 3.22 ± 0.02a 30 60.64 ± 0.17c 24.73 ± 0.59a 2.84 ± 0.14a 5.32 ± 0.08b 1.21 ± 0.04a 29.21 ± 0.13b 3.31 ± 0.14a 10.95 ± 0.09a 3.80 ± 0.13b 3.88 ± 0.05a 60 62.29 ± 0.01c 25.52 ± 0.03a 3.04 ± 0.01a 5.24 ± 0.06a 1.70 ± 0.10b 31.12 ± 0.17c 3.23 ± 0.02b 10.39 ± 0.05a 4.58 ± 0.08b 4.89 ± 0.01a 90 62.89 ± 0.05a 25.92 ± 0.06a 3.25 ± 0.02b 5.19 ± 0.02b 1.89 ± 0.01a 29.22 ± 0.22b 4.54 ± 0.21b 15.18 ± 0.89b 4.63 ± 0.06a 5.46 ± 0.19a C a s/N 3 56.73 ± 0.12a 26.40 ± 0.14c 3.17 ± 0.01b 5.47 ± 0.02c 1.56 ± 0.03d 28.13 ± 0.02c 3.93 ± 0.02c 13.98 ± 0.06c 2.63 ± 0.02a 3.49 ± 0.09b 30 58.94 ± 0.02a 26.75 ± 0.07b 3.42 ± 0.02b 5.22 ± 0.03ab 1 .74 ± 0.02c 29.59 ± 0.01b 4 ± 0.01b 13.51 ± 0.05b 3.89 ± 0.01b 6.36 ± 0.09bc 60 61.89 ± 0.02b 27.15 ± 0.06c 3.74 ± 0.04d 5.22 ± 0.01a 2.10 ± 0.03c 29.67 ± .0.26b 4.38 ± 0.16c 14.77 ± 0.41b 4.56 ± 0.21b 8.48 ± 0.26c 90 62.65 ± 0.19a 28.57 ± 0.03c 4.14 ± 0.02c 5.07 ± 0.06a 2.36 ± 0.14b 30.09 ± 0.02c 4.66 ± 0.72b 16.23 ± 1.63c 6.84 ± 0.09c 9.77 ± 0.03c N 3 57.85 ± 0.36b 25.71 ± 0.02b 2.76 ± 0.02ab 5 .62 ± 0.03d 1.34 ± 0.04c 26.28 ± 0.01b 2.66 ± 0.02b 10.14 ± 0.08b 2.47 ± 0.08a 3.19 ± 0.03a 30 62.41 ± 0.02d 26.40 ± 0.56b 3.01 ± 0.03a 5.31 ± 0.06b 1.47 ± 0.02b 27.81 ± 0.03a 3.11 ± 0.02a 11.31 ± 0.36a 3.19 ± 0.01a 5.82 ± 0.02b 60 62.83 ± 0.04d 26.65 ± 0.21b 3.12 ± 0.02b 5.21 ± 0.03a 1.66 ± 0.03ab 28.45 ± 0.02a 2.65 ± 0.28a 9.32 ± 1.01a 2.79 ± 0.04a 6.08 ± 0.02b 90 64.61 ± 0.05b 27.36 ± 0.14b 3.18 ± 0.04a 5.12 ± 0.02b 1.84 ± 0.03a 29.58 ± 0.05bc 2 .83 ± 0.04a 9.56 ± 0.06a 6.38 ± 0.15b 8.32 ± 0.03b M e an values fo llo w e d b y d iff er en t lett e rs in the same column a re sig n ifican tly diff e re n t (P < 0.05). C o n tr o l( C; without e dible fi lms); C as (0.8% w/v casein solution); C as/N (0.8% w/v casein solution con taining n atam yc in); N (0.8% w/v natam ycin solut ion).
2334
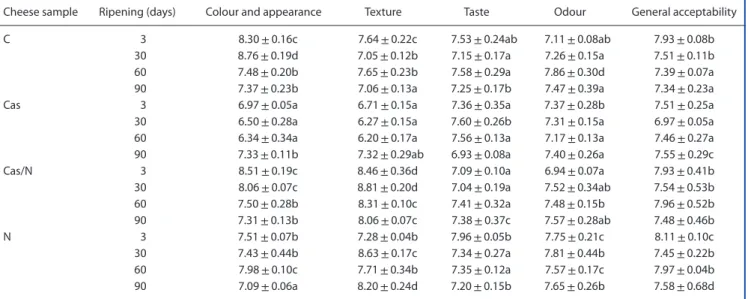
Table 2. Changes in sensory characteristics of Kashar cheeses during ripening
Cheese sample Ripening (days) Colour and appearance Texture Taste Odour General acceptability
C 3 8.30 ± 0.16c 7.64 ± 0.22c 7.53 ± 0.24ab 7.11 ± 0.08ab 7.93 ± 0.08b
30 8.76 ± 0.19d 7.05 ± 0.12b 7.15 ± 0.17a 7.26 ± 0.15a 7.51 ± 0.11b
60 7.48 ± 0.20b 7.65 ± 0.23b 7.58 ± 0.29a 7.86 ± 0.30d 7.39 ± 0.07a
90 7.37 ± 0.23b 7.06 ± 0.13a 7.25 ± 0.17b 7.47 ± 0.39a 7.34 ± 0.23a
Cas 3 6.97 ± 0.05a 6.71 ± 0.15a 7.36 ± 0.35a 7.37 ± 0.28b 7.51 ± 0.25a
30 6.50 ± 0.28a 6.27 ± 0.15a 7.60 ± 0.26b 7.31 ± 0.15a 6.97 ± 0.05a
60 6.34 ± 0.34a 6.20 ± 0.17a 7.56 ± 0.13a 7.17 ± 0.13a 7.46 ± 0.27a
90 7.33 ± 0.11b 7.32 ± 0.29ab 6.93 ± 0.08a 7.40 ± 0.26a 7.55 ± 0.29c
Cas/N 3 8.51 ± 0.19c 8.46 ± 0.36d 7.09 ± 0.10a 6.94 ± 0.07a 7.93 ± 0.41b
30 8.06 ± 0.07c 8.81 ± 0.20d 7.04 ± 0.19a 7.52 ± 0.34ab 7.54 ± 0.53b 60 7.50 ± 0.28b 8.31 ± 0.10c 7.41 ± 0.32a 7.48 ± 0.15b 7.96 ± 0.52b 90 7.31 ± 0.13b 8.06 ± 0.07c 7.38 ± 0.37c 7.57 ± 0.28ab 7.48 ± 0.46b N 3 7.51 ± 0.07b 7.28 ± 0.04b 7.96 ± 0.05b 7.75 ± 0.21c 8.11 ± 0.10c 30 7.43 ± 0.44b 8.63 ± 0.17c 7.34 ± 0.27a 7.81 ± 0.44b 7.45 ± 0.22b 60 7.98 ± 0.10c 7.71 ± 0.34b 7.35 ± 0.12a 7.57 ± 0.17c 7.97 ± 0.04b 90 7.09 ± 0.06a 8.20 ± 0.24d 7.20 ± 0.15b 7.65 ± 0.26b 7.58 ± 0.68d
Mean values followed by different letters in the same column are significantly different (P< 0.05).
Control (C; without edible films); Cas (0.8% w/v casein solution); Cas/N (0.8% w/v casein solution containing natamycin); N (0.8% w/v natamycin solution).
As can be seen in Table 1, treatment and storage significantly affected pH values (P< 0.05). Gulec et al.43stated that pH ranged
from 5.14 to 5.25 in casein-coated and uncoated Kashar cheese samples on the 90th of storage, which is consistent with the present study. Lucera et al.35determined that the pH of mozzarella
cheese, monitored during the entire observation period, ranged between 6.50 and 6.30.
Acidity rates of the samples varied between 1.10% and 2.82%. Di Pierro et al.34reported that titratable acidity of Ricotta cheese,
coated with a chitosan/whey protein film, reached the same level as measured in the control sample at the end of storage.
It was observed that protein values of the samples were between 24.51% and 31.12%. Gulec et al.,43reported the lowest and highest
rates of protein in cheese samples and control Kashar samples to be from 24.5% to 31.36% and from 24.5% to 31.28%, respectively, while Sarıoglu and Oner32found this rate in Kashar samples and
the control group to be from 27.70% to 36.64% and from 27.25% to 34.40%, respectively.
The rate of WSN increased during the ripening period in all cheese samples except in N film-coated Kashar cheese. Yılmaz and Dagdemir33found WSN to be significantly higher in control cheese
until day 90, followed by BW1 (single-layer coating). In the evalua-tion of the ripening index, the value ranged from 14.04% to 18.71% for control sample, from 7.67% to 15.18% for Cas-coated sample, from 13.51% to 16.23% for Cas/N-coated sample and from 9.32% to 11.31% for N-coated sample. While the lowest percentage of ripening index was determined in N and Cas cheeses, C and Cas/N cheeses showed the highest percentages. Also the ripening index values obtained at 90 days were different statistically. A decreasing trend was observed in ripening index levels of Kashar cheeses from the effect of coated materials. These results were similar to those of Yılmaz and Dagdemir.33In Yıldırım et al.,42the ripening
index in Kashar cheese samples increased steadily until the 60th day of ripening. Gulec et al.43reported that ripening index values
of all samples were similar until the 60th day, while on the 90th day ripening index values of control increased more than coated sam-ples. A balanced degradation of proteins into peptides and amino
acids is necessary for the development of texture, taste and aroma characteristics of ripened cheese samples. Proteolysis in cheese is often measured by means of quantification of WSN fraction of cheese, which consists of whey proteins, medium- and small-sized peptides from the degradation of caseins and free amino acids.33,44
The effects of the coating with these materials on the rate and extent of proteolysis were estimated quantitatively by the level of soluble nitrogen components in cheese during ripening.
As can be seen in Table 1, values of 12% TCA-SN in the cheese samples increased with increasing ripening time (P< 0.05). The values of 12% TCA-SN, expressed as a percentage, showed a signif-icant increase (P< 0.05) during the ripening process, similar results were obtained by Guven et al.33,45 Aydemir46 reported that the
increase in WSN%TN and TCA%TN values were low when Kashar cheese samples were ripened at 4 ± 1 ∘C following pre-ripening.
pH 4.6-SN ranged from 5.94% to 10.59% of the control samples, from 3.22% to 5.46% for Cas, from 3.49% to 9.77% for Cas/N and from 3.19% to 8.32% for N. pH 4.6-SN was significant (P< 0.05) during the ripening time. The pH 4.6-SN results were affected by the coated materials and their interactions. Values of pH 4.6-SN were found to be 10.72–23.76% of the sample of Kashar cheese samples in Hayaloglu.47
Sensory evaluation
The results of the sensory evaluation of cheese samples on a scale from 1 (poor) to 9 (excellent) are shown in Table 2. A sig-nificant difference (P< 0.05) was found to be among samples for colour–appearance, taste, texture, odour and general acceptabil-ity. The natamycine-coated cheese (N) received the highest texture score (8.20), while control cheese (C) had the lowest score (7.06). Sample Cas had the lowest odour (7.40) and taste scores (6.93). N and Cas/N samples were mostly preferred by the panellists. In particular, high dry matter and protein content of N sample might have affected the panellists’ scores. Cas sample was given the lowest scores by the panellists. The use of packaging films could prove more sensory qualification during ripening. Yıldırım et al.42
2335
Casein/natamycin coatings in production of Kashar cheese www.soci.orgKashar cheese compared to control and those coated with casein. Di Pierro et al.34stated that, compared to control, Ricotta cheese
exhibited better texture conditions when it was coated with chitosan/whey protein film, while no difference was found in visual appearance, texture, flavour and odour between uncoated and chitosan/whey protein film-coated Ricotta cheese samples. Cetinkaya et al.48reported significant differences between Kashar
samples coated with beeswax in terms of aroma, flavour, colour, appearance and texture.
CONCLUSIONS
The coating process significantly reduced the mould growth dur-ing the ripendur-ing process and has extended the shelf-life when compared to control. It is also indicated from the results that the use of casein coating together with natamycin can suppress mould growth during the ripening time without any adverse effects on cheese quality. An decreasing trend was observed in ripening index values of Kashar cheese samples coated with these mate-rials during ripening. In terms of sensorial evaluation, panellists gave the highest scores especially to the N group. This study is rel-evant since it indicates successfully through samples coated with casein, casein/natamycin and natamycin solutions that the men-tioned materials could be used as effective coating materials in the manufacture of traditional Kashar cheese.
REFERENCES
1 Dost A, Yenikan H, Okumus F and Isıklı ND, Bazı Geleneksel Peynirlerin Üretim Yöntemleri, in Geleneksel Gıdalar Sempozyumu, Van, Turkey (2004).
2 Ercan D, Quality characteristics of traditional Sepet cheese. Thesis, Graduate School of Engineering and Sciences, ˙Izmir Institute of Technology (2009).
3 Gobbetti M, Morea M, Baruzzi F, Corbo MR, Matarante A, Considine T et al., Microbiological, compositional, biochemical and textural characterization of Caciocavallo Pugliese cheese during ripening.
Int Dairy J 12:511–523 (2002).
4 TSI, Kashar Cheese Standard (TS 3272). Turkish Standard Institute, Ankara (2006).
5 EC95/2 on food additives other than colours and sweeteners. Euro-pean Parliament and Council Directive (1995).
6 Guillard V, Issoupov V, Redl A and Gontard N, Food preservative con-tent reduction by controlling sorbic acid release from a superficial coating. Innov Food Sci Emerg Technol 10:108–115 (2009). 7 McLauchlin J, Mitchell R, Smerdon W and Jewell K, Listeria
monocy-togenes and listeriosis: a review of hazard characterisation for use
in microbiological risk assessment of foods. Int J Food Microbiol
92:15–33 (2004).
8 Pintado C, Ferreira M and Sousa I, Control of pathogenic and spoilage microorganisms from cheese surface by whey protein films con-taining malic acid, nisin and natamycin. Food Control 21:240–246 (2010).
9 Ouattara B, Simard RE, Piette G, Begin A and Holley RA, Inhibition of surface spoilage bacteria in processed meats by application of antimicrobial films prepared with chitosan. Int J Food Microbiol
62:139–148 (2000).
10 Fajardo P, Martins JT, Fuci ´nos C, Pastrana L, Teixeira JA and Vicente AA, Evaluation of a chitosan-based edible film as carrier of natamycin to improve the storability of Saloio cheese. J Food Eng 101:349–356 (2010).
11 Stark J and Tan HS, Natamycin, in Food Preservatives, ed. by Russel NJ and Gould GW. Springer, New York, pp. 179–195 (2003).
12 Delves-Broughton J, Thomas LV, Doan CH and Davidson PM, Natamycin, in Antimicrobials in Food, ed. by Davidson MP, Sofos JN, Branen LA. CRC Press, Boca Raton, pp. 276–289 (2005).
13 Hanušová K, Dobiáš J and Voldˇrich M, Assessment of functional prop-erties and antimicrobial efficiency of polymer films with lacquer layer containing natamycin in cheese packaging. J Food Nutr Res
51:145–155 (2012).
14 Seydim AC and Sarikus G, Antimicrobial activity of whey protein based edible films incorporated with oregano, rosemary and garlic essential oils. Food Res Int 39:639–644 (2006).
15 Duan J, Park SI, Daeschel MA and Zhao Y, Antimicrobial chitosan–lysozyme (CL) films and coatings for enhancing microbial safety of Mozzarella cheese. Food Microbiol Safe 72:355–361 (2007). 16 Cerqueira MA, Sousa-Gallagher MJ, Macedo I, Rodriguez-Aguilera R, Souza BWS, Teixeira JA et al., Use of galacto mannan edible coating application and storage temperature for prolonging shelf-life of ‘Regional’ cheese. J Agric Food Chem 97:87–94 (2010).
17 Chick J and Hernandez RJ, Physical, thermal, and barrier characteri-zation of casein-wax-based edible films. J Food Sci 67(3):1073-1079 (2002).
18 Mezgheni E, D’Aprano G and Lacroix M, Formation of sterilized edible films based on caseinates: effects of calcium and plasticizers. J Agric
Food Chem 46:318–324 (1998).
19 Jay J, Modern Food Microbiology. Aspen Publishers, Gaithersburg, MD, p. 293 (1998).
20 Ozdemir S and Sert S, Gıda Mikrobiyolojisi Tatbikat Notları. Atatürk
Üniversitesi Ziraat Fakültesi Yayınları, Vol. 128, Erzurum, Turkey,
p. 111 (1996).
21 Diliello LR, Methods in Food and Dairy Microbiology. AVI Publishing, Westport, CT (1982).
22 Sert D, Ayar A and Akın N, The effects of starter culture on chemical composition microbiological and sensory characteristics of Turkish Kashar cheese during ripening. Int J Dairy Technol 60:245–252 (2007).
23 Koburger JA and Marth EH, Yeasts and moulds, in Compendium of
Methods for the Examination of Foods, ed. by Speck ML. APHA,
Washington, DC, pp. 197–202 (1984).
24 Kurt A, Cakmakci S and Caglar A, A Guide Book of Analysis Methods
of Milk and Milk Products. Agriculture Faculty, Ataturk University,
Erzurum, Turkey, (2007).
25 AOAC, Acidity of cheese. Official Method 920.124. Official Methods
of Analysis (17th edn), ed. by Horwitz W. Association of Official
Analytical Chemists, Gaithersburg, MD (2000).
26 IDF, Milk: Determination of the Nitrogen (Kjeldahl Method) and Calcu-lation of the Crude Protein Content. IDF Standard 20B. International Dairy Federation, Brussels (1993).
27 Savello PA, Ernstrom CA and Kalab M, Microstructure and meltability of model process cheese made with rennet and acid casein. J Dairy
Sci 72:1–11 (1989).
28 Kuchroo CN and Fox PF, Soluble nitrogen in cheese: comparison of extraction procedures. Milchwissenschaft 37:331–335 (1982). 29 Polychroniadou A, Michaelidou A and Paschaloudis N, Effect of
time, temperature and extraction method on the trichloroacetic acid-soluble nitrogen of cheese. Int Dairy J 9:559–568 (1999). 30 Bodyfelt FW, Tobias J and Trout GM, The Sensory Evaluation of Dairy
Products. Van Nostrand Reinhold, New York (1988).
31 SAS, SAS/STAT Software. Changes and Enhancements through Release
6.12. SAS Institute, Cary, NC (1998).
32 Sarıoglu T and Oner Z, Usage possibilities of an edible film for coating Kashar cheese and its effects on cheese quality. Food 31:3–10 (2006).
33 Yılmaz F and Dagdemir E, The effects of beeswax coating on quality of Kashar cheese during ripening. Int J Food Sci Technol 47:2582–2589 (2012).
34 Di Pierro PD, Sorrentino A, Mariniello L, Giosafatto CVL and Porta R, Chitosan/whey protein film as active coating to extend Ricotta cheese shelf-life. LWT – Food Sci Technol 44:2324–2327 (2011). 35 Lucera M, Mastromatteo M, Conte A, Zambrini AV, Faccia M and Del
Nobile MA, Effect of active coating on microbiological and sensory properties of fresh mozzarella cheese. Food Packaging Shelf Life
1:25–29 (2014).
36 Ramos ÓL, Silva SI, Soares JC, Fernandes JC, Poças MF, Pintado ME
et al., Features and performance of edible films, obtained from whey
protein isolate formulated with antimicrobial compounds. Food Res
Int 45:351–361 (2012).
37 Balaguer MP, Lopez-Carballo G, Catala R, Gavara R and Hernandez-Munoz P, Antifungal properties of gliadin films incorporating cinnamaldehyde and application in active food packaging of bread and cheese spread foodstuffs. Int J Food
Microbiol 166:369–377 (2013).
38 Ollé Resa C, Jagus R and Gerschenson L, Natamycin efficiency for controlling yeast growth in models systems and on cheese surfaces.
2336
39 Pranoto Y, Salokhe VM and Rakshit SK, Physical and antibacterial properties of alginate-based edible film incorporated with garlic oil.
Food Res Int 38:267–272 (2005).
40 Torlak E and Nizamoglu M, Uçucu Ya ˘g ˙Içeren Yenilebilir Kitosan Film-lerinin Staphylococcus aureus ve Escherichia coli O157:H7 Üzerine Etkinlikleri. Kafkas Univ Vet Fak Derg 17(Suppl A):125–129 (2011). 41 Mei J, Yuan Y, Wu Y and Li Y, Characterization of edible starch–chitosan
film and its application in the storage of Mongolian cheese. Int J Biol
Macromol 57:17–21 (2013).
42 Yıldırım M, Gulec F, Bayram M and Yıldırım Z, Properties of Kashar cheese coated with casein as a carrier of natamycin. Ital J Food Sci
18:127–138 (2006).
43 Gulec F, Bayram M, Yıldırım M and Yıldırım Z, Some properties of Ka¸sar cheese coated with casein, in Recent Developments in Dairy
Science and Technology: International Dairy Symposium (24–28 May),
Süleyman Demirel University, pp. 58–66 (2004).
44 Christensen TMIE, Bech AM and Werner H, Methods for crude frac-tionation (extraction and precipitation) of nitrogen components in
cheese. IDF Bulletin 261. International Dairy Federation, Brussels, pp. 4–9 (1991).
45 Guven M, Karaca OB, Kacar A, Hayaloglu AA and Curuk M, The effects of different packing material and ripening time on level of proteolysis of Kashar cheeses, in GAP 3th Agriculture Congress, Sanlıurfa, Turkey (2003).
46 Aydemir O, The characterization of Kars Kashar cheese. PhD thesis. Graduate School of Natural and Applied Sciences, Ondokuz Mayıs University, Samsun, Turkey (2010).
47 Hayaloglu AA, Volatile composition and proteolysis in tradition-ally produced mature Kashar cheese. Int J Food Sci Technol
44:1388–1394 (2009).
48 Cetinkaya F and Soyutemiz GE, A study on survival of Listeria
monocy-togenes during manufacture and ripening of Kashar cheese. Turk J Vet Anim Sci 28:927–932 (2004).