Contents lists available atScienceDirect
Forensic Science International: Genetics
journal homepage:www.elsevier.com/locate/fsigenResearch paper
A confirmatory test for sperm in sexual assault samples using a
microfluidic-integrated cell phone imaging system
Shreya Deshmukh
a,b,1, Fatih Inci
a,1,2, Merve Goksin Karaaslan
a, Mehmet Giray Ogut
a,
Derek Duncan
a, Leonard Klevan
c, George Duncan
d, Utkan Demirci
a,*
aCanary Center at Stanford for Cancer Early Detection, Bio-Acoustic MEMS in Medicine Labs, Department of Radiology, School of Medicine, Stanford University, Stanford,
CA, United States
bDepartment of Bioengineering, Schools of Engineering and Medicine, Stanford University, Stanford, CA, United States cDxNow, Inc., United States
dNova Southeastern University, Davie, FL, United States
A R T I C L E I N F O Keywords: Sexual assault Screening Sperm identification Computer vision Cellphone imaging Microfluidics A B S T R A C T
Rapid and efficient processing of sexual assault evidence to accelerate forensic investigation and decrease casework backlogs is urgently needed. Therefore, the standardized protocols currently used in forensic labora-tories can benefit from continued innovation to handle the increasing number and complexity of samples being submitted to forensic labs. To our knowledge, there is currently no available rapid and portable forensic screening technology based on a confirmatory test for sperm identification in a sexual assault kit. Here, we present a novel forensic sample screening tool, i.e., a microchip integrated with a portable cell phone imaging platform that records and processes images for further investigation and storage. The platform (i) precisely and rapidly screens swab samples (<15 min after sample preparation on-chip); (ii) selectively captures sperm from mock sexual assault samples using a novel and previously published SLeX-based surface chemistry treatment (iii) separates non-sperm contents (epithelial cells and debris in this case) out of the channel by flow prior to imaging; (iv) captures cell phone images on a portable cellphone-integrated imaging platform, (v) quantitatively differ-entiates sperm cells from epithelial cells, using a morphology detection code that leverages Laplacian of Gaussian and Hough gradient transform methods; (vi) is sensitive within a forensic cut-off (>95% accuracy) compared to the manual counts; (vii) provides a cost-effective and timely solution to a problem which in the past has taken a great deal of time; and (viii) handles small volumes of sample (20 μL). This integration of the cellphone imaging platform and cell recognition algorithms with disposable microchips can be a new direction toward a direct visual test to screen and differentiate sperm from epithelial cell types in forensic samples for a crime laboratory scenario. With further development, this integrated platform could assist a sexual assault nurse examiner (SANE) in a hospital or sexual assault treatment center facility to flag sperm-containing samples prior to further downstream testing.
1. Introduction
According to a UN Women report, 35–70% of women worldwide have experienced sexual violence at least once during their lifetime, with lasting and untenable effects on their physical and mental health [1]. These cases are often strongly hindered by social stigma and psy-chological harm on their route through the criminal justice system, with over 75% of rape cases never being reported [2]. The Rape, Abuse &
Incest National Network (RAINN) reports that only 5 out of 1000 per-petrators face imprisonment consequences. Part of the problem is a bottleneck in evidence testing. For example, a National Institute of Justice (NIJ)-led study performed an audit of sexual assault kits (SAKs) in Detroit, finding 11,303 kits in storage spanning 30 years, of which 8707 had never been submitted to a laboratory for testing [3].
This is not only due to the relatively late advent of modern forensic DNA testing in the mid-1990s. Interviews with detectives, prosecutors,
https://doi.org/10.1016/j.fsigen.2020.102313
Received 31 December 2019; Received in revised form 21 April 2020; Accepted 14 May 2020 ⁎Corresponding author at: 3155 Porter Drive, Palo Alto, CA, 94304, United States.
E-mail address:[email protected](U. Demirci). 1Co-first authors.
2Present address: UNAM-National Nanotechnology Research Center and Institute of Materials Science and Nanotechnology, Bilkent University, Ankara, 06800, Turkey.
Available online 19 May 2020
1872-4973/ © 2020 Elsevier B.V. All rights reserved.
sexual assault nurse examiners (SANEs), and other relevant individuals revealed that this astounding backlog could be attributed in part to the lack of consistent SAK processing protocols between collaborating agencies, budget limitations that restricted the number of staff who could process these samples, laboratory capacity issues, and the lack of specialized sexual assault units [3,4]. This problem is not unique to Detroit: an exhaustive research review has suggested that there may be upwards of 200,000 untested SAKs in police possession between 1982 and 2007 across the United States [4]. The demand for forensic testing is increasing and creating new opportunities for scientific advances in the field, as forensic technology can help cases move forward through these bottlenecks in the system [5].
Forensic samples not only include body swabs from SAKs but can also include crime scene samples, where traces of semen could be present on garments, linens, etc. The rapid collection of the perpe-trator’s DNA sample, whenever possible, is critical to enhance the probability of identifying the perpetrator [6]. This essentially involves identifying the presence of human sperm, but this is challenging due to the overwhelming presence of non-sperm matter (the victim’s own cells, other non-cellular biological matter, general debris, cloth fibers, etc.). Further, there are various presumptive and confirmatory tests for sperm due to varying test sensitivities and specificities, and the dif-ferent kinds of samples collected (biological, environmental, etc.) [6,7]. Sample screening is commonly performed using UV light, alter-native light sources, acid phosphatase (AP) overlay, or P-30 (PSA, prostate specific antigen). All of these methods are presumptive tests for semen identification. Light-based systems indicate nucleic material in all cell types, thus they cannot differentiate between cell types and may result in more false positives. Since AP activity presents at low levels in vaginal fluid and bacteria, it is not an ideal sperm-specific test. While P-30 is more specific than AP, the P-P-30 test may not be a stringent con-firmatory test for seminal fluid since this biomarker can also be found in the urine of some males, typically in cases with prostate issues [8–16]. As reported in the literature, P-30 exists at very low concentrations in female urine and it can also be found in other biological fluids, which could lead to false positive results. In addition, the urine of infant males contains fairly high levels of P-30 (detectable with the P-30 tests) be-tween the ages of ∼2−6 months that may interfere with the results [17]. Evaluating all of these current methods, the only gold standard confirmatory test for seminal fluid is to directly identify the presence of sperm in a sample by employing a microscope. However, visualizing sperm requires specific instrument configurations and methodologies, including microscopy imaging and staining (using Christmas Tree dye), which requires the analyst to perform many steps in an equipped la-boratory environment that is difficult to adapt as a confirmatory test at the forensic scene [18].
To our knowledge, there are currently no available rapid and por-table forensic screening technologies that are based on a confirmatory test for sperm. Here, we integrate a range of techniques in microfluidics and imaging [19–30] to present a novel sample-screening tool, i.e., microchip integrated with an innovative cell phone imaging platform (Fig. 1A). This integrated platform records and processes images and transfers the data to a virtual machine for further investigation and storage within minutes (Fig. 1B). Eventually, this innovative platform technology could help to efficiently channel those samples containing sperm toward downstream forensic analysis (Fig. 1C).
2. Materials and methods
2.1. Imaging
2.1.1. Fabrication of cell phone-based imaging system
Cell phone-based system was designed using SolidWorks software, and printed with the Omega sonic 1900 BT-3D printer. The system consisted of a white-LED, polarizers, 10x objective, lens (convex) were integrated into 3-D printout of the design box at the certain distances.
The imaging box on the system was designed to have a slider to control focal points for both lens and objective to be able to obtain better images with higher magnification. The microfluidic chip was then placed right after the lens at a distance within its focal length (Fig. 1, Supplementary Figure S1).
2.1.2. Microchip fabrication
The microfluidic chip was designed with one channel and two ports (inlet and outlet with 0.65 mm in diameter) for sampling/washing. The chip consisted of a PMMA surface with 3.2 mm of thickness, a double-side adhesive (DSA) layer with 50 μm of thickness, and a glass cover slide. The chip parameters were designed using CorelDRAW software (Ottawa, Ontario, Canada), and the chip components were cut using Versa LASER (Universal Laser Systems Inc., Scottsdale, AZ). Briefly, the PMMA layer provided the top layer where both inlet and outlet ports were milled, and the DSA film enabled the microchannel. The glass slide was modified with surface chemistry agents to capture sperm.
2.1.3. SLeX surface chemistry for sperm-specific binding
Glass slides were washed with absolute EtOH (200 proof) under sonication for 15 min, and they were dried with the filtered dry air right after the cleaning. Later, they were treated with oxygen plasma (ION3, Corona, CA) (100 mW, 1% oxygen) for 1.5 min, and then placed in 3‐MPS solution (4% v/v in absolute ethanol) for 30 min at room tem-perature. Therefore, the 3-MPS provided thiol groups during saliniza-tion process. To remove unbound chemicals, the surfaces were cleaned with ethanol and dried with the filtered dry air. Later, the chip com-ponents (PMMA, DSA, and glass slide) were assembled, and succinimide groups were decorated by incubating GMBS (10 mM in DMSO:PBS (1:1)) for 45 min at room temperature. The channels were then cleaned with PBS. To immobilize SLeX molecules, we strategized to develop hydrazide groups via 4‐ABAH reagent (0.25 mg/mL in 1:1 (v:v) ratio of DMSO:PBS). Again, another PBS wash was applied to remove unbound chemical residues. SLeX molecules with 0.1 mg/mL concentration was applied to the microchannels, and incubated overnight at +4 °C. Another PBS wash was performed. BSA (3% (w:v) in PBS) was applied as an anti-fouling agent, and it was incubated for an hour at room temperature. This protocol is based on previous work published by our group [38]. This treatment allowed for sperm cells incubated in the chip for an hour to be specifically bound, such that gently washing the chip through with PBS would flow out all nonspecifically bound cells and debris. No lysis is performed here so that all cells remain intact for morphological analysis, as well as any further processing as needed (for the bound, sperm cell fraction, or the unbound, non-sperm cell frac-tion).
2.1.4. Preparation of cell samples, and fluorescent staining
Sperm used in all experiments were prepared from raw semen samples, and epithelial cells were from buccal swab samples taken from inside of the cheeks using a flocked swab.
For staining of confirmatory sperm assays in the microscope ima-ging, we used DAPI (4′,6-diamidino-2-phenylindole) which binds to DNA (deoxyribose nucleic acid), according to the following procedure: Sperm (diluted semen sample) were first centrifuged at 1200 rpm for 3 min at room temperature, and the supernatant was removed and diluted with DAPI dye (990 μL PBS (phosphate buffered solution) and 10 μL DAPI). We then incubated the mixture for 10 min at room tem-perature. Later, we centrifuged the mixture again at 1200 rpm for 3 min at room temperature. The supernatant was removed, and the pellet was resuspended with 1 mL PBS. This step was repeated one more time to make sure removing dye artifacts. For the sampling and imaging, 20 μL of stained cells was added into the microchannel.
2.1.5. Microfluidic chip imaging in a traditional fluorescent microscope
To test the cell binding and distribution on chip, we imaged our chips on a traditional laboratory optical microscope with fluorescence
capabilities. For this, we used a Zeiss fluorescent microscope for brightfield imaging (in phase contrast mode, for optimal contrast for sperm localization). We also used this microscope for fluorescent ima-ging (with various dyes and channels, but ultimately focusing on DAPI staining, as outlined earlier with a UV (ultraviolet) excitation channel). These images were taken at various magnifications, using 10×, 20×, and 40× objective lenses, with further 10X magnification on each.
2.1.6. Assembly and components of portable imaging platform
The portable imaging platform as shown inFig. 1A was constructed using the following components in sequence, as laid out in Supple-mentary Fig. S1:
(1) LED (light emitting diode) block (a), controlled by a simple switch circuit (b) and a battery block containing two replaceable/re-chargeable 3 V batteries (c). This LED block consisted of a broad-spectrum white LED, and three additional colored LED modules for fluorescence imaging. The LEDs were powered by the battery block by a simple circuit that included a switch for controlling the LED colors.
(2) Objective lens (d) -we used a 10X achromatic objective lens from AmScope (SKU: A10X-V300) with numerical aperture of 0.25, and tube length of 160 mm (DIN standard).
(3) Aspheric lens (e) -we used a Mounted Geltech Aspheric Lens from Thorlabs (part number C240TME-A) with f-number = 8.00 mm, numerical aperture of 0.50, and anti-reflective coating, with a range between 400−600 nm.
(4) Focal length adjustment levers that are 3D-printed (f, g). (5) iPhone 5 camera and screen-endpoint of our imaging module.
Assembly consists of 3D-printing of the three main components which slot into each other, along with 2 smaller components which are
focal length adjustment levers.
2.1.7. User workflow and focus adjustment on portable imaging platform
The phone is loaded into the device (simply slid into the custom-made phone holder, which can be custom-made for different types of phones). The sample-loaded chip is simply inserted into the platform, and then, the light is switched on. Following this, the focal plane is chosen using the adjustment lever on the side of the device, with the field of view directly visible on the phone screen. Magnification (via digital zoom), fine range of focus, and image capture are controlled using the intuitive interface of the phone screen.
2.2. Sperm detection algorithms
2.2.1. Data transfer and analysis platform
Images captured on the phone are stored in the phone’s local library as JPEG images at 50% digital zoom, and are transferred via Bluetooth, internet, or cable transfer to a laptop or computer for analysis. Our image analysis platform is currently run on an open-source python-based platform (which can be run from a downloadable jupyter note-book which has a simple and visual user interface). For future in-tegration, we are developing a smartphone application to perform the analysis directly on the cellphone and eliminate the need for a separate computer.
The following sections describe different analysis strategies that were performed on the images, including some that were tested but not used in the final implementation.
Algorithm A: Watershed, flood filling, and edge detection-based approach to sperm identification
Initial segmentation attempts resulted in over segmentation despite applying label-based watershed algorithm. This is because small frag-ments of cell debris were also counted as sperm. However, after a close
Fig. 1. (A) Sample handling workflow (<15 min in total), from sample loading through cellphone image acquisition to analysis. (B) Image processing workflow, from
original cellphone image through three main steps until final sperm detection result: (1) initial morphology-based sperm selection with a Laplacian of Gaussian blob detection method, (2) exclusion of epithelial cells in the sperm’s surroundings by a pixel sum threshold, (3) Hough gradient transform on the binarized image with a minimum distance parameter to reduce overcounting of the same sperm cell. (C) Proposed adaptation of this integrated platform into a forensic workflow scenario.
examination of underlying sperm images, we concluded that sperm cells had higher intensities and more ellipsoidal appearance compared to epithelial cells. Therefore, after converting RGB images into grays-cale ones, we continued by blurring the input images so that adaptive thresholding would yield more smooth results. Then, adaptive thresh-olding with Gaussian kernel was applied to each input image. To ensure that sperm cells are selectively separated from other small cell debris, intensity range of thresholding was tailored according to average in-tensity of sperm cells calculated beforehand. Then using morphological image operations and a 2-by-2 square kernel each image has been di-lated twice. This step has been followed by additional closing and erosion operations to guarantee structural stability of segmented cells. Finally, segmented instances were filtered according to their eccen-tricity, area as well as distance from each other. This filtering was important as it allowed us to only detect sperm and not other objects of same size and intensity such as small air bubbles or debris. Detected cells were overlaid on the original image and they have been clearly indicated for visual investigation using bounding box rectangles. This method had comparable performance to the other strategies in many ways, but had two false negative cases, which is why we proceeded with other image analysis strategies due to the importance of having 100% sensitivity for a rule-out test as much as possible.
The following image analysis strategies are implemented in jupyter notebook using Python 2 and various open-source modules for maximal accessibility and ease of use.
Algorithm B: Hough gradient approach for images with sperm cells and no epithelial cells
This algorithm is similar to the previous one in some ways, but uses the Hough gradient transform for sperm selection rather than a Laplacian of Gaussian. This allows for more sperm-specific morphology parameters to be selected that are less likely to overlap with the char-acteristics of epithelial cells. It is also a much faster algorithm by about an order of magnitude, although both are fast (<10 s per image for this one, <1 min per image for the previous algorithm). There is still a pixel sum threshold in this method to avoid counting epithelial cells. However, it has lower specificity and higher rates of false positives with epithelial cells. Therefore, it was not selected in case of any remnant epithelial cells even after washing.
2.3. Image pre-processing for subsequent analysis
Raw JPEG images from the phone are first located and uploaded, then converted from the RGB (red green blue) image format to grays-cale format, which flattens a 3-dimensional array into a 2-dimensional array by removing the color channels and representing the pixels of the image in the range of 0–256. The next step in preprocessing involves segmenting the image by applying a binary threshold of 140, which was selected manually for optimal results are testing on a batch of sample images. The borders of the image are also cropped to reduce the effects of spherical aberration in order to avoid mislabeling of sperm along the borders. For this, 20% of the area of the image on each border is ex-cluded.
2.4. Sperm selection with Hough gradient method
This method takes the pre-processed image and applies a Hough circle transform to it, with a number of parameters selected for optimal results are testing on a batch of samples images. We use the HoughCircles in Python’s application of OpenCV (an open-source image analysis toolbox), namely cv2. We run this function on the pre-pro-cessed (grayscale and binarized) image, choosing the Hough Gradient method. We provide the following parameters:
•
A minimum distance between detectable circles of 20 pixels.•
Inverse ratio of the accumulator resolution to the image resolution, provided as 1.•
Parameter 1 with a value of 5 (the higher threshold of the two passed to the Canny edge detector, as stated in the documentation for the function code).•
Parameter 2 with a value of 6 (the accumulator threshold for the circle centers at the detection stage). The value of this parameters controls the specificity of the circle detector.•
Minimum and maximum radius for the detectable circles (5 and 15 pixels, respectively).This function returns a list of detected circles under these para-meters, with their corresponding locations in the pixel array, and radii.
2.5. Improving selectivity of the Hough transform by adding a local region pixel sum threshold
Similarly to the Log method, the Hough Gradient Method alone did not result in adequate specificity for sperm detection, returning some false positives in the case of epithelial cells in the image that were not removed in the binarization. To exclude these false positives, we added a step to the image processing that is similar to the one used after the blob detection approach. Here we look at the local region around each Hough-identified circle, an area that is 100 px by 100 px wide, centered around the detected circle center (keeping in mind that the detected circles have a maximum radius of 15 px/maximum diameter of 30 px). The pixels in this 100 px by 100 px region are summed, and a threshold is applied to this pixel sum. If the sum exceeds 9200, the detected circle is marked as a sperm. If the sum is below 9200, it is excluded as a false positive from an epithelial cell patch. This threshold was selected after examining a large number of samples images and their detected circles to determine the optimal threshold for separating true and false sperm heads.
2.6. Final image processing result
The result of the image processing workflow above, which runs in a few seconds, is a list of “true” detected sperm heads with their locations marked on the base image. This can be compared side-by-side with the original image to visually verify whether detected sperm heads are truly so, or if any are missed. The result also includes a sperm count for each image run through the code.
Algorithm C: Blob detection approach for images with mixed sperm and epithelial cells
2.6.1. Image pre-processing for subsequent analysis
For these complex images which contain a mixture of different cell types and debris from a swab sample, raw JPEG images from the phone are first located and uploaded, then converted from the RGB (red green blue) image format to grayscale format, which flattens a 3-dimensional array into a 2-dimensional array by removing the color channels and representing the pixels of the image in the range of 0–256. The image is then inverted in preparation for running the Laplacian of Gaussian.
2.7. Blob detection with Laplacian of Gaussian
Next, the feature module is loaded from scikit-image, and the in-verted image is passed in for blob detection, with the goal of pre-identifying sperm selectively by their morphology (shape, size, in-tensity). We used the Laplacian of Gaussian (LoG) method of blob de-tection, since it is the most accurate of the three blob detection methods here, although it is the slowest. The runtime is still below one minute per image. The parameters we used are as follows:
•
The minimum standard deviation of the Gaussian kernel is set to 3•
The maximum standard deviation of the Gaussian kernel is set to 15•
The threshold, or absolute lower bound for scale space maxima, is set to 0.12.•
With this combination of parameters chosen through testing a range of the parameters on an image training set, we aimed to capture the size range and intensity range at which sperm cells would occur in our images.2.7.1. Improving selectivity of the Laplacian of Gaussian by adding a local region pixel sum threshold
In this section, we look at the local region around each LoG-iden-tified circle, an area that is 100 px by 100 px wide, centered around the detected circle center (keeping in mind that the detected circles have a maximum radius of 15 px/maximum diameter of 30 px). The pixels in this 100 px by 100 px region are summed, and a threshold is applied to this pixel sum. If the sum exceeds 9524, the detected circle is marked as a sperm. If the sum is below 9524, it is excluded as a false positive from an epithelial cell patch. This threshold was selected after examining a large number of samples images and their detected circles to determine the optimal threshold for separating true and false sperm heads.
2.8. Reducing overcounting of multiple sperm heads in the same location
In some cases, multiple sperm heads were being counted in the same location due to looping through the image multiple times. To avoid this overcounting error, we included a step in which the Hough gradient transform is used to implement a minimum distance parameter and exclude such overcounting.
3. Results
Distinguishing between sperm cells and non-sperm objects is one of the critical challenges in accurately detecting sperm visually. In vaginal swabs, this often means a sample containing a predominant load of
vaginal epithelial cells, although there can also be other cell types (yeast, bacterial) and other debris. For our experiments, we prepared mock samples by mixing raw, unwashed semen samples with fresh buccal swabs taken on flocked swabs. This mixture contained epithelial cells, sperm cells, debris of various kinds, and potentially a small number of other cells types as may have been introduced in the buccal swab or the semen aliquot. We followed two strategies to address this detection challenge, leveraging both image processing and surface chemistry techniques. First, we designed our software algorithms to select specifically between sperm and non-sperm (epithelial cells, debris) with the strategies described above. Second, we experimentally incorporated a design choice in our microfluidic chip to wash away any non-sperm objects and keep the bound sperm on surface.
3.1. Cellphone imaging platform
We conducted the imaging of sperm samples on our microfluidic chip using our custom-built cell phone-based platform. The portable imaging platform is designed to be as simple as possible for (1) ease of use, (2) reducing potential of malfunction in the field, (3) low weight and portability, and (4) low cost to enable distribution. As optical components can add significant cost, weight, and complexity to any imaging platform, we finalized our design with a small and efficient set of components as described in detail in the Supplementary Fig. S1 and in Section 4. Assembly is fast, intuitive, straightforward, and easily adjustable, without requiring any special equipment after the 3D-printed components are 3D-printed in polymer and the LED circuit is sol-dered together. Samples were easily loaded and adjusted to focus on the region of interest, followed by image capture and transfer for analysis, according to the workflow described inFig. 1A.
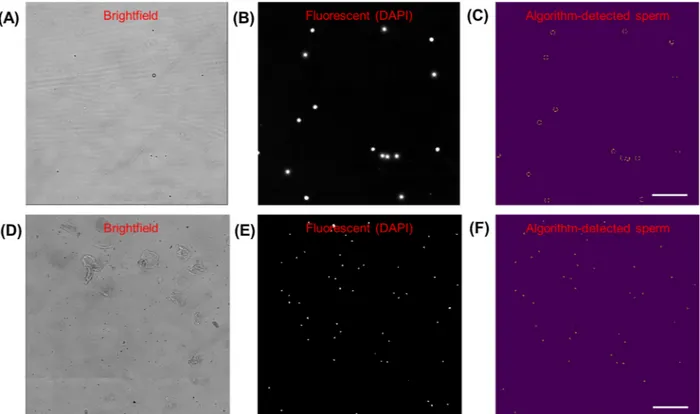
Fig. 2. Microscope images of sperm cells on chip, stained with DAPI. Scale bar = 50 μm, magnification = 200×. (A) Brightfield image. (B) Pre-analysis image:
Fluorescent channel image (same location as (A)), converted to greyscale. (C) Post-analysis image: Segmented image with thresholded binarization, and circles identified with OpenCV Hough Transform, with 98% accuracy compared to manual counting.
Microscope images of sperm cells mixed with epithelial cells (from a buccal swab) on chip, stained with DAPI. Scale bar =100 μm, magnification = 100×. (D) Brightfield image of sample. (E) Pre-analysis image: Fluorescent channel image (same location as (D)), converted to greyscale. (F) Post-analysis image: Segmented image with binary threshold, and circles identified with OpenCV Hough Transform, with 98% accuracy compared to manual counting for 50 sperm cells and 20 epithelial cells.
3.2. Image processing algorithms to detect sperm in microscope images
Before developing an image processing algorithm with cellphone images which are challenging to work with, we imaged our microfluidic chips in a high-quality microscope-camera system. Before loading, the cells were stained with DAPI (with a staining protocol as described in the Section4) to highlight sperm heads. This simple image processing algorithm used the fluorescent channel images to screen for sperm heads by their morphology using the Hough gradient transform, and implementing a maximum radius parameter to exclude DAPI-stained epithelial cell nuclei which are larger than the fluorescence signal from stained sperm heads (as shown inFig. 2). This quantification performed very well with the fluorescent microscope images, demonstrating 98% accuracy compared to the manual count, in both sperm-only sample cases (Fig. 2A–C) and sperm-epithelial cell mixed sample cases (Fig. 2D–F). These high-quality, high-resolution images of the samples with high signal-to-noise ratio for the fluorescently stained cell com-ponents allowed us to develop an initial sperm-counting algorithm that reliably detected cells of interest. These assays were developed to set a starting point for the subsequent experiments with cellphone imaging, where our goal was then to count the sperm without the need for fluorescence imaging.
3.3. Image processing algorithms to detect sperm in cellphone images
The microfluidic chips loaded with samples were imaged using our cellphone imaging system, and custom algorithms developed to analyze these images based on the methods initially developed using the mi-croscope images as covered previously inFig. 2. While the cellphone system is inexpensive, portable, and easy to operate, it comes at the cost of images that have lower resolution, contain some spherical aberration at the borders, and are brightfield only, as can be seen inFig. 3A. This
calls for accurate detection and specificity from brightfield images without fluorescence labels. Thus, the goal of these image analysis methods was to selectively detect sperm in lower quality, brightfield images even in the presence of confounding objects such as epithelial cells and debris of various kinds.
Images captured on the cellphone are transferred to a standard laptop or desktop computer via Bluetooth, internet, or cable transfer, as per the convenience of the user. On a computer, the automated algo-rithm is easily and rapidly run by a user with minimal training from a downloadable, open source jupyter notebook, which is a visual and accessible interface of python. It can analyze individual images at a time, or a large set of images together to output the results for each of them efficiently, for whole chip coverage. This is especially important in achieving sensitivity when looking for rarely observed sperm cells, of which there may be a small absolute number of cells found throughout the chip, not all of which will occur in a single field of view.
We tested various image processing strategies for sperm specific detection, selecting a final algorithm on the basis of optimal perfor-mance with sensitivity, specificity, and quantification accuracy. Watershed methods been very popular in cell segmentation challenges, and one of our methods (we will refer to it as Algorithm A) using wa-tershed and flood-filling edge detection demonstrated very good per-formance, but had some false negative cases [31–33]. We thus pro-ceeded with other image analysis strategies due to the importance of having 100% sensitivity for a rule-out test as much as possible. Another method used the circle-finding Hough gradient transform to select sperm cells by morphology [34,35]. This method (referred to as Algo-rithm B) was comparably accurate and fast (<10 s per image), but with higher rates of false positives from epithelial cells. It was therefore not selected in favor of a higher-specificity algorithm.
The results of the final algorithm, which we will call Algorithm C, are described in Fig. 3. Algorithm C had several steps to maximize
Fig. 3. Images of sperm cells mixed with cheek epithelial cells (from a buccal swab) on cellphone imaging prototype. Scale bar =100 μm, magnification = 10×. (A)
Raw brightfield image. (B) Post-analysis image: Original image overlaid with circles identified using OpenCV Hough Transform and local ROI pixel sum threshold. Analysis parameters used were Laplacian of Gaussian-based blob detection with a threshold of 0.12, a pixel sum threshold of 9524 for epithelial cell removal, and a Hough gradient transform with minimum distance parameter of 20 pixels to exclude overcounting error. (C) Confusion matrix for sperm detection in various cellphone images containing no cells, epithelial cells only, and a mixture of sperm and epithelial cells. “Positives” are sperm-containing images, while “negatives” are images without sperm (but may contain epithelial cells). Total number of images tested = 57. (D) Correlation of automated counts to average of four manual counters. The coefficient of correlation (R) is 0.709. (E) Bland–Altman plot comparing the results of the automated count with the average of four manual counters. The mean difference between manual and automated sperm counts is 0.39.
sperm selection sensitivity, as well as reducing epithelial cell or debris counting error to maximize specificity, to be valuable as a reliable screening test with minimal false negatives and false positives. For these cellphone images with a mixture of sperm and epithelial cells, the three main steps were as follows:
(1) In the first step (Fig. 1B(1)), sperm were selected by their mor-phology using an inverted Laplacian of Gaussian-based blob de-tection method. Although this is the slowest of the blob dede-tection methods, it is the most accurate. It was therefore selected for re-liability without significant costs in processing time; the total run-time of the code is still under one minute per image. It has been used widely in various computer vision applications due to its good edge detection performance, although it has not to our knowledge been demonstrated for the analysis of biological (including for-ensic) samples in cellphone images [36–39]. Parameters used in final algorithm:
a Minimum standard deviation for the Gaussian kernel was 3. b Maximum standard deviation for the Gaussian kernel was 15. c The threshold for scale space maxima was 0.12.
(2) In the second step (Fig. 1B(2)), epithelial cells were excluded by adding a pixel sum threshold, which excluded epithelial cells in the immediate region around a detected blob if its cell body covered a much larger area than a sperm cell would. We found that the blob detection in the previous step did not on its own result in adequate specificity for sperm detection, returning some false positives in the case of epithelial cells in the image that were not removed in the binarization. Although epithelial cells are generally much larger than sperm heads and significantly more heterogeneous, both of which are properties which should be excluded in blob detection, there are some instances of false positives. To exclude them, we added this step to the image processing, which significantly
improved specificity. Parameters used:
a Local region of interest (ROI) around each detected blob: 100 by 100 pixels.
b Binary thresholding of the ROI with threshold 150.
c Blob was passed to the next step if the sum of pixels in the post-threshold ROI exceeded 9524.
(3) In the third step (Fig. 1B (3)), we included a minimum distance parameter to reduce overcounting of sperm cells in the same loca-tion as the algorithm looped through the image in multiple itera-tions. This helped to improve the quantification accuracy of the algorithm.
a Circles of a fixed radius were assigned to each of the locations (screened from previous step) on a blank copy of the image (no cells).
b Hough gradient transform from OpenCV was run on the above image, passed in with the radius parameters of the assigned cir-cles, and with a minimum distance threshold of 20 pixels. The output of this algorithm includes the original image (Fig. 3A), next to a copy of it overlaid with the algorithm-detected sperm (Fig. 3B), as well as a sperm count for that image. The user can compare these side-by-side to visually verify whether detected sperm heads are truly so, or if any are missed.
This sperm detection algorithm was tested over 57 samples in total, including 26 samples that contained sperm (labelled “positive”) and 31 that did not contain sperm (labelled “negative”). This algorithm de-monstrated 100.0% sensitivity and 93.5% specificity against manual counting, as shown in the confusion matrix depicted inFig. 3C (there were two instances of false positives). These two examples of false positives (which can be seen in Fig. S12) appeared to both be small debris with a very similar size to sperm. Further,Fig. 3D quantifies how well the resultant automated sperm count correlates to the manual
Fig. 4. Heatmaps showing distributions of sperm cells
on a surface chemistry-enhanced chip, tiled images taken on a microscope before and after washing. Sperm cells were detected using a Hough circle trans-form-based algorithm, from fluorescence images of DAPI-stained sperm cells in our chip. (A) Chip pre-washing, with 18,141 sperm cells detected. Cells are more broadly distributed. (B) Chip pre-washing, with 16,414 sperm cells detected. Cells are clustered into regions of higher concentration. Calculated sperm re-tention on-chip with surface chemistry after washing: 90.1%.
count, with a coefficient of correlation of 0.709;Fig. 3E shows Blan-d–Altman plot and a difference of means of 0.39. There is slight over-counting (especially when sperm heads are clustered very close to-gether). Based on this sample image set, it showed reliable classification between images that contained or did not contain sperm. It would therefore be a suitable candidate to be developed into a screening test to guide sample selection for DNA analysis, due to its excellent sensi-tivity and very high specificity.
3.4. Microfluidic chip and surface chemistry for epithelial cell separation
To develop strategies to distinguish sperm from non-sperm objects in a swab sample, we prepared mock samples by mixing raw, unwashed semen samples with fresh buccal swabs taken on flocked swabs. This mixture contained epithelial cells, sperm cells, debris, and possibly other cell types that are naturally present in these samples. To add to our image processing algorithms, we designed our microfluidic chip to wash away the epithelial cells and keep the bound sperm on surface. To this end, we utilized an earlier technique developed in our lab to se-lectively remove non-sperm cells and debris from a microfluidic channel as characterized thoroughly in our previous publication [40]. This method adds chemical treatment to the same microfluidic chip we use for sample loading and sperm visualization and capture. The che-mical treatment achieves selective sperm binding by borrowing a mo-lecule from nature: Sialyl-LewisX, or SLeX, an oligosaccharide sequence on the zona pellucida of an egg [41]. This molecule, when applied to our microfluidic chip surface, exhibits strong sperm binding, allowing them to be retained when the chips are gently washed, while sig-nificantly reducing the epithelial cell fraction. This previous work showed a 70–92% sperm capture efficiency [40]. We show inFig. 4that 90.1% of sperm cells are retained on the channel after the wash step indicating that sperm were not significantly lost as a result of washing from the channels.Fig. 4includes a tiled microscope image of the whole chip with sperm binding, before and after washing (to remove epithelial cells), and the quantification results of each. This shows that the dis-tribution of sperm slightly shifts, but that overall sperm retention is high. The non-sperm fraction that is washed out can be retained for further professing and genotyping since there is no lysis or damage to either fraction of the sample.
3.5. Image processing algorithms to detect sperm in cellphone images with sperm cells only
In the case of sperm-positive vs. sperm-negative classification on chips with sperm cells only and minimal epithelial cell matter and debris in the background due to selective sperm binding and epithelial cell washing, the sperm detection algorithm (Algorithm C) leads to excellent (95.9%) detection accuracy and better quantification of sperm amounts (the coefficient of correlation with sperm counting in this case is 0.823, as shown inFig. 5D). In this case, there is slight undercounting in cases of sperm clustering (the difference of means was −0.33 as seen in the Bland–Altman plot inFig. 5E), but the coefficient of correlation is still improved compared to images with a mixture of sperm and epi-thelial cells. Most importantly, sensitivity (100%), specificity (93.5%), and overall accuracy is excellent. The inherently better signal to noise ratio in these images allows for more accurate quantification to aid the user in guiding further analysis decisions. While we obtained better correlation of quantification with one of our alternative strategies based on the Hough gradient transform, it had worse performance when en-countering epithelial cells. Although we are able to remove the majority of epithelial cells with the previously described wash step, we cannot assume 100 % removal so we opted for the previously described algo-rithm that is more selective in the face of epithelial cells. As a con-firmatory test for semen that can be followed up with visual examina-tion if needed, it is important to prioritize better sensitivity and specificity over quantification correlation.
4. Discussion
We have shown two strategies to accurately count sperm in the presence of epithelial cells. First, we run a python-based algorithm to use Laplacian of Gaussian and/or Hough gradient transform to selec-tively detect sperm cells, with additional methods to increase specificity in the presence of non-sperm objects (which can include a variety of other cell types and debris, but in this case we focused on epithelial cells from a buccal swab, and incidental debris). However, the presence of other cells can add errors and reduce quantification accuracy. Thus, our second (additional) strategy is to selectively bind sperm on the surface of the channels, and to wash away all other objects, leveraging the specificity enabled by the SLeX surface chemistry as we reported earlier in detail [40]. Even when there are some epithelial cells left behind that are nonspecifically bound, our image processing algorithm allows us to detect sperm with higher quantification accuracy in addi-tion to excellent sensitivity and specificity.
While cellphone images have poorer resolution and more spherical aberration than higher-quality microscope images, the combination of the objective lens and aspheric lens allows us to overcome some of these limitations when enhanced with our image processing algorithm. Thus, we were able to produce good quality images at magnification, with the user advantages that come with a cellphone-based platform. Using this, we can detect sperm very reliably as shown inFigs. 3 and 5, with the significant advantages of our platform being portable, inexpensive, and having an intuitive, easy-to-use interface that would require minimal training for an operator (e.g. SANE) to incorporate into their practice. Further, the system is versatile as the 3D printed phone holder design can be adjusted to fit different smartphone models for different users.
We tested the code for mainly brightfield images to minimize the operational requirements for the user around fluorescent imaging on the cell phone. To add further specificity after selective image re-cognition and physical removal of the majority of epithelial cells, we could potentially add a third additional step: we can stain the cells with DAPI to identify locations of cells, as we demonstrated in microscope imaging inFig. 2, in concordance with the bright field image processing as described above. This would aid in the detection of an infrequently occurring sperm cell if it is completely covered by an overlapping, larger epithelial cell. One limitation of this is that DAPI is not a sperm-specific stain, although stained sperm heads and epithelial cell nuclei have different and distinguishable sizes as we showed. An alternative solution can be to increase sperm specificity by using stains such as the well-validated commercial product SPERM HY-LITER kit which uses a sperm-specific fluorescent antibody in addition to DAPI, instead of DAPI only [42–44]. By adapting our cellphone system to include fluorescence imaging capabilities, these stains can be used to add fur-ther confirmation. Ofur-ther than fluorescence, we can explore depletion of epithelial cells before or after binding of sperm to the SLeX-coated surface using chemical or enzymatic methods such as lysis using pro-teinase K or hydroxide/EDTA-based treatment [45]. This integrated platform eventually could be used in a crime laboratory environment and possibly with further development of the chip and the sample processing workflow, in a hospital or sexual assault treatment center facility by a trained SANE (Fig. 1C). The algorithmic detection can be used as an aid to streamline sample analysis for users with high workloads such as for the problems we are targeting, while still al-lowing direct visual examination of the sample for expert confirmation. The intended implementation of this test only uses one-tenth of the collected evidence sample to perform this screening, so that the prac-titioner can direct the remaining aliquot of a positive sample for further testing using standard molecular methods for detection of STR’s, Y-STRs, etc. This can offer a viable solution in hospital settings where microscopic examination or other sperm quantification methods cannot easily be implemented due to lack of resources, space, appropriate training, or in crime laboratories where long periods of time are needed to sufficiently examine a low/no sperm count sample. In the future, we
will conduct a validation study of our microchip integrated with cell phone imaging system and correlate with currently used methods in forensic laboratories to create a next generation system to accelerate the sample screening process for forensic investigations.
Credit author statement
Shreya Deshmukh: Conceptualization, Methodology, Software, Validation, Formal analysis, Investigation, Writing – Original Draft, Writing – Review & Editing, Visualization, Funding acquisition
Fatih Inci: Conceptualization, Methodology, Validation, Resources, Writing – Review & Editing, Supervision, Project administration, Funding acquisition
Merve G Karaaslan: Conceptualization, Methodology, Investigation, Resources
Mehmet Giray Ogut: Software, Formal analysis Derek Duncan: Conceptualization, Funding acquisition
Leonard Klevan: Conceptualization, Validation, Resources, Writing – Review & Editing, Supervision, Project administration, Funding ac-quisition
George Duncan: Conceptualization, Validation, Resources, Writing – Review & Editing, Supervision, Project administration, Funding acqui-sition
Utkan Demirci: Conceptualization, Methodology, Validation, Resources, Writing – Review & Editing, Supervision, Project adminis-tration, Funding acquisition.
Competing interests
Prof. Utkan Demirci (UD) is a founder of and has an equity interest in: (i) DxNow Inc., a company that is developing microfluidic IVF tools and imaging technologies for point‐of‐care diagnostic solutions, (ii) Koek Biotech, a company that is developing microfluidic technologies for clinical solutions, (iii) Levitas Inc., a company focusing on
developing microfluidic products for sorting rare cells from liquid biopsy in cancer and other diseases, and (iv) Hillel Inc., a company bringing microfluidic cell phone tools to home settings. UD’s interests were viewed and managed in accordance with the conflict of interest policies.
Acknowledgements
We acknowledge the support from the following grant: National Institute of Justice Award#2017-NE-BX-0004 (United States). M.G.K. would like to thank the BAMM Lab, the Department of Radiology, Stanford University School of Medicine, for her visit, where this work was performed, as well as the Scientific and Technical Research Council of Turkey (TUBITAK) for their support (2219-International Postdoctoral research fellowship program). We would also like to thank the Stanford Children’s Hospital for their assistance with acquiring samples. Appendix A. Supplementary data
Supplementary material related to this article can be found, in the online version, at doi:https://doi.org/10.1016/j.fsigen.2020.102313. References
[1] WHO, Global and regional estimates of violence against women, (2013). [2] R. Morgan, B. Oudekerk, Criminal victimization, 2018, (2019), pp. 1–37. [3] N. Ritter, Down the road: testing evidence in sexual assaults, Natl. Inst. Justice
(2016).
[4] R. Campbell, H. Feeney, G. Fehler-Cabral, J. Shaw, S. Horsford, The national pro-blem of untested sexual assault kits (SAKs): scope, causes, and future directions for research, policy, and practice, Trauma Violence Abus. 18 (4) (2017) 363–376, https://doi.org/10.1177/1524838015622436.
[5] M. Nelson, R. Chase, L. DePalma, Making sense of DNA Backlogs, 2012, (2013). [6] Karl M. McDonald, DNA forensic testing and use of DNA rape kits in cases of rape
and sexual assault, Forensic Magazine (2015).
[7] K. Virkler, I.K. Lednev, Analysis of body fluids for forensic purposes: From la-boratory testing to non-destructive rapid confirmatory identification at a crime
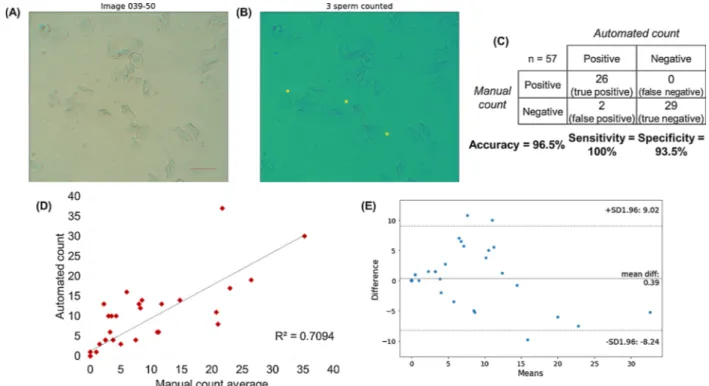
Fig. 5. Images of sperm cells on cellphone imaging prototype. Scale bar = 100 μm, magnification = 10×. (A) Raw brightfield image. (B) Post-analysis image:
Original image overlaid with circles identified using OpenCV Hough Transform and local ROI pixel sum threshold. (C) Confusion matrix for sperm detection in various cellphone images containing no cells, epithelial cells only, and a mixture of sperm and epithelial cells. “Positives” are sperm-containing images, while “negatives” are images without sperm (but may contain epithelial cells). Total number of images tested = 49. (D) Correlation of automated counts to average of four manual counters. The coefficient of correlation (R) is 0.823. (E) Bland–Altman plot comparing the results of the automated count with the manual count. The mean difference between manual and automated sperm counts is −0.33.
scene, Forensic Sci. Int. 188 (1–3) (2009) 1–17,https://doi.org/10.1016/j.forsciint. 2009.02.013.
[8] S.P. Balk, Y.-J. Ko, G.J. Bubley, Biology of prostate-specific antigen, J. Clin. Oncol. 21 (2) (2003) 383–391,https://doi.org/10.1200/JCO.2003.02.083.
[9] H.A. Frazier, P.A. Humphrey, J.L. Burchette, D.F. Paulson, Immunoreactive pro-static specific antigen in male periurethral glands, J. Urol. 147 (1) (1992) 246–248. [10] J. Iwakiri, K. Granbois, N. Wehner, H.C. Graves, T. Stamey, An analysis of urinary prostate specific antigen before and after radical prostatectomy: evidence for se-cretion of prostate specific antigen by the periurethral glands, J. Urol. 149 (4) (1993) 783–786.
[11] J.J. Pollen, A. Dreilinger, Immunohistochemical identification of prostatic acid phosphatase and prostate specific antigen in female periurethral glands, Urology 23 (3) (1984) 303–304.
[12] J. Breul, U. Pickl, R. Hartung, Prostate-specific antigen in urine, Eur. Urol. 26 (1) (1994) 18–21.
[13] H.W. Kim, Y.H. Ko, S.H. Kang, J.G. Lee, Predictive factors for prostate cancer in biopsy of patients with prostate-specific antigen levels equal to or less than 4 ng/ml, Korean J. Urol. 52 (3) (2011) 166,https://doi.org/10.4111/kju.2011.52.3.166. [14] P. Lunetta, H. Sippel, Positive prostate-specific antigen (PSA) reaction in
post-mortem rectal swabs: a cautionary note, J. Forensic Leg. Med. 16 (7) (2009) 397–399,https://doi.org/10.1016/j.jflm.2009.04.002.
[15] M. Papotti, C. Paties, V. Peveri, L. Moscuzza, G. Bussolati, Immunocytochemical detection of prostate-specific antigen (PSA) in skin adnexal and breast tissues and tumors, Basic Appl. Histochem. 33 (1) (1989) 25–29.
[16] H. Yu, E.P. Diamandis, D.J. Sutherland, Immunoreactive prostate-specific antigen levels in female and male breast tumors and its association with steroid hormone receptors and patient age, Clin. Biochem. 27 (2) (1994) 75–79.
[17] T. Kuiri-Hänninen, et al., Increased activity of the hypothalamic-pituitary-Testicular Axis in infancy results in increased androgen action in premature boys, J. Clin. Endocrinol. Metab. 96 (1) (2011) 98–105,https://doi.org/10.1210/jc.2010-1359. [18] J.P. Allery, N. Telmon, R. Mieusset, A. Blanc, D. Rougé, Cytological detection of
spermatozoa: comparison of three staining methods, J. Forensic Sci. 46 (2) (2001) 349–351.
[19] M.A. Alyassin, et al., Rapid automated cell quantification on HIV microfluidic de-vices, Lab Chip 9 (23) (2009) 3364–3369,https://doi.org/10.1039/b911882a. [20] U.A. Gurkan, et al., Miniaturized lensless imaging systems for cell and
micro-organism visualization in point-of-care testing, Biotechnol. J. 6 (2) (2011) 138–149, https://doi.org/10.1002/biot.201000427.
[21] Y.S. Song, et al., Vitrification and levitation of a liquid droplet on liquid nitrogen, Proc. Natl. Acad. Sci. U. S. A. 107 (10) (2010) 4596–4600,https://doi.org/10. 1073/pnas.0914059107.
[22] S. Wang, M. Esfahani, U.A. Gurkan, F. Inci, D.R. Kuritzkes, U. Demirci, Efficient on-chip isolation of HIV subtypes, Lab Chip 12 (8) (2012) 1508,https://doi.org/10. 1039/c2lc20706k.
[23] S. Wang, et al., Development of a microfluidic system for measuring HIV-1 viral load, Proc. SPIE 7666 (2010) 76661H,https://doi.org/10.1117/12.853132. [24] S. Wang, F. Xu, U. Demirci, Advances in developing HIV-1 viral load assays for
resource-limited settings, Biotechnol. Adv. 28 (6) (2010) 770–781,https://doi.org/ 10.1016/j.biotechadv.2010.06.004.
[25] F. Inci, et al., Nanoplasmonic quantitative detection of intact viruses from un-processed whole blood, ACS Nano 7 (6) (2013) 4733–4745,https://doi.org/10. 1021/nn3036232.
[26] Y.G. Kim, S. Moon, D.R. Kuritzkes, U. Demirci, Quantum dot-based HIV capture and imaging in a microfluidic channel, Biosens. Bioelectron. 25 (1) (2009) 253–258, https://doi.org/10.1016/j.bios.2009.06.023.
[27] W.G. Lee, Y.-G. Kim, B.G. Chung, U. Demirci, A. Khademhosseini, Nano/ Microfluidics for diagnosis of infectious diseases in developing countries, Adv. Drug Deliv. Rev. 62 (4) (2010) 449–457,https://doi.org/10.1016/j.addr.2009.11.016. [28] S.J. Moon, et al., Enumeration of CD4+ T-cells using a portable microchip count
platform in tanzanian HIV-infected patients, PLoS One 6 (7) (2011),https://doi. org/10.1371/journal.pone.0021409.
[29] S. Moon, et al., Integrating microfluidics and lensless imaging for point-of-care testing, Biosens. Bioelectron. 24 (11) (2009) 3208–3214,https://doi.org/10.1016/ j.bios.2009.03.037.
[30] A. Ozcan, U. Demirci, Ultra wide-field lens-free monitoring of cells on-chip, Lab Chip 8 (1) (2008) 98–106,https://doi.org/10.1039/B713695A.
[31] F. Yi, J. Huang, L. Yang, Y. Xie, G. Xiao, Automatic extraction of cell nuclei from H& E-stained histopathological images, J. Med. Imaging 4 (2) (2017),https://doi.org/ 10.1117/1.jmi.4.2.027502.
[32] I. Muhimmah, R. Kurniawan, Indrayanti, Automated cervical cell nuclei segmentation using morphological operation and watershed transformation, Proceeding -2012 IEEE International Conference on Computational Intelligence and Cybernetics, CyberneticsCom 2012, IEEE, 2012, pp. 163–167.
[33] Y.L. Huang, C.W. Chung, T.Y. Hsieh, Y.L. Jao, Outline detection for the HEp-2 cell in indirect immunofluorescence images using watershed segmentation, Proceedings - IEEE International Conference on Sensor Networks, Ubiquitous, and Trustworthy Computing, IEEE, 2008, pp. 423–427.
[34] H.K. Yuen, J. Princen, J. Dlingworth, J. Kittler, A comparative study of hough transform methods for circle finding, Proc. 5th Alvey Vision Conf (2013) 29.1–29.6, https://doi.org/10.5244/c.3.29.
[35] J. Illingworth, J. Kittler, The adaptive hough transform, IEEE Trans. Pattern Anal. Mach. Intell. 9 (5) (1987) 690–698,https://doi.org/10.1109/TPAMI.1987. 4767964.
[36] H. Xu, C. Lu, R. Berendt, N. Jha, M. Mandal, Automatic nuclei detection based on generalized laplacian of gaussian filters, IEEE J. Biomed. Heal. Informatics 21 (3) (2017) 826–837,https://doi.org/10.1109/JBHI.2016.2544245.
[37] J. Byun, M.R. Verardo, B. Sumengen, G.P. Lewis, B.S. Manjunath, S.K. Fisher, Automated tool for the detection of cell nuclei in digital microscopic images: Application to retinal images, Mol. Vis. 12 (August) (2006) 949–960.
[38] H. Kong, H.C. Akakin, S.E. Sarma, A generalized laplacian of gaussian filter for blob detection and its applications, IEEE Trans. Cybern. 43 (6) (2013) 1719–1733, https://doi.org/10.1109/TSMCB.2012.2228639.
[39] Q. Zhan, Y. Liang, Y. Cai, Y. Xiao, Pattern detection in airborne LiDAR data using Laplacian of Gaussian filter, Geo-Spatial Inf. Sci. 14 (3) (2011) 184–189,https:// doi.org/10.1007/s11806-011-0540-x.
[40] F. Inci, M.O. Ozen, Y. Saylan, M. Miansari, D. Cimen, R. Dhara, T. Chinnasamy, M. Yuksekkaya, C. Filippini, D.K. Kumar, S. Calamak, Y. Yesil, N.G. Durmus, G. Duncan, L. Klevan, U. Demirci, A novel on-chip method for differential extraction of sperm in forensic cases, Adv. Sci. 5 (9) (2018),https://doi.org/10.1002/advs. 201800121.
[41] P.C. Pang, P.C.N. Chiu, C.L. Lee, L.Y. Chang, M. Panico, H.R. Morris, S.M. Haslam, K.H. Khoo, G.F. Clark, W.S.B. Yeung, A. Dell, Human sperm binding is mediated by the Sialyl-lewisx Oligosaccharide on the zona pellucida, Science 333 (6050) (2011) 1761–1764,https://doi.org/10.1126/science.1207438.
[42] A. De Moors, T. Georgalis, G. Armstrong, J. Modler, C.J. Frégeau, Sperm hy-liter™: An effective tool for the detection of spermatozoa in sexual assault exhibits, Forensic Sci. Int. Genet. 7 (3) (2013) 367–379,https://doi.org/10.1016/j.fsigen. 2013.02.011.
[43] C.G. Westring, M. Wiuf, S.J. Nielsen, et al., Sperm HY-LITER™ for the identification of spermatozoa from sexual assault evidence, Forensic Sci. Int. Genet. 12 (2014) 161–167,https://doi.org/10.1016/j.fsigen.2014.06.003.
[44] Y.S. Ping, X.L.S. Chan, S.K. Goh, C.K.C. Syn, Optimization of spermatozoa detection using immunofluorescent staining and laser micro-dissection, Forensic Sci. Int. 255 (2015) 72–79,https://doi.org/10.1016/j.forsciint.2015.07.010.
[45] C.M. Hennekens, E.S. Cooper, R.W. Cotton, C.M. Grgicak, The effects of differential extraction conditions on the premature lysis of spermatozoa, J. Forensic Sci. 58 (3) (2013) 744–752,https://doi.org/10.1111/1556-4029.12098.