ISSN 0971-2070
Comparison of different vegetation measurement methods for determination of range land
conditions
Erdal Cacan1* ,Kagan Kokten2 and Senol Yildiz3
1 Department of Crop and Animal Production, Bingol University, Bingol, Turkey 2 Department of Field Crops, Bingol University, Bingol, Turkey
3 Department of Wildlife Ecology and Management, Abant Izzet Baysal University, Bolu, Turkey *Corresponding author e-mail:[email protected]
Received: 2nd Feburary, 2016 Accepted: 3rd November, 2016
Abstract
The study was carried out to determine range condition by identifying plant species and comparing different measurement methods in the experimental field of Bingol University for two years. Vegetation measurement, plant coverage area, botanic composition and quality degree were estimated by using transect, loop and point frame methods. Plant covered area was determined as 85.2% by point frame method, 91.2% by loop method and 83.1% by transect method. In respect of botanical composition; grasses, legumes and other family plants were found to be 69.8%, 19.8% and 10.4% by point frame method; 67.1%, 21.5% and 11.4%; by loop method and 59.5%, 32.3% and 8.2% by transect method, respectively. Quality degrees was found as 3.85 by transect method; 3.02 by loop method and 3.07 by point frame method and the range was ranked as ‘poor range’ by each of the three methods used. Consequently, of the methods used, the point frame method and loop method were found producing similar results.
Keywords: Botanical composition, Methods, Rangeland conditions, Vegetation measurement
Introduction
Having been over grazed before maturation, our pastures have lost most of the natural vegetation cover and ultimately leaving their places to low quality, low yield plants that are in the form of weeds (Bakir and Acikgoz, 1976; Aydin and Uzun, 2002; Turk et al., 2003). When the plant coverage in a rangeland is around 16%, heavy erosion occurs. However if the plant coverage is 40% , erosion is reduced to 54% (Buyukburc, 1999). Studies have been made to establish methods for examining plant communities of grasslands and rangelands, situated in various ecologies of the country. This will provide great benefits to fill the knowledge gaps in the area as well as to closely recognize our natural resources (Tosun, 1968).
Measurements and evaluation of vegetations in rangelands are made for two main reasons. First is to collect information about the vegetation quality and quantity of some rangelands that are not well-known. Second is to study the rangeland management and improvement methods along with their influences on vegetations (Cerit ve Altin, 1999). The most frequently used methods are quadrate, coverage scales, transect, loop and point-frame (Cakmakci et al., 2002). These methods are being used in many parts of the world (Whitman and Siggeirsson, 1954; Johnston, 1956; Kinsinger et al., 1960; Hanley, 1978; Floyd and Anderson, 1987; Singh et al., 2010; Piri et al., 2015) as well as in Turkey (Kendir, 1995; Cakmakci et al., 2002; Turk et al., 2003; Babalik, 2004; Bilgen and Ozyigit, 2007). The objectives of this study were to estimate rangeland’s coverage areas and quality degree by using three different measurement methods and to compare their efficiencies.
Materials and Methods
The study was conducted on range vegetation in the experimental field of Bingol University during late May of 2014 and 2015. Grasses were nearly mature at this time and over-all condition was some what better than average. The experimental area had a size of about 10 da with native range vegetation. The study area had an altitude of approximately 1.150 m above the sea level with an average slope of 5-10%. The long-term (1990-2015) meteorological data of research area reflected monthly average temperature of 12.13 ºC with total precipitation of 950.8 mm and 56.9% relative humidity. During study period (2014-2015), the temperature (13.1 ºC) and the relative humidity (54.2%) were close to the long-term average. However, the precipitation was lower (832.6 mm) than the long-term average. The soil samples (0-30 cm depth) from ten different points were taken. Soils of the experimental area had a loamy texture, being slightly
acidic (pH 6.37) and unsalted (0.0066%). It was low in calcium carbonate (0.15%) and organic matter (1.26%) and medium in phosphorus (79.1 kg ha-1 P
2O5) and potassium (244.5 kg ha-1 K
2O).
For vegetation measurements, point frame, loop and transect methods were used. Each measurement was made at two different points and in the last week of May during the two study years. At two different locations and in the north, east, south and west direction at two different points each for loop and point frame methods, 4 lines were drawn. From each line, 100 observations were made making a total of 800 observation points. In the transect methods, transects bar in two different locations and in the north, east, south and west direction of every two different point were used in the observations, making a total of 800 points. Identification of plant species was performed as per Serin et al. (2008).
Each line, in vegetation measurement made by the all three methods, was made of 100 observations. In the four lines of both plots, the average of coverage value detected for a plant group was calculated as the average rate of the plant group. The plant species, detected at each line in vegetation measurements, were divided into three groups as grasses, legumes and other family plants. The value of the botanical composition of plant groups (ratio of the plant covered area), coverage rates determined for plant groups at each line by comparing to total coverage plant rate of that line was obtained in percentage. Quality degree was calculated by multiplying the value number of plant species in the botanical composition to percent shares in the vegetation of these plants (Gokkus et al., 2009). Range condition was
determined according to the method developed by De Vries et al. (1951). Identified method for range condition was used by many researchers earlier (Bakir, 1970; Gokkus and Altin, 1986; Gokkus et al., 1993, Koc and Gokkus, 1994) in Turkey. Data, coverage plant area and botanical composition to the coverage area, were analyzed by a randomized complete block design by using JUMP statistical package program (Kalayci, 2005). Data of coverage plant area and botanical composition were transformed before applying the variance analysis. LSD test was used to evaluate the significance of differences among the averages.
Results and Discussion
Plant coverage area : The loop method measured the
highest (Table 1) plant covered area ratio (91.2%), followed by point frame method (85.2%) and transects method (83.1%). Total plant covered area was high because of good amount of annual rainfall (900 mm) in Bingol.
Grass and other family plant covered area ratios, in terms of the highest values were measured again by the loop method (59.6% and 10.3%, respectively), followed by point frame method (58.8% and 7.9%, respectively) that was statistically located in the same group. The lowest grass and other family plant covered area values were measured by the transect method (44.9% and 6.9%, respectively), whereas, legume covered area value was highest (31.3%) by the transect method. Our findings were in agreement with those of Kinsenger et al. (1960), Turk
et al., (2003) and Bilgen and Ozyigit (2007), wherein the
loop method higher values were recorded.
2014 2015 Mean 2014 2015 Mean 2014 2015 Mean 2014 2015 Mean
82.6 99.8 91.2 71.5 47.8 59.6 1.9 40.6 21.3 9.3 11.4 10.3 Loop (66.1)b (88.6)a (77.3)A (58.2)a (43.7)b (51.0)A (7.1)c (39.3)b (23.2)B (16.0)ab (18.3)a (17.2)A 71.3 99.1 85.2 57.6 59.9 58.8 3.9 33.3 18.6 9.8 6.0 7.9 (57.9)c (86.3)a (72.1)B (49.7)ab (51.0)ab (50.3)A (10.8)c (34.5)b (22.7)B (17.2)ab (13.6)ab (15.4) AB 66.4 99.9 83.1 55.3 34.6 44.9 3.0 59.5 31.3 8.1 5.8 6.9 (54.8)c (89.3)a (72.1)B (48.1)ab (35.3)c (41.7)B (8.8)c (50.6)a (29.7)A (10.2)b (10.2)b (10.2)B Table 1. Proportions (%) of total plant covered area, grass covered area, legume covered area and other family plant-covered area
Grass covered area Legume covered area Other family covered area
Total plant covered area
Point frame
Transect
The results shown by different letters are significant at p<0.05 level Values in parenthesis are angular transformed values.
Botanical composition by plant covered area : The
percentage of legumes and other plant families in the total plant covered area at two different sites representing rangeland area are given in Table 2. The areas covered by plants in different aspect showed that there was no statistical differences in terms of grass proportions. Highest plant coverage area was measured by the transect method for legumes (32.3%), whereas loop and point frame methods produced lower values (21.5% and 19.8% respectively). The highest value of plant-covered areas for other families was 11.4% in the loop method followed by point frame method. The lowest value of plant covered area for other families group was by the transect method with a proportion of 8.2%. The dominant species(Table 3) determined by the point frame method was Hordeum murinum (34.34%) followed by
Taeniatherum caput-medusae (23.92%) and Trifolium repens (12.55%). By the loop method, the dominant
species were Hordeum murinum (33.38 %),
Taeniatherum caput-medusae (19.74%) and Trifolium repens (13.98%). Although all the three methods found
the same species for the dominant ones, loop and the point frame methods produced similar results.
Turk et al. (2003) and Wise and Ozyigit (2007) stated that the differences among the proportions of species composition measured by different methods could be attributed to the variability of magnitudes and structures of the area measured by each of these methods. The measurements performed by the transect method appeared more different generally, due to the continuous measurements along a 100 cm transect. Tekeli and Mengul (1991) reported that grasses (59.6%), legumes
(16.4%) and other families (24.0%) also contributed to the botanical composition in K e ºan Kalatepe region. Tuncel (1994) found that the botanical composition in a natural rangeland of the village of Ahi in Edirne was comprised of 33.49% of grasses, 8.66% of legumes and 57.85% of other family plants.
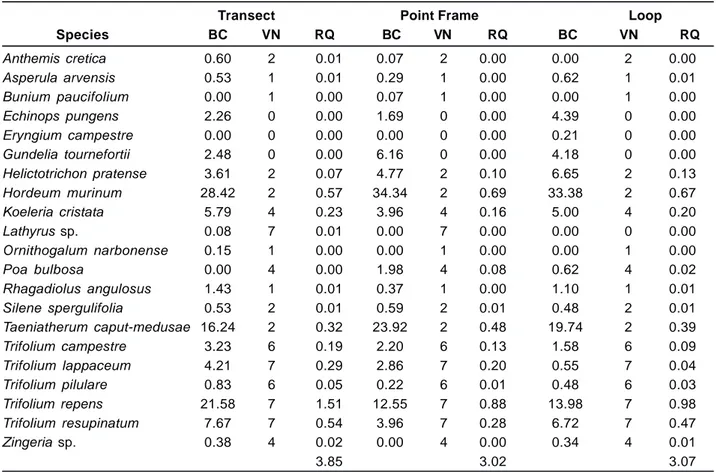
Rangeland quality degree : Botanical composition of the
species, values and the rangeland quality degrees for the two rangeland clusters measured by three different methods are given in Table 3. The pasture quality degree was estimated as 3.85 according to transect method. Within this value, the portion of legumes, grasses and other families were 2.59, 1.12 and 0.14, respectively. The quality degree value was found 3.02 by the Loop method, which comprised of legumes, grasses and other families by the values 1.61, 1.28 and 0.13, respectively. By point frame method, quality grade was estimated to be 3.07; and legume family was found to be the highest contributor to the quality degree with a value of 1.50.
The quality degree values ranged between 3.02-3.85 by different methods of measurements and the rangeland was classified as ‘poor rangeland’ according to the system established by De Vries et al. (1951). Turk et al. (2003) reported similar results and pasture quality grades ranged between 4.78 and 5.72, ranking as ‘poor rangeland’.
Conclusion
Study results revealed that among the three measurement methods, loop and point frame methods produced similar outcomes. Across the pasture area, plant covered area Table 2. The proportion (%) of grass, legumes and other families in botanical composition with respect to plant covered area 86.4 47.9 67.1 2.3 40.7 21.5 11.3 11.4 11.4 (69.4)a (43.8)b (56.6)c (7.8)c (39.4)b (23.6)B (17.8)ab (18.3)ab (18.1) A 79.2 60.5 69.8 6.0 33.5 19.8 14.8 6.1 10.4 (64.1)a (51.4)b (57.7) (13.3)c (34.7)b (24.0)B (21.2)a (13.7)ab (17.4)AB 84.4 34.7 59.5 5.0 59.5 32.3 10.7 5.8 8.2 (69.0)a (35.4)c (52.2) (11.3)c (50.6)a (30.9)A (12.1)ab (10.2)b (11.2)B Grass covered area Legume covered area Other family covered area 2014 2015 Mean 2014 2015 Mean 2014 2015 Mean
Loop
Point frame
Transect
The results shown by different letters are significant at p<0.05 level Values in parenthesis are angular transformed values.
ranged between 83.1-91.2%; due to the higher portion of the grasses in the plant covered area (44.9-59.6%) and might be attributed to cattle grazing, in general. Controlled grazing and preservation actions would provide important progress in the improvement of rangeland condition.The method to be used was again dependent on the time and labor availabilities. In many respects loop method was appropriate for the rangeland types such as in this present study. But the point frame method was faster than other methods and can be easily used when the plant covered area is not important. The transect methods requires more time and labor force, and due to the nature of present vegetation might not be preferred. The present study did not contradict with the previous studies made in the past on rangeland elsewhere. Especially, in grass based rangelands our study is in great agreement with the other studies on using loop method over the other methods and produced convincing results for future study planners in adopting this method.
References
Aydin, I. and F. Uzun. 2002. Meadow-Pasture Management
and Improvement. Ondokuz Mayýs University,
Textbook of Agriculture Faculty, No: 9, Samsun.
Babalik, A. A. 2004. Surface cover measurement methods in meadows and ranges. Süleyman Demirel
University, Journal Faculty of Forestry Series: A,
Number: 1, 50-72.
Bakir, Ö. and E. Acikgoz. 1976. Current status of forage crops, pastures and rangeland agriculture in our country and improvement possibilities in this research. Ankara Grassland and Animal Science
Research Institute Issue No. 61. (In Turkish)
Bakir, Ö. 1970. Comparison of some important methods used in the vegetation survey and measurement.
Ankara University Faculty of Agriculture Yearbook.
19: 550-579. (In Turkish)
Bilgen, M. and Y. Ozyigit. 2007. Comparison of vegetation measurement methods. Akdeniz University,
Journal Faculty of Agriculture 20: 143-151.
Buyukburc, U. 1999. Soil-Water Conservation of Our
Pasture and Necessary Measures and Direction of Biodiversity Importance. Grassland Management
and Breeding, T.C. Ministry of Agriculture and Rural Affairs, General Directorate of Agricultural Production and Development, Department of Basin Grassland and Fodder Development, Ankara, 283-296. (In Turkish)
Table 3. Botanical composition of species, values and rangeland quality degrees
Anthemis cretica 0.60 2 0.01 0.07 2 0.00 0.00 2 0.00 Asperula arvensis 0.53 1 0.01 0.29 1 0.00 0.62 1 0.01 Bunium paucifolium 0.00 1 0.00 0.07 1 0.00 0.00 1 0.00 Echinops pungens 2.26 0 0.00 1.69 0 0.00 4.39 0 0.00 Eryngium campestre 0.00 0 0.00 0.00 0 0.00 0.21 0 0.00 Gundelia tournefortii 2.48 0 0.00 6.16 0 0.00 4.18 0 0.00 Helictotrichon pratense 3.61 2 0.07 4.77 2 0.10 6.65 2 0.13 Hordeum murinum 28.42 2 0.57 34.34 2 0.69 33.38 2 0.67 Koeleria cristata 5.79 4 0.23 3.96 4 0.16 5.00 4 0.20 Lathyrus sp. 0.08 7 0.01 0.00 7 0.00 0.00 0 0.00 Ornithogalum narbonense 0.15 1 0.00 0.00 1 0.00 0.00 1 0.00 Poa bulbosa 0.00 4 0.00 1.98 4 0.08 0.62 4 0.02 Rhagadiolus angulosus 1.43 1 0.01 0.37 1 0.00 1.10 1 0.01 Silene spergulifolia 0.53 2 0.01 0.59 2 0.01 0.48 2 0.01 Taeniatherum caput-medusae 16.24 2 0.32 23.92 2 0.48 19.74 2 0.39 Trifolium campestre 3.23 6 0.19 2.20 6 0.13 1.58 6 0.09 Trifolium lappaceum 4.21 7 0.29 2.86 7 0.20 0.55 7 0.04 Trifolium pilulare 0.83 6 0.05 0.22 6 0.01 0.48 6 0.03 Trifolium repens 21.58 7 1.51 12.55 7 0.88 13.98 7 0.98 Trifolium resupinatum 7.67 7 0.54 3.96 7 0.28 6.72 7 0.47 Zingeria sp. 0.38 4 0.02 0.00 4 0.00 0.34 4 0.01 3.85 3.02 3.07
BC: Botanical composition of the species, VN: Value numbers of the species, RQ: Rangeland quality degrees
Transect Point Frame Loop
Cerit, T. and M. Altin. 1999. Structure of vegetation ecology of Tekirdað region with natural pastures. Turkey
III. Field Crops Congress. 15-18 November 1999
Adana. (In Turkish)
Cakmakci, S., B. Aydinoglu, Y. Ozyigit, M. Arslan and M. Tetik. 2002. Application and comparison of three different measurement methods for plant-covered area on the Akpinar highland range of Kemer district of Burdur. Akdeniz University, Journal Faculty of
Agriculture 15: 1-7.
De Vries, D. M., T. A. De Boer and J. P. P. Dirver. 1951. Evaluation of grassland by botanical research in the Netherlands. In Proc. United National Sci.
Cons. on the Conservation and Utilization of Resources 6: 522-524.
Floyd, D. A. and J. E. Anderson. 1987. A Comparison of three methods for estimating plant cover. Journal
of Ecology 75:221-228.
Gokkus, A. and M. Altin. 1986. Research on hay and crude protein yields of pasture breeding methods with different botanical composition of applied. Journal
of Natural Turkish Agriculture and Forestry 10:
333-342 (In Turkish).
Gokkus, A., M. Avci, A. Aydin, A. Mermer and Z. Ulutas. 1993. The effects of elevation, slope and vector on the pasture vegetation. Eastern Anatolia
Agricultural Research Institute. Issue No: 13, 33p.,
Erzurum. (In Turkish)
Gokkus, A., A. Koc and B. Comakli. 2009. Pasture-Meadow
Practice Guide. Agriculture Faculty of Ataturk
University Publications No:142, p.49.
Hanley, T. A. 1978. A Comparison of the line-interception and quadrat estimation methods of determining shrub canopy coverage. Journal of Range
Management 31: 60-62.
Johnston, A. 1957. A Comparison of the line interception vertical point quadrat and loop methods as used in measuring basal area of grassland vegetation.
Canadian Journal Plant Science 37:34.
Kalayci, M. 2005. Use JUMP with Examples and Anova
Models for Agricultural Research. Anatolia
Agricultural Research Institute Directorate Publications No:21.
Kendir, H. 1995. Determination of Optimum Sampling
Intensities for the Main Range Vegetation Study Methods. Ankara University, Graduate School of
Natural and Applied Sciences, Department of Field Crops, Ph. D. Thesis, pp. 102.
Kinsinger, F. E., R. E. Eckert and P.O. Currie. 1960. A comparison of the line-interception, variable-plot and loop methods as used to measure shrub-crown cover. Journal of Range Management 13: 17-21.
Koc, A. and A. Gokkus. 1994. Botanical composition of range vegetation of Güzelyurt village and determining the most appropriate stubble height will be released with soil coverage. Turkish Journal
of Agriculture and Forestry 18: 495-500. (In Turkish)
Piri, S. H., C. M. A. Zare and H. Gholami. 2015. Predictive distribution models for determination of optimal threshold of plant species in central Iran. Range
Management and Agroforestry 36: 146-150.
Serin, Y., M. Tan, A. Koc and H. Zengin. 2008. Meadow and
Pasture Plants of Turkey. Agriculture and Rural Affair
Ministry, Publications General Directorate of Agricultural Production and Development. Ankara. (In Turkish)
Singh, J. P., P. N. Dwivedi, B. K. Trivedi and R. S. Chaurasia. 2010. Geomatics based concurrent evaluation of plantation drive in Jhansi District.
Range Management and Agroforestry 31: 59-65.
Tekeli, S. and Z. Mengul. 1991. Effects on botanical composition and yield of land and vector in forest pasture. Ege University Faculty of Agriculture. Turkey 2. Meadow and Forage Crops Congress 28-31 May, Ýzmir. (In Turkish)
Tosun, F. 1968. A study on the determination of optimal sample intensity in the study made with pasture vegetation transect method. Atatürk University
Faculty of Agriculture, Agricultural Research Institute Bulletin: 27, Erzurum. (In Turkish)
Tuncel, A. 1994. Important Weed Species and Their
Developmental Biology of Natural Pasture of Edirne Province. Tekirdag University of Science and
Technology Institute (Master Thesis), Edirne. (In Turkish)
Turk, M., G. Bayram, E. Budakli and N. Celik. 2003. Comparison on different methods and determination of pasture condition on a secondary pasture vegetation. Uludað University, Journal
Faculty of Agriculture 17: 65-77. (In Turkish)
Whitmann, W. C. and E. I. Siggerisson. 1954. Comparison of line interception and point contact methods in the analysis of mixed grass range vegetation.