El 51E~/IER Economics Letters 54 ( 1997 ) 93- I OI)
I"11
e c o n o m i c s
l e t t e r s
Catching-up and innovation in high- and low-income countries
Fatma Taskin*, Osman ZaimDepartment of Economics. Bilkent University. Bi/kent. Ankara 06533. Turkey
Received 25 July 1996; accepted 7 November 1996
Abstract
The study wilizes a variant of the Malmquist Prodt|ctivity Index computed by nonpantmetric linear programming techniques 1o empirically investigate the catching-up hypothesis f,,r a group of high- and low-income countries. The results show that the countries with low initial per capita income levels catcll up at a faster rate while countries with relatively high income depend more on technological progress tbr their productivity increases.
Keywords: Catcb.ing up; Innovation: Malmquist productivity change index
JEL chtssification: 047
1. Introduction
Studies that are devoted to explaining the differences between growth rates of countries are voluminous. The traditional neoclassical growth theory tbcused on the relationship between income distribution, capital accumulation and growth, but not on technology since it was, at the outset, assumed to be a public good. The opposing view is found in the technology gap approach to economic growth which conceives technology rather differently than neoclassical models. According to the authors in this tradition, though technology may have some public good characteristics, it is embedded in organizational structures which is rather difficult and costly to transfer from one setting to another. Hence, it is the technological differences which explain the differences in GDP per capita across countries. An important finding of empirical technological gap studies, i.e. the rapidly shrinking gap between labor productivity between the United States and other followers (developed countries), led to the catch-up debate. This study examines the issue of convergence among high- and low-income countries, using Malmquist productivity indexes calculated by a nonparametric linear programming method, and investigates the importance of the starting income level for the growth prospect of a country.
The methodology used in calculating the Malmquist productivity change index is briefly explained in Section 2. Section 3 reports the results of the empirical analysis, and finally, Section 4 presents our conclusions.
*Corresponding author. Fax: +90 312 266 4960; e-mail: [email protected]
0165-1765/97/$17.00 © 1997 Elsevier Science S.A. All rights reserved
94 F. Task#L O. Zahn / Ecom)mics Letters 54 (1997~ 93-1(K~
The catch-up hypothesis claims that poor countries tend to grow faster than rich countries. Through the international diffusion of knowledge and technology, low productivity and low-income countries have the opportunity to adopt the techniques of the leader and hence catch up with the higher productivity countries. Previous studies provide extensive empirical evidence of convergence of per capita income or productivity. Studies such as Ahromovitz (1986), Baumol (1986), and Maddison (1987) found evidence of convergence in per capita income levels for a group of industrialized countries and Baumoi and Wolff (1988) detected similar patterns for a larger group of countries including low-income countries. Barro (1991), Barro and Sala-i-Martin (1992), and Mankiw et al. (1992) have shown convergence of income conditional on steady-state characteristics. Their results were criticized by Quah (1993) as suffering from Galton's fallacy. Quah tbund empirical evidence for the opposing view of the divergence of the cross-country incomes. Sachs and Warner (1995) tied convergence to the choice of policies and predicted that only the income of countries with efficient economic and political policies will have a tendency to convergence,
i~wrick and Nguyen (1989) draw attention to the distinction between convergence of labor productivity versus TFP convergence and show that, in addition to the evidence on income convergence, the post-war data give strong support for TFP catch-up among OECD countries. Fare el al, (1994) provide an alternative exposition of convergence by examining the changes in efficiency obtained from the decomposition of the Malmquist productivity change index in 17 OECD countries for the 1979-88 period.
The purpose of this study is to empirically investigate the hypothesis of convergence in a sample of countries which includes both low- and high-income countries using a Malmquist index measure of productivity growth. This approach enables us to further decompose the productivity change into two component measures, namely efficiency change (diffusion) and technical change (innovation). This distinction is particularly important since most industrialized countries, it is argued, contribute to the advance in technological frontier through innovation, although not to the same extent. However, in the follower countries the diffusion of technology through adoption (imitation) and innovation will often be combined, It is the extent and scope of this diffusion, as was discussed in Fare et al. (1994), which will bring about convergence. The methodology that will be used involves developing a world production frontier based on the data from selected countries. An examination of the relative positions of each country with respect to the world frontier across time will reveal infornlation about the rate at which technology diffuses and how the catch-up process works. The countries that approach the frontier at a faster rate are catching-up with the most efficient ones. A measure of the shift in the world frontier along the input-output mix of the country will capture the rate of technical change in each country and hence show the impact of innovation on productivity growth. Furthermore, the importance of the starting per capita income level on the prospective rate of efficiency improvement, rate of innovation and hence productivity growth is investigated, t
*This paper improves on the previous empirical literature on convergence by considering the following two a,,;pects. First. this paper, unlike the majority of the previous empirical literature which analyzes the GDP growth rates or labor productivity, examines the convergence issue by measuring the efficiency change over time. The use of the Malmquist Change Index to measure the changes in productivity avoids the pitfalls of the total factor productivity analysis which confu~s lechnical change with the change in technical efficiency and differentiates explicitly between alternative sources of growth (i,e, growth due to increases in efficiency and growth due to technical change). The second improvement is that by extending the sample to include the LDCs it is possible to avoid the bias resulting from the use of a sample consisting of only a homogeneous ,set of countries, in a sample which includes both relatively poorer and rich countries it is possible to identify the growth momentum in different types of countries.
F. Taskin. O. Zaun I Ecommzics Letters 54 tl9971 93-100 95
2. M a l m q u i s t index o f productivity growth
In this study a Malmquist index introduced by Fare et al. (1994) is adopted to measure the productivity growth between high- and low-income countries. The essence of the method is to construct a best practice world frontier using data on inputs and outputs of all the countries in the sample and then compute the distance of individual countries from the world frontier. Central to the productivity index-!s the definition of the output distance functions which represent the technology at any given period in time. This function is defined on the production technology S (S =
((X,Y):X can produce Y)) as Dn(X,Y) = ~(O:(X,Y/O) E S). Here Y refers to the vector of outputs and X refers to the vector inputs. In words: the distance function measures the reciprocal of the maximal ray expansion of observed outputs, Y, given inputs, X. Usi,lg the output distance functions, Fate et al. (1994) define Malmquist output based productivity as:
, , , D . ( X ' , Y")D;;(X', Y") I,'.
M~(X'. Y', X I, y I ) = D~,(X D. y I )D?,(X~ I, y I ) ( I )
or, equivalently, as
, D~)(X 2. ~2) rD~
(x2.
Y2)D:)(XI' Y')]1'2
- ~ - ~ y~ (2)
U~ D~,(X', Y') L D~(X'. Y')D?,(X" " 1, ) '
where the superscripts denote two time periods~ The expression in Eq. (2) shows how one can decompose the Malmquist productivity index into a product of two component measures: (i) the change in the technical efficiency and (ii) the geometric mean of the change in the frontier. Here the ratio outside the bracket in Eq. (2) measures the change in technical efficiency between '1' and '2', i.e. whether the technical efficiency at period 1 is less than the efficiency in period 2 and hence whether the production is getting closer to the world frontier constructed as the best-practise frontier for all countries in the sample. For values greater than one, this component will indicate that the country has improved its relative ~echnical efficiency during the period considered and hence experienced diffusion of technology. The ratio inside the square bracket measures the shift in frontier
- between two periods, time, and time 2. A value greater than one will indicate that there is technical progress along the input and output mix of the country. The Malmquist index which display the changes in the productivity is the product of these two measures. While index values greater than one show improvement in the productivity over time. values smaller than one indicate deterioration in performance.
3. Data and empirical results
Using the methodology above, the productivity growth for a sample of 23 countries, 13 of which
:Here the superscript I on the distance function indicates that year I's observations on inputs and outputs for all the countries in the sample are used to construct the world frontier. Superscript l on the input and output vector shows that year I's observations on inputs and outputs of a particular country will be subject to comparison with the world frontier. Then D~(X~,Y ~), for example, measures the distance of a country at time period I relative to the world frontier at lime period 2. Each of these distance functions corresponds to a nonparametric linear programming problem which imposes conslant returns to scale assumptions on the world frontier with the strong disposability of inputs and outputs (see Fare et al,. 1994. for details).
96 F. Taskin. O. Zaim I Economics Letters 54 (1997) 93-100
can be classified as low-income and the remaining 10 as high-income countries, are analyzed for the period 1975-1990. The low-income countries in our study are Argentine, Bolivia, Chile, Colombia, Mexico, Nigeria, Korea, Peru, Philippines, Sri Lanka, Taiwan, Turkey, and Yugoslavia. The high- income countries are Canada, France, Germany, the United Kingdom, Italy, Israel, Japan, New Zealand, Spain and the United States: ~ The data are compiled from the Penn World Tables (PWT 5.6) initially derived from the International Comparison Programme benchmark studies where cross- country and overtime comparisons are possible in real values. The variables for each country are aggregate output measured by real Gross Domestic Product (GDP), expressed in international prices (base year 1985), aggregate labor iuput measured by total employment is computed from real GDP per worker and total capital is stock calculated from non-residential capital stock per worker.
in this study the hypothesis of catching-up is empirically tested for a sample that includes both high- and low-income countries. By examining the relative performance of these countries with respect to the world frontier, it is possible to measure the changes in the technical efficiency and hence evaluate the rate of diffusion of technology among or across the low- and high-income countries for each pair of years over the sample period. Furthermore, the significance of the starting position of the countries tbr their future growth prospects is investigated.
The application of the above methodology provides for each country, the Malmquist productivity index (MAIM) and its components, efficiency change index (EFFCH) and technical change index
(TECHCH) for each pairs of years in the sample. Then geometric averages of each index is computed for the entire 1975-1990 period to show the average annual performance developments in productivity growth and its components for a particular country. For each index a value greater than one indicates an average annual improvement in the performance of the country and a value less than one shows deterioration in performance. The mean MALM, EFFCH and TECHCH indices for all countries, and for high- and low-income countries, obtained through the geometric mean over country averages, are reported in Table i (the details of which are provided in Appendix A). The mean Malmquist productivity index with a value slightly less than one (0.9994), reported in column one, indicates that for all countries in the sample there has been a productivity loss on the average. Among the two groups of countries there is a productivity gain in the high-income countries (0.37% per year) and a productivity loss in low-income countries (0.38% per year).
Table I
Mean Malngluist Index and its decomposition
Countries MALQI EFFCH TECHCH
All ~.'oumries 0.9994 1.0054 0.994 I
High-income 1.0037 0.9994 1.0044
Low-income 0.9962 1.0101 0.9862
1975 real GDP per capita 6062
9759 2934
~Th¢ country ,gelection was made according to the availability of the capital stock data and. given the ,set of countries in the sam:pie, the classification of countries as high and low income are made according to whether the 1975 starting h~vel per capita income was greater or smaller than US$7000, According to the World Bank classification, all our higl,,income countdes qualify as high-income and our low-income countries are referred to as either low-. lower-middle- or upper-middle- income countries.
F. Taskin. O. Zaim I Economit's Letterx 54 (1997~ 93-100 97
Low-income countries have on average a higher efficiency change index, which indicates that this set of countries approach the 'best practise' frontier at a faster rate than the high-income countries, and hence the catch-up process works in the low-income countries. However, this set of countries are suffering from loss of productivity due to the other source of productivity growth - technical change (innovation) - which is in fact the main source of productivity growth for high-income countries.
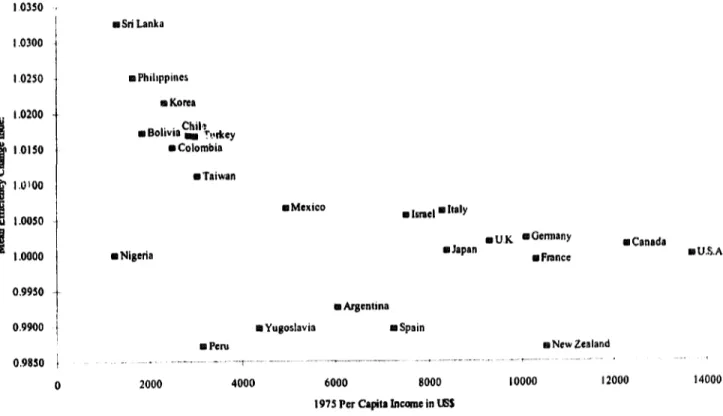
The hypothesis that the productivity gain is achieved mainly by innovation in high-income countries and through catching-up in low-income countries finds more empirical support when one examines the relations between the EFFCH index or the TECHCH index and starting per capita income level of countries. The inverse relationship between the mean efficiency change index and the initial per capita income level depicted in Fig. ! is also justified by the significant negative regression coefficient reported in Table 2 (first row). These results indicate that the countries that are relatively poor to begin with, have a higher mean EFFCH index and consequently will catch up to the frontier at a faster rate compared with the countries with high per capita initial income levels.
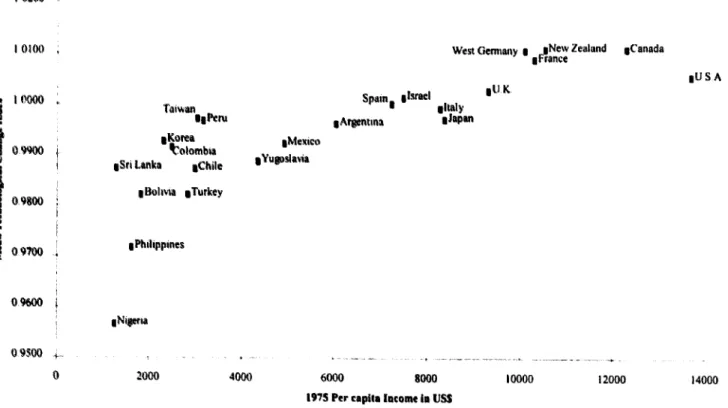
Technical change, as a factor contributing to productivity growth, is dominant in high-income countries. The significant positive relationship between the mean TECHCH index and initial per capita income level is depicted in Fig. 2. The same relationship is strengthened by the highly significant positive coefficient for the relevant regression reported in Table 2 (second row). This empirical finding shows that the countries that have relatively high starting per capita income levels also have a high mean technical change index. The insignificant coefficient found for the initial per capita income level as an explanatory variable in the regression equation for the Malmquist index, which measures total productivity change, is an indication that studies which try to relate the Total
1.0350 1.0300 1,0250 1.0200
i
~
l,Ol$O~
l,OiO0 1.0050J
1.0000 0.99S0 0.9900 0.9850 mSn Lanka m Phihppines u Korea . . . . Chil ~.m uommvma Immm T,.,~ey m Colombia
I Taiwan
zz Mexico .* Israel m Italy
m U K mOennany
m Nigeria zzJapan g France
aCanada
m Arsentina
1 m Yusoslavia m Spain
!
B Peru m New Zealand
!
0 2000 4000 6000 8000 10000 12000
1975 Per Capita Income in US$
Fig. I. The relationship between efficiency change and initial per capita inconle level.
J U . ~ . A
98 F. Taskin. O. Zaim I Economics Letters 54 (,: >+97J 9 3 - I 0 0
Table 2
The relationship between productivity indices and initial per capiia income level
Dependent variable Inter,.cpt Initial per capita income level R"
EFFCH i n d e x 1.016 - 1.075 x i 0 + 0,293 (244.56) ( - 2.95) TECHCH index 0,978 2.69 x lO ~' 0.647 (321.661 (6.20) MALM index 0.994 9.65x 10 7 0.075 ( 191.76) ( 1.31 )
Note: The numbel's in parentheses are t+statisties.
Factor Productivity Index (without breaking it into its components) and initial level of income nmy arrive at a misleading result of no convergence.
4, C o n c l u s i o n
The convergence hypothesis debated by development economics claims that poor countries grow faster than rich countries and hence there exists a tendency to catch up. It is possible to provide further evidence for the existence of convergence using the efficiency change component of the Malmquist productivity index computed by linear programming methods ill a sample of countries
1 0200
I 0100 West Germany I olNew Zealand tCanada
irrance ~ l O ~
I 09800
j 0'T/00 . t l INilWm llPCmiKot~'a
~olomb~iSri Limka iChile iBohvta iTurkey iPhilippines iMex¢o iYuPMavia Spain I I imel I UK llmly iAr~ntma IJaP m 0 9500 +. , . . . 0 2000 4000 6000 8000 10000 12000
197S
Per clpill Income inUSS
Fig. 2. The relationship between innovation al)d initial per capita incollle love|,
IUSA
F. l~lskin. 0 , Zaim I l'.'~'onomiu,~ Letter~ 54 (1997/ ~ - I t X J 99
which includes both high- and low-income cotmtries. Furthermore, the results suggest that countries with low initial per capita income levels catch up at a faster rate and countries with relatively high income benefit more from technological progress.
Appendix A
Mean country Malmquist index and its decomposition
Countries MALQI EFFCH 71;CHCH 1975 real GDP
per capita Sri Lanka 1.0195 Philippines ().9960 Korea, Rep. 1.014 I B,)livia 0.999 I Turkey 0.9986 Chile 1.0037 Colombia 1.0065 Taiwan 1.008 I Mexico 0.9987 Italy 1.005 I Israel 1.0067 Germany, West 1.0126
United Kingdom I.O043
Canada I .O I i 9 Japan 0.9973 Nigeria 0.9566 United States 1.0050 France 1.0078 Argentina 0.9886 Yugoslavia 0.9784 Spain 0.9894 Peru 0.9838 New Zealand 0.9974 1.0326 1.0250 1.0215 1.0173 I .O 168 I .O 168 !.0151 I.OI I! .0066 .0062 .0056 .0024 .0019 .0() 14 .(X)05 .0000 .0000 0.9993 0.9926 0.9896 0.9895 0.987 I 0.9870 (I.9873 1245 (I.97 i 7 1625 0.9927 2323 0.9820 1835 0.9821 2838 0.9872 2986 0.9915 2504 0.9971 3042 0.9921 4928 0.9989 8282 1.0011 7494 I .O I (12 I O 094 1.0024 9312 I .O I (15 12 287 0.9968 838 I 0.9566 1245 1.0050 13 682 1.0085 10 297 0.9960 6052 0.9887 4352 0.9999 7238 0.9966 3164 1.0105 10 526 References
Abromovitz, M., 1986, Catching up, forging =dlead. and falling behind, Journal of Economic Hislory 46, 3~5:,406. Barro, R.J., 1991, Economic growth in a gross section of countries, Quarlcrly Jourmd of Economics lOb, 407=443.
tO0 F. Taskin. O. Z~iim / E('¢memik's Letters 54 (19971 ~3-100
Baumol, W.J., 1986, Productivity growth convergence and welfare: What the long-run data show, American Economic Review 76, 1072-1085.
Baumol, W.J. and E.N. Wolfi, 1988, Productivity growth, convergence, and welfare: Reply, American Economic Review 78,
1155-1159.
Dowrick, S. and D. Nguyen, 1989, OECD comparative economic growth 1950-85: Catch-up and convergence, American Ec~momic Review 79, 1010-1030,
Fare, R.. S. Grosskopf. M. Norris and Z. Xhang. 1994, Pr~luctivity growth, technical progress, and efficiency change in
industrialized countries, American Economic Review 84, 66-83,
Maddison, A., 1987, Growth and slowdown in advanced capitalist economies: Techniques of quantitative assessment. Joumal of Economic Literature 25, 649-698.
Mankiw, N.G., D. Ruiner and D.N. Well. 1992, A contribution to the empirics of economic growth. Quarterly .Iournal of Fx'onomics 107, 407~437.
Quah, D., 1993, Gallon's fallacy and test of the convergence hypL~thesis, Scandinavian .Iournal of Econotnics 95. 427-443. Sachs, J. and A. Warner, 1995, Economic convergence and economic policies. National Bureau of Economic Research