Analytic modeling of patterned high-Tv superconductive bolometers:
film and substrate interface effects
M. Fardmanesha and A. Rothwarfb
aElectrical and Electronics Engineering Department, Bilkent University, Ankara, Tr. 06533
"Electrical and Computer Engineering Department, Drexel University, Philadelphia, PA. 19104
ABSTRACT
Superconducting film and substrate interface effects on the response of superconductive edge-transition bolometers are modeled with a one dimensional thermal model in closed form, for samples with large area patterns compared to the substrate thickness. The results from the model agree with experimental results on samples made of meander line patterned granular YBCO films on crystalline substrates, in both the magnitude and phase of the response versus modulation frequency up to about 100 KHz, the limit of the characterization setup. Using the fit of the calculated frequency response curves obtained from the model to the measured ones, values of the film-substrate and substrate-holder thermal boundary resistance, heat capacity of the superconducting film, and the thermal parameters of the substrate materials could be investigated. While the calculated magnitude and phase of the response of the SrTiO3 substrate samples obtained from the model is in a very good agreement with the measured values, the calculated response of the LaAIO3 and MgO substrate samples deviate slightly from the measured values at very low frequencies, increasing with an increase in the thermal conductivity of the substrate material. Using the fit of the calculated response to the measured values, film-substrate thermal boundary resistances in the range of 44* lO to 44* 1 02K-crn2-w1 are obtained for different substrate materials. The effect of substrate optical absorption in the response of the samples is also investigated.
Keywords: superconducting, YBCO, bolometer, interface, modeling:
1. INTRODUCTION
The frequency response and effects of the thermal boundary resistance at the interfaces of the substrate on the response versus modulation frequency of the edge-transition bolometers, has already been studied and proposed in different works [l]-[7]. After finding the major effects of the substrate-holder and substrate-film thermal boundary resistance on the response of this kind of bolometers and also its modulation frequency dependence, there has been some efforts to predict the thermal response behavior using different thermal models of this type of the detectors particularly the used samples in this work.[1],[3],[8]-[1 1]. Here we propose a thermal model and its closed form solution for the bolometric response of the mentioned High-Ta superconducting edge-transition bolometers from dc to midrange modulation frequencies. The focused and studied samples in this work are made of 120-550 nm thick in-situ sputtered superconducting YBa2Cu3O7x films on 0.025 cm to 0.05 cm thick crystalline SrTiO3, LaAIO3, and MgO substrates.
The thermal boundary resistance at the substrate-holder of the samples, Rsc, have been found and already reported to be considerably higher than that of the substrate materials, R5, and that of the film, Rf, and the film-substrate, Rf5 as well [l],[31,[12]-[14]. Hence, the total thermal conductance of the device, Rt, will be close to the value of Rsc resulting in RtRsc, which is found to be the case at very low modulation frequencies [3],[12]. In such a configuration the response of the samples are expected to follow a simple R-C model where R is mainly determined by the thermal boundary resistance at the substrate-holder interface (i.e. RRsc)and C is mainly due to the heat capacity of the substrate materials, C5, which is much higher than that of the film in the studied samples in this work (i.e. CC5>>Cf) {15J-[19]. This would be the case up to frequencies where the thermal diffusion length, L, into the substrate materials is more than the substrate thickness, L5,
and the effect of the substrate-cold finger interface can be seen by the heat wave propagating into the substrate [3],[12J. The increase of the modulation frequency beyond the values where the thermal diffusion length is less than the substrate thickness, can cause a change in the slope of the response magnitude versus modulation frequency compared to that of the basic R-C model. This found to happen at a frequency, fL, called the 'knee" frequency which is dependent on the substrate
material and its thickness {1J,[3],[12]. Considering the thermal diffusion length as the characteristic penetration depth of the temperature variation into the substrate, the Knee frequency can be determined from [3},[12};
D
(1) itLsL
where L5 is the substrate thickness, D=K5/C5 is the thermal diffusivity of the substrate material, and K5 and C are the thermal conductivity and the specific heat (per unit volume) of the substrate materials respectively.
Different regime of frequency response behavior has been identified based on the above [1 ],[3}.For frequencies less than fL,
the response is found to scale as f' following the response for a simple R-C mode! [31j12],[151-[16]. For frequencies higher than fL the response is found to scales as f"2 due to the variation of the effective penetration depth of the temperature variation into the substrate [1},[3I,[l2. The response follows the f1 dependence up to frequencies where the thermal resistance of the superconducting film-substrate boundary, Rf5, is negligible compared to that of the substrate materials, R5. The frequency dependent total thermal conductance of the substrate, R5, is determined from the thermal diffusion length as;
R5= (2)
A CsKs7cf
where A is the effective area of the conductive path, f is the modulation frequency in Hz, and is a correction factor for the above approximation of the effective length of the ac heat flow [3],[14]. The effects of the substrate thermal boundary resistance and its temperature dependency is also proposed to be partly responsible for the variation of the response versus temperature which was interpreted as the non-equilibrium response of such devices [14].
There has been different efforts on the thermal response modeling of the edge-transition superconducting bolometers with and without the consideration of the effects of the thermal boundary resistance at the substrate interfaces and the self or Joule heating in the superconducting film [1],[8],[1OJ-[l1]. Based on the above proposed effects of the introduced parameters, there has been a successful analysis and prediction of the frequencies of the Knee points in the response versus modulation frequency curves of the samples [l],[3]. Though, they have not predict and matched the response in all the measured modulation frequency regimes. The proposed models have predict and matched the measured response of the
samples at very low frequencies showing different considerable discrepancies at midrange and/or higher modulation frequencies [l],[3]. To our knowledge, in all the proposed models and the solutions, only the magnitude of the response have been considered and compared to the experimental values, where the phase of the response is found to be a much more sensitive characteristics of the response to the model and the chosen or obtained thermal parameters of the device [14]. In
this work we present the results obtained from the derived closed form solution of the proposed model with the
considerations of the interface effects and compare it to the both measured values of the magnitude and phase of the response.2. SAMPLES AND THE CHARACTERIZATION SETUP CONFIGURATIONS
The samples studied in this work are made of 120-550 nm thick granular superconducting YBa2Cu3O7x films on 0.025 cm to 0.05 cm thick crystalline SrTiO3, LaAlO3, and MgO substrates. The films are deposited using off-axis planar magnetron sputtering at about 720 °C and patterned using standard photolithography technique (positive photoresist) modified for less damage to the YBCO material. The resistance versus temperature and the critical temperature of the samples are found to change by being exposed to high bias currents and thermal cycling under vacuum, with the transition temperature of the samples shifting to lower temperatures due to high bias currents and recovering under a few thermal cycles reaching an stable value under low bias currents [13]. The presented data in this work is obtained using relatively low bias currents under stable conditions and Tc. More details about the fabrication of the samples and their dc characteristics are presented elsewhere [3],[13]-[14].
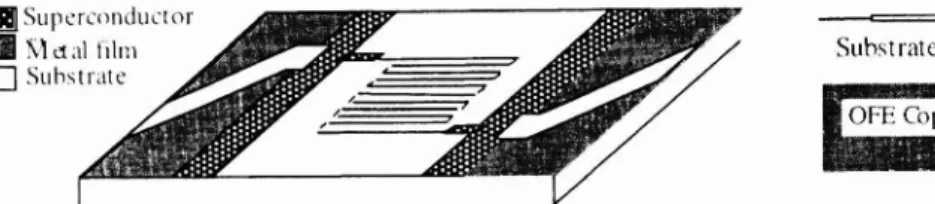
A typical configuration of the samples is shown in Figure 1 .Thecontact areas for the four probe measurement were coated with either —85 nm layer of sputtered gold or —60 nm layer of sputtered silver. Electrical contacts to the samples were made using copper wire (32-gauge) and silver epoxy dried at room temperatures over night. To characterize the samples the 2nd cold stage of a cryo-Torr 100 was used as the cold finger, the temperature of which could be controlled by about from the set points. More details of the characterization setup and the instrumentation is presented elsewhere [14],[17],[20J. A sample holder was designed and made of OFE copper which was etched in an inert environment gas and coated by a thin layer of gold without being exposed to the atmosphere. The configuration of the holder is shown in Figure 2.
Superconductor
\ ta1 turn
fl Substrate
As shown in figures 1 and 2. there are two thermal boundary resistance at the substrate interfaces, one at the film interface
and the other at the holder interface. There are two major hulk areas that contribute to the overall heat capacity of the
samples. one due to the superconducting film and one due to the substrate materials. Here the OFE copper is considered as a
temperature reservoir the temperature of which has been considered to be uniform and as measured by the temperature
sensor. A very thin layer of either Apiezon-N grease or silicon vacuum grease were used to attach the sample to the holder
for better thermal contact, the effect of which is considered to be included in the measured substrate-holder thermal
boundary resistance. Rsc, in this work. Some of the dimensional parameters and the dc thermal and electrical characteristics of interest for the studied samples in this work are given in Table 1. The given thermal conductivity and heat capacity of the LaAlO3 substrate material in Table I is obtained by fit of the calculated response versus frequency curve from the model to that obtained experimentally.
The phase and magnitude of the response versus modulation frequency of the samples which are the focus of this work, was measured using a lock-in amplifier (EG&G 5406) the input signal of which was amplified using an ultra low noise
preamplifier (model 03DB, Perry Amplifier). A light-emitting diode (HFE4O2O, Honeywell Inc.) with a peak radiation wavelength of about 0.85 iam was used as the radiation source for the response versus modulation frequency in all the measurements. The response of the samples was found to be proportional to the radiation intensity up to 2.13 mW/cm2,
which is the radiation intensity of the source during the measurement of the presented results in this work.
3.
THE THERMAL MODELING
Asit is relatively shown in Figure 2. and from the given dimensions in Table 1. the area of the superconducting pattern with respect to the substrate thickness is large. Hence a one dimensional model and its solution is considered and applied for the
studied samples in this work. Since there exit a lateral heat diffusion in the substrate before the heat wave from the film
reaches the substrate-holder boundary resistance (the spreading resistance effect), a correction factor, a, is obtained to be applied to the measured Rse values of the samples as given in Table 1. The value of a is found to increase with the increase
of the thermal conductivity of the substrate material and also is found to increase with decrease of the superconducting pattern area with respect to the substrate thickness which is consistent with the above interpretation for the cause of the correction factor, a. The thickness of the superconducting film is also very small compared to that of the substrate, which
allows the consideration of a lumped film at the top of the substrate.
Table I. Dimensions and the obtained thermal parameters of the samples using the proposed thermal model. The dimension of the substrates area is about 0.5 cm by 1 cm for all the samples. As given in the table, d5 is the thickness of the substrate, df is the thickness of the YBCO film, is the measured substrate-cold finger thermal boundary resistance and x is its fitting parameter for the one dimensional solution obtained from the model. R is the film-substrate boundary resistance and Cf is the heat capacity of the
superconducting film obtained from the model. A is the total area enclosed by the superconducting meander line pattern.
sample number Substrate material ds (cm) C5 J
k-cm
K
W )T
R5
K (,)
W-cmdf
(nm) A (cm2) Rf5 mK ( W-cm'-Cf aJ k-em2 dR/dT Q 064-03a MgO 0.05 0.53 3 6.82 2 170 0.075 4.4 642 1000 064-Ola SrTiO 0.05 0.43 0.052 5.6 1.7 220 0.017 44 655 1800 061-02a LaAlO3 0.05 0.59 0.16 8.82 1 550 0.075 27.5 131 670 Siuhst rate Superconducting FilmFigure I. The typical used superconducting thin film and
metalliiation patterns of the samples on lcmx0.5 cm area crystalline substrates.
Figure 2. The experimental configuration of the thin film
samples on crystalline substrates with contact to the holder and the temperature sensor.
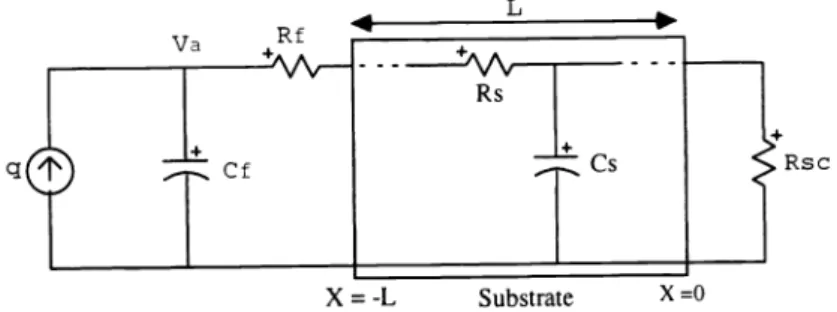
Considering the superconducting pattern as a lumped film on top of the substrate material and substrate as a continues uniform media, the thermal equivalent circuit of the samples in contact with the holder can be shown as in Figure 3,where q is the absorbed radiation intensity at the surface of the sample. In this equivalent diagram, two thermal boundaryresistance are considered at the substrate interfaces while only the heat capacity of the superconductingfilm is also considered. The thermal conductance of the superconducting film is calculated and found to be negligible compared to that of thesubstrate and the interfaces. For samples with thicker superconducting film as for the screen printed materials [17], the limited heat conductivity of the superconducting material same as for the substrate, should also be considered.
Rsc
Figure 3. Equivalent thermophysical diagram of the samples in contact to the cryogenics holder. q is the input radiation power, Cf 15the lumped heat capacitance of the film, C5 and R5 are the heat capacity and thermal conductivity of the substrate material, and Rf5 and Rsc
are the thermal boundary resistance values at the film-substrate and the substrate-holder interfaces respectively.
1.
Temperature variation in the substrate
To approach the complete close form solution to the model as given in Figure 3, first we consider the absorbed radiation power, q, being applied directly to the surface of the substrate ignoring the effects of the surface boundary conditions of Cf and Rf which are representing the effect of the thermal parameters of the superconducting film. As mentioned before this would be the case as for very low modulation frequencies where Cf is much smaller than the contributing heat capacity of the substrate determined from equation (1), and the film-substrate thermal boundary resistance, Rf, is much smaller than that of the substrate-holder and/or the thermal resistance of the substrate, R5, determined from equation (2).
Considering the substrate as a continues media of R and C elements as shown in Figure 3, to obtain the temperature variation at the surface of the substrate, we find the solution to the general heat propagation equation with the given boundary condition at the substrate-holder interface, Rsc. For one dimensional heat propagation in a material we have;
ST I
--=D2
(3)where D=klc is the thermal diffusivity of the material and k and c are the thermal conductivity and the specific heat per unit volume of the material which is the substrate in this case. Following the general steady state solution to the heat propagation equation, the temperature variation in the substrate with the consideration of the effect of the substrate-holderthermal boundary resistance, Rsc, is obtained. Then the temperature at the surface of the substrate without the consideration of the effect of the heat capacity of the superconducting film, Cf, and the thermal boundary resistance at its interface, Rf, is obtained to follow;
_ex
+r'ex-
1exp(yL)-Texp(-L) jwcsks (4)
where y is the characteristic thermal impedance of the substrate material defined as;
1+1 (5) and; ______
Rsc-
17
\,jjoxk5
Rsc+
(6) X = -L Substrate x =0CI) iS the angular modulation frequency, and k5 and cs are the heat conductivity and the heat capacity of the substrate materials, respectively. The value of Rsc can be found from;
R—
(7)sc—G(W/K)
where G is the thermal conductance of the device at very low frequencies, G(O). This is based on the assumption of Gf>> Gs >> Gsc where Gfs=IIRfS, G5 is the total heat conductance of the substrate, and Gscl/Rsc This assumption has been
verified for samples with dimensions close to that of our typical samples which is discussed and presented before
[1J,[3],[12],[14],{21}—[22].
2. Temperature variation at the film
To obtain the voltage response of the current biased samples to the modulated radiation intensities at all frequency ranges, one should find the temperature variation in the superconducting film which is considered to be the temperature variation across C1 in the equivalent circuit of Figure 3. Hence the only temperature gradient from top of the superconducting film to the substrate would be that across the film-substrate interface, RfS. Solving the one dimensional thermal differential equation with the complete boundary condition as shown in Figure 3 (i.e. with the consideration of Cf and RfS), the temperature variation in the superconducting film is found to follow;
exp(yL)+fexp(-yL) I P. exp(yL)-Fexp(-yL) jcoc5k5 fs
T= q
1 +jo:CfRf5 . . (8)Where q is the absorbed radiation power in the film per unit area, and Cf and Rf are the total heat capacity of the
superconducting film and the thermal boundary resistance at the film-substrate interface per unit area, respectively.
The obtained solution in equation (8) is valid from very low frequencies up to values where the thermal diffusion length into the superconducting film (for YBCO material) becomes smaller and/or comparable to the thickness of the film. This is while the penetration depth and/or the absorption coefficient length in the superconducting film is still considered to be much smaller than the film thickness or otherwise considered. This frequency regime for our samples with a maximum film thickness of about 550 nm is found to be much higher than that studied in this work. As given in equation (8), atvery low frequencies the denominator will approach one and the Rf will become negligible compared to the first term leading to the results of the one boundary condition problem as given in equation (4). This is because at very low modulation frequencies the temperature variation reaches the bottom of the substrate, hence the heat capacity of the film with respect to that of the whole substrate material under the pattern and the thermal boundary resistance at the film-substrate withrespect to R5 and Rsc becomes negligible [3},[12].
3. The voltage response and bias current dependence
Considering the temperature variation in the film caused by the absorbed radiation to be uniform all across the pattern, the voltage response in a dc current bias configuration can be obtained from;
dV= IbAT.j
(9)where 'b is the dc bias current, dR/dT is the slope of the R versus T curve at the bias temperature as given in Table1 ,and
T is the temperature variation in the superconducting film as given in equation (8). This is valid within thetemperature variation range where dR/dT can be consider to be constant which is about one tenth of the transition width at the middle of the superconducting to normal transition temperatures in our samples. Considering the maximum temperature variations being below about I mV as measured during the characterizations presented in this work and the transition widths typically of a few degrees of Kelvin in our samples, the variation of dR/dT and br the non-linearity of equation (9) is found to be negligible in our measured and calculated response. This would not be the case for devices exposed to high radiation intensities which are normally voltage biased for further stability's [23-[24]. The effect of the bias configuration on the response and the feedback effect of the Joule heating for each case of the voltage-biased and current-biased configurations are discussed and presented elsewhere [13].
There might also be a consecutive temperature variation due to ac Joule heating in the film caused by the resistance variation in the superconducting film caused by the input radiation power. This effect on the response which is in the form of a positive feedback in the used current-biased configuration here, can be considered either in the model as a dependent
radiation (or heating) source in parallel to the radiation source, q, in the equivalent diagram of Figure 3 [25J, or simply as an additional term in the overall responsivity of the sample as given in the following form [31,[121;
rv rv4=(1 Irv/1)
(10)
rvtis the overall responsivity in volts per watt and risthe absorption coefficient in the film. Considering the effect of the absorption coefficient in the q factor in equation (8), rv will the same as dV as given in equation (9). In the samples studied in this work the effect of ac Joule heating in the response is found to be negligible for the used biased currents.
4. MEASURED FREQUENCY RESPONSE AND CALCULATED RESULTS FROM THE MODEL
The results from the model is investigated using the measured magnitude and phase of the response versus modulationfrequency of meander line pattered samples given in Table I .Thefrequency response of the samples is found to be strongly dependent on the film and substrate dimensions as well as for the thermal parameters from which these characteristics of the samples can be further investigated. To calculate the response versus frequency of the samples using equation (8), the dc thermal parameters of Rf, Rsc, Cf, C5, and K5 of the samples were determined. The measured value of the above parameters of the sample are given in Table I .Thevalue of Rsc which is much higher than Rs and Rfs as given in the table, is rnsured using the method of resistive or dc Joule heating close to the transition temperature, Tc [14]-[16,[18. In this methodthe temperature rise in the film cause by the Joule heating due to the bias current and the film resistance, can be measured by measuring the resistance of the film from which Rsc can be obtained. Also starting from a typical value for unknown parameters such as the film-substrate thermal boundary resistance and the thermal parameters of the substrate or the heat capacity of the samples, the more accurate values could be obtained using the fit of the results from the model to the measured values which are given in Table 1 .The given values in the table are given per unit area as used in the one dimensional solution of the model.
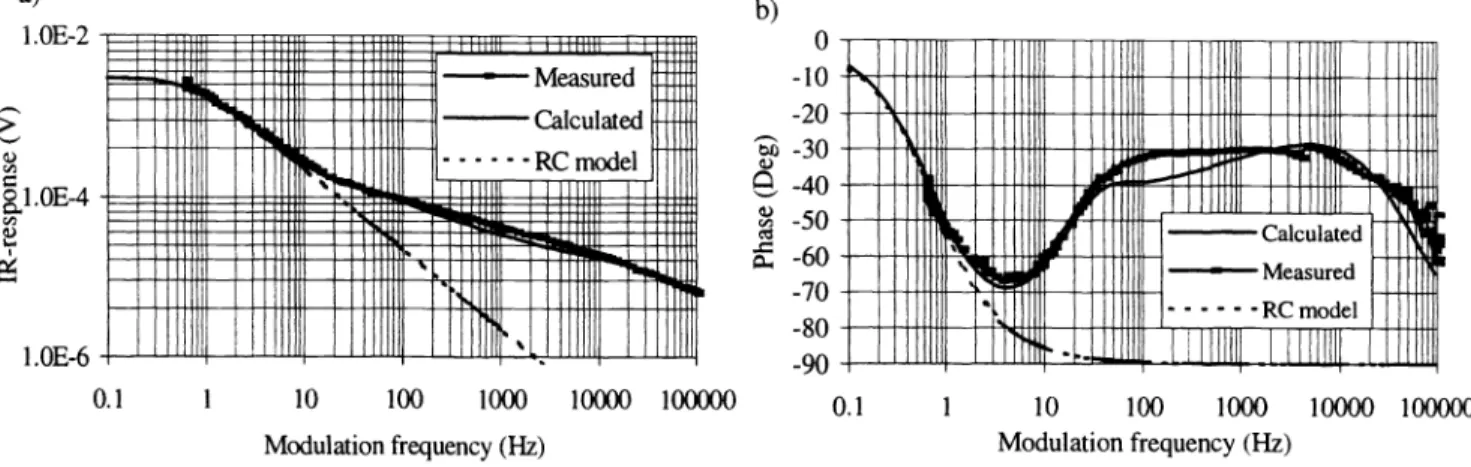
The results from the model have been investigated for samples on three different substrate materials as SrTiO3, LaAlO3, and MgO. The measured and calculated magnitude and phase of the response of meander line patterned YBCO films on 0.05 thick SrTiO3, LaA1O3, and MgO substrate samples are shown in figures 4, 5, and 6 respectively. Calculated response using the simple R-C model as used in reference 3 is also plotted for samples 064-Ola and 061-O2Aa. The calculated response for the R-C model is found using;
ijl
dRrv=
G+j2rcfCdT ' (11)The simple R-C model is found to be as useful as the complete model in the very low frequency ranges where the thermal diffusion length into the substrate is much larger than the substrate thickness. The simple R-C model is found to be appropriate for micromachined and/or free standing film bolometers since the values of G and C of the device in equation
a)
b)
l.OE-2 ______________JITIIIII hum I=
I
: Measured Calculated RC model-!
.
2 40
'i5-30
0 -10 -20 -50 — Measured -60 RC model -70 -80'
. .
--900. 1 1 10 100 1000 10000 100000 o. i
i
io ioo iooo ioooo ioooooModulation frequency (Hz) Modulation frequency (Hz)
Figure 4. Response versus modulation frequency of the SrTiO3 substrate sample 064-01 a at 80 K and 250 tA bias current. measured and calculated, a) magnitude and b) phase of response from both the model and that from the simple RC-model.
j
1.0E4
a)102
b
-10 -20-30
;-40
(I) -70 -80 -90N!te
jEJ
t1
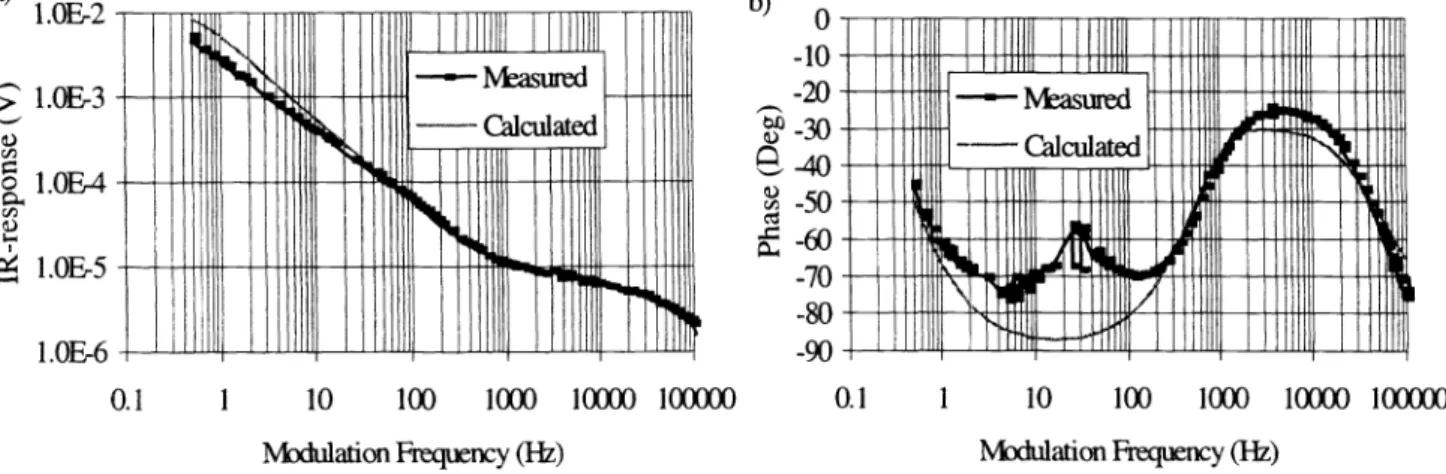
Figure 5.Responseversus modulation frequency of the LaA1O3 substrate sample 061 .02a at 79.5Kand 500 tA bias current. measured
and calculated, a) magnitude and b) phase of response from both the model and that from the simple RC-model.
(11) would be the same up to very high frequencies where the thermal diffusion length into the substrate or into the free standing element of the micromachined bolometer becomes smaller or comparable to their thickness' [15]-[16]. In general
the use of the simple R-C model is appropriate in the frequency regimes where one time period of the modulation frequency is longer than the very low frequency time response of the samples, tdefinedas t1=C(0)/G(0), where G(0) and C(0) are the total low or dc thermal conductance and heat capacity of the sample. In the following we compare the results from our model to the measured values for the measured frequency range and investigate the effects of different thermal and dimensional parameters on the fit of the model to the experimental values.
1. Substrate and pattern dimension dependence of the magnitude of the response
As given in table 1 ,thesubstrate-holder thermal boundary resistance of the sample, Rsc, is calculated in per unit area to be applicable in equation (8). The Rsc is found using the measured dc thermal conductance of the samples [14. As given in the table, a factor defined cx is defined for the correction of this value to match the calculated response to the measured values. As seen from the table, this factor is found to depend on the area of the pattern with respect to the substrate thickness and the thermal conductivity of the substrate materials, increasing by the increase of the thermal conductivity of the substrate and the increase of the ratio of ds/A. The requirement of the factor a for a better fit of the calculated response curves to the measured ones, is interpreted to be due to the spreading thermal resistance effect in the substrate material imposed by the one dimensionality of the model. Hence, for a relatively low thermal conductive substrate sample with a large dimension of the pattern area compared to the substrate thickness, this factor is expected to reach the value of one as obtained for sample 061-02a.
(1
Figure6. Response versus modulation frequency of the 0.5cmthick MgO substrate sample 064-03a at 79 K and 1 mA bias current. measured and calculated, a) magnitude and b) phase of response.
:
I
1.OFrS 1.OE-6 0. 1 1 10 100 1000 10000 100000 Modulation Frequency (Hz) 0.1 1 10 100 1000 10000 100000 Modulation Frequency (Hz) a) 1.OE.2:
I
1.0E5 1.OE-6 b)-10 H
i1
ffl[
ffli 11!
fl
-201H
asured
-30
I-50
-60
-70 -80 -90 0. 1 1 10 100 1000 10000 100000 Mxlulation Frequency (Hz) 0. 1 1 10 100 1000 10000 100000 Modulation Frequency (Hz)2. Low frequency magnitude of the response deviations and substrate material dependence
As observed from figures 4 to 6, there is a discrepancy between the results from the model and the measured values. This discrepancy is found to increase by the increase of the thermal conductivity of the substrate materials showing its maximum for the most conductive substrate sample. This is also interpreted to be due to the one dimensionality of the model underestimating the lateral heat diffusion in the substrate materials underneath the pattern. As observed from the magnitude of the response curves in figure 4, 5and6, the discrepancy is increased by the increase of the thermal conductivity of the substrate materials being the most for the MgO substrate sample 064-03a. This is also consistent with the variation of a which is obtained from fit of the curves up to the knee point frequency as discussed in the previous section. To avoid this discrepancy one might either find the three dimensional solution for the model, or uses the approximate cylindrical solution by considering non-uniform thermal conductivity and heat capacity of the substrate with a linear increase of c5, and k5 in the substrate as the distance from the surface of the substrate increases. In such an approximate solution the results of which can easily be observed using the simulation programs such as SPICE, the substrate-holder thermal boundary resistance, Rsc, might also be considered frequency dependent for more accuracy.
3. Phase of the response and the high-end frequency behavior
The phase of the response of the samples are found to be much more sensitive to the values of the characteristic parameters of the samples. Particularly the drop of the phase at high end frequency response has been the determining factor in finding the equivalent values of Cf and Rf given in Table 1 .Also while the low end calculated phase of the response versus modulation frequency is in a very good agreement with the experimental results for SrTiO3 and LaAIO3 substrate samples, there is a peak at the frequency range of 10 to 100Hz in the MgO substrate sample which can not be explained by this model. This behavior has also been observed for other MgO substrate samples occurring at lower frequencies in thinner substrate samples, at about 10 to 20 Hz modulation frequency for 0.025 cm thick MgO substrate which is about half of that of the 0.5cmthick MgO substrate sample 064-03a shown in Figure 6b. One speculated mechanism for this is interpreted to be possibly due to the reflection and interference effect of some acoustical phonons within the boundaries of the substrate underneath the superconducting pattern. The possible effect of the superconducting material on the spectral phonon density in the substrate and its consequent effects is already observed in the phase of the response versus temperature of the samples which is presented and discussed elsewhere [l4.
4. Mid-range frequency deviations in phase and magnitude of the response
There is also a consistent observed slight discrepancy in both magnitude and phase of the frequency response curves of the results from the model compared to that of the measured values. This is in the midrange frequency of the plateau of the phase versus frequency curve for all samples, the effect of which can also be observed partly in the magnitude of the response versus frequency curves in the same frequency regime. The measured response in this range is found to be slightly higher in magnitude and more in phase with the radiation signal than the expected values from the model. The possible effect of the radiation absorption by the open areas of the substrate within the meander lines of the patterns was investigated and its consideration in the model was found to lower the phase of the response increasing the observed discrepancy in the plateau region of the phase of the response versus modulation frequency curve particularly for he SrTiO3 substrate sample. The spectral absorption of the crystalline substrate materials where measured from 600 nm to 50
im
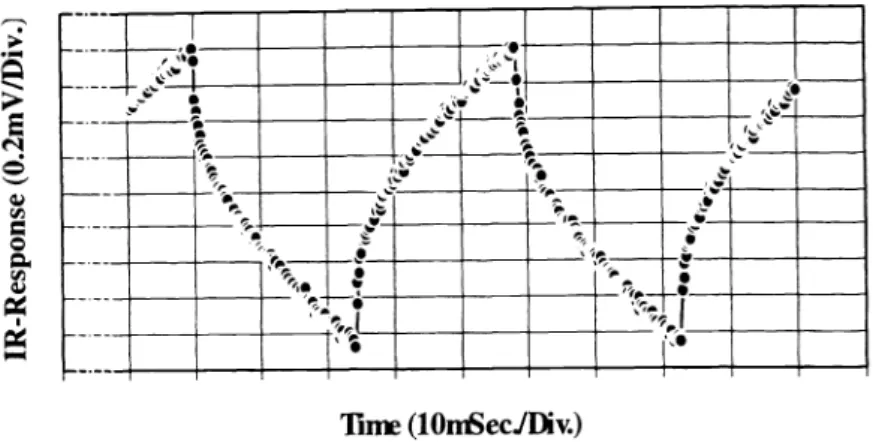
and was found to be about 12%, 20%, and 8% for our 0.05 cm thick SrTiO3, LaAIO3, and MgO substrates at 850 nm radiation wavelength respectively. While the effect of the substrate absorption is found to be negligible in the frequency response of the samples measured at 850 nm radiation wavelength, it is found to have a major effect in the measured spectral response of the samples at longer wavelengths [3],[12J,[20J. As an example the absorption in the SrTiO3 substrate is found to be over 90% from about 7 to 12 im and from aboutl9 to 21 m wavelengths [26]-[27J, the effect of which is clearly observed in the spectral response of the detectors on this kind of the substrate material and reported elsewhere [12], [27).We have observed a small and relatively fast component in the time response of the samples relatively increasing with respect to the total response by increase of the modulation frequency, which could not be explained by the thermal response as modeled in this work. The steady state time response of SrTiO3 substrate sample 064-Ola in the frequency regime mentioned above, is shown in Figure 7. As observed from the figure there exist an abrupt jump and drop at the edge of the on and off switching times of the fast near JR source which is derived by a square wave voltage signal [3],[17]. The same type of the steady state time response is observed for other samples in the same frequency regime, the effect of which is in the favor of the discrepancy (i.e. lowering the phase value and increasing the magnitude of the response from those calculated values by the model). This might explain the higher magnitude and lower phase in the plateau region which also needs to be further investigated.
E
ci)
ci)
Figure7. The steady state response versus time ofthe SrTiO3 substrate samIe 064-Ola at 560 jtAbias current, radiated by a 20 Hz
square radiation signal with 2.1 3 mW/cm maximum intensity.
5.
SUMMARY
AND CONCLUSIONS
The phase and magnitude response versus modulation frequency of superconducting edge transition bolometers is strongly a function of the thermal boundary resistance at the film-substrate and the substrate-holder interfaces. A model based on above with consideration of the film and substrate thermal parameters for bolometers with superconducting patterns larger or comparable to the substrate thickness are proposed. The model is used to monitor the above thermal parameters of our samples by fitting the obtained phase and magnitude of the response from the model to that measured. The results from the model confirm the major effects of the thermal boundary resistance dominating the effects of the substrate materials at very low and high modulation frequencies.
A very good fit between the both measured magnitude and phase of the response to that obtained from the model could be obtained for the SrTiO3 substrate samples from very low modulation frequencies of 0.5Hzup to about 100 kHz which were the limits of the characterization setup. From the high frequency end of the above fit, the superconducting film-substrate thermal boundary resistance and the heat capacity of the film could be obtained. Both the film-substrate boundary resistance and superconducting film heat capacity of our samples are found to be larger than the previously typical reported values in the literature. From the low and midrange frequency of the above fit, the heat capacity and thermal conductivity of the used substrate materials (SrTiO3, MgO, and LaAIO3) and the substrate-holder thermal boundary resistance could be obtained. The obtained heat capacity and thermal conductivity of the substrate materials agree well to the previously reported values in the literature.
The obtained thermal boundary resistance at the substrate-holder of our all samples is found to be the highest thermal resistance value seen by the dc and/or low frequency heat wave from the absorbed radiation power in the superconducting film flowing to the substrate holder, the temperature reservoir. Though a slight deviation for the MgO and LaA1O3 substrate samples is observed at very low frequencies which increases with the increase of the thermal conductivity of the substrate materials. This is while the total thermal conductance of the bolometer is found to be mainly governed by the thermal boundary resistance at the substrate-holder interface. This suggests the effect of the lateral heat flow through the substrate underneath the superconducting film to be considerable for more thermal conductive substrate materials where the dependence of the dc thermal conductance on the superconducting pattern area suggests a directional heat flow only underneath the superconducting film.
In conclusion the proposed one dimensional thermal model can be used to monitor the thermal parameters of the
superconducting film, substrate, and the thermal boundary resistance values of an edge-transition superconductive bolometer, and also the mechanism of the heat flow in such devices. The response versus modulation frequency of thebolometers are found to be the most informative data in this respect. The response of the bolometers with large
superconducting pattern areas compared to the substrate thickness is found to be mainly bolometric following the results from the model. For samples with small superconducting pattern areas compared to the substrate dimensions, or with more thermal conductive and thicker substrates a three dimensional model would be required for better fit of the calculated and measured response values.6. ACKNOWLEDGEMENTS
The author would like to thank Professor I. Aksun for his valuable inputs in derivation of the closed form solution for the model.
7. REFERENCES
1 P. E. Phelan, 'Thermal response of thin-film high-Ta superconductors to modulated irradiation,' J. of Therm. Phys.
Heat Transfer, Vol. 9, no. 3, pp 397-402, 1995.
2. S. Zeuner, W. Prettl, and H. Lengfellner, "Fastthermoelectric response of normal state YBa2Cu3O7d films", AppI. Phys. Lett., Vol. 66, no. 14, pp. 1833-1835, April 1995.
3. M. Fardmanesh, A. Rothwarf, and K. J. Scoles, "Low and Midrange Modulation Frequency Response for YBCO Infrared Detectors: Interface Effects on the Amplitude and Phase", IEEE Trans. on AppI. Supercond., Vol. 5, no. 1, pp. 7-13, March 1995.
4. M. Nahum, S. Verghese, and P. L. Richards, "Thermal boundary resistance for YBa2Cu3O7x films", Appi. Phys. Leti., Vol. 59, no. 16, pp. 2034-2036, Oct. 1991.
5. A. V. Sergeev, A. D. Semenov, P. Kouminov, V. Trifonov, I. G. Goghize, B. S. Karasik, G. N. Gol'tsman, and E. M. Gershenzon, "Transparency of a YBa2C113O7-film/substrate interface for thermal phonons measured by means of
voltage response to radiation," Phys. Rev. B, Vol. 49, no. 13, pp. 9091-9096, April 1994.
6. C. D. Marshal, I. M. Fishman, R. C. Dorfman, C. B. Eom, and M. D. Fayer, "Thermal diffusion, interfacial thermal barrier, and ultrasonic propagation in YBa2Cu3O7x thin films: Surface-selective transient-grating experiments", Physical Review B, Vol. 45, no. 17, pp. 10 009-10 021, May 1992.
7. C. D. Marshal, I. M. Fishman, M. D. Fayer, "Ultrasonic wave propagation and barrier-limited heat flow in thin films of YBa2Cu3O7x", Physical Review B, Vol. 43, no. 4, pp. 2696-2699 Feb. 1991.
8. K. Fushinobu, P. E. Phelan, K. Hijikata, T. Nagasaki, and M. I. Flik, "Thermal analysis of the performance of a high-Ta superconducting bolometer", J. Heat Transfer, Vol. 116, pp. 275-279, 1994.
9. A. Frenkel, "Mechanism of nonequilibrium optical response of high-temperature superconductors", Physical Review B, Vol. 48, no.13, pp. 9717-9725, Oct. 1993.
10. H. Neff, "Modeling and optimization of high-Ta superconducting bolometers: the effect of film thickness", J. Appi. Phys. ,Vol.69, no. 12, pp. 8375-8379, June 1991.
1 1. Flik, M. I., Phelan, P.E., and Tien C. L., "Thermal model for the bolometric response of high-Ta superconducting films to optical pulses", Cryogenics, Vol. 30, pp. 1118-1128, Dec. 1990
12. M. Fardmanesh, A. Rothwarf, and Kevin J. Scoles, "The responsivity and detectivity limits for patterned YBa2Cu3O7 x superconductive JR-detectors," 6th mt. Superconductive Electronics Conference proc., Vol. 3, pp. 399-401, June 1997.
13. M. Fardmanesh, K. J. Scoles, and A. Rothwarf, "DC charateristics of patterned YBa2Cu3O7.. superconducting thin film bolometers: Artifacts related to Joule heating, ambient pressure, and microstructure, "Toappear in IEEE Trans. on Appl. Superconductivity, June 1998.
14. M. Fardmanesh, A. Rothwarf, and K. J. Scoles, "YBa2Cu3O7..x infrared bolometers: temperature dependent responsivity and deviations from the dRIdT curve. ",J.Appl. Phys., Vol. 77, no. 9, pp. 4568-4575, May 1995. 15. Agha Jahanzeb, Christine M. Travers, Zeynep Celik-Butler, and Donald P. Butler, "A semiconductor YBaCuO
microbolometer for room temperature IR imaging," IEEE Trans. on Electron Devices, Vol. 44, no. 10, pp. 1795-1801, Oct. 1997.
16. Christine M. Travers, Agha Jahanzeb, Donald P. Butler, and Zeynep Celik-Butler, "Fabrication of semiconducting YBaCuO surface-micromachined bolometer arrays," J. Microrelectro-mechanical Systems, Vol. 6, no. 3, pp. 27 1-276, Sept. 1997.
17. M. Fardmanesh, M. Ihsan, A. Rothwarf, K. Scoles, and K. Pourrezaei, " Thick and thin film Y-Ba-Cu-O infrared detectors", American Institute ofPhysics Proceeding, no. 251, pp. 681-691, 1991.
18. M. Nahum, Qing Hu, P. L. Richards, S. A. Sachtjen, N. Newman and B. F. Cole, "Fabricationand Measurement of High Tc Superconducting Bolometers", IEEE Trans. on Mag. ,Vol.27, pp. 3081-3084, March 1991.
19. P. L. Richards, J. Clarke, R. Leoni, Ph. Lerch, S. Verghese, M. R. Beasley, T. H. Geballe, R. H. Hammond, P.
Rosenthal, and S. R. Spielman, "Feasibility of the high T superconducting bolometer, "AppI.Phys. Lett. Vol. 54, no. 3, pp. 283-285, Jan. 1989.
20. M. Fardmanesh, A. Rothwarf, and K. J. Scoles, "Noise characteristics and detectivity of YBa2Cu3O7 superconducting bolometers: Bias current, frequency, and temperature dependence," J. App!. Phys., Vol. 79, no. 4, pp. 2006-2011, February 1996.
21. Hsiung Chou, ,H. Z. Chen, M. T. Hong, Y. C. Chen, and T. C. Chow, "Bolometric detection in a precipitation free YBa2Cu3O7x film at 77 K," App!. Phys. Lett., Vol. 68, no. 19, pp. 2741-2743, May 1996.
22. J. H. Hao, F. Q.Thou,X. R. Zhao, H. D. Sun, X. J. Yi, and Z. G. Li, "Responsivity calculation and measurement of YBaCuO optical detector," IEEE Trans. on Appl. Supercond., Vol. 3, no. 1, pp. 2167-2169, March 1993.
23. G. Darcy Poulin, Jean Lachapelle, Steven H. Moffat, Frank A. Hegmann, and John S. Preston, "Current-Voltage characteritics of dc voltage biased high temperature superconducting microbridges," App!. Phys. Lett., Vol. 66, no. 19, pp. 2576-2578, May 1995.
24. K. D. Irwin, G. C. Hilton, D. A. Wollman, and John M. Martinis, "X-ray detection using a superconducting transition-edge sensor microcalorimeter with electrothermal feedback, "Appi.Phys. Lett. Vol 69, no. I 3, pp. 1945-1947, September 1996.
25. Z. M. Thang and A. Frenkel, "Thermal and nonequilibrium responses of superconductors for radiation detectors, "J.
Superconductivity, Vol. 7, no. 6, pp. 871-883, 1994.
26. K. kamaras, K. L. Barth, F. Keilmann, R. Henn, M. Reedyk, C. Thomsen, M. Cardona, J. Kircher, P. L. Richards, and J. L. Stehle, "The low-temperature infrared optical functions of SrTiO determined by reflectance spectroscopy and spectroscopic ellipsometry," J. Appi. Phys., Vol. 78, no. 2, pp. 1235-1240, July 1995.
27. M. Fardmanesh and A. Rothwarf, "Control of superconductive edge transition YBa2Cu3O7 bolometers responsivity and detectivity through substrate properties," submitted to Applied Optics.