Full Terms & Conditions of access and use can be found at
http://www.tandfonline.com/action/journalInformation?journalCode=wicm20
Journal of International Consumer Marketing
ISSN: 0896-1530 (Print) 1528-7068 (Online) Journal homepage: http://www.tandfonline.com/loi/wicm20
Consumers' Use of Country-of-Manufacture
Information? Norway and the United States:
Ethnocentric, Economic, and Cultural Differences
James G. Helgeson, Lada Helen V. Kurpis, Magne Supphellen & Ahmet Ekici
To cite this article: James G. Helgeson, Lada Helen V. Kurpis, Magne Supphellen & Ahmet Ekici (2017) Consumers' Use of Country-of-Manufacture Information? Norway and the United States: Ethnocentric, Economic, and Cultural Differences, Journal of International Consumer Marketing, 29:3, 179-193, DOI: 10.1080/08961530.2016.1273812To link to this article: https://doi.org/10.1080/08961530.2016.1273812
Published online: 01 Mar 2017.
Submit your article to this journal
Article views: 110
View related articles
Consumers’ Use of Country-of-Manufacture Information? Norway and the United
States: Ethnocentric, Economic, and Cultural Differences
James G. Helgesona, Lada Helen V. Kurpisa, Magne Supphellenb, and Ahmet Ekicic
aSchool of Business, Gonzaga University, Spokane, Washington, USA;bDepartment of Strategy and Management, Norwegian School of
Economics, Bergen, Norway;cSchool of Business, Bilkent University, Ankara, Turkey
ABSTRACT
The influence and use of the country-of-manufacture (COM) information on purchase decisions is examined in Norway and the USA in a nonlaboratory setting. Ethnocentrism, dependence on imported products, market size, and cultural difference are variables that may have led to differences in measured behaviors between Norway and the USA. Respondents in Norway showed less ethnocentrism, were less aware of COM, and showed no difference in the rating of COM importance, but cited self-reported COM as a purchase influencing factor more frequently than consumers in the USA. The overarchingfinding is that COM is rarely used by the studied consumers in actual purchase decisions with little difference found between Norway and the USA.
KEYWORDS
Consumer behavior; consumer ethnocentrism; country of manufacture; country of origin; culture; Norway; USA
Introduction
The country-of-origin effect has been defined by Bilkey and Nes (1982) as the influence that a product’s
perceived country of origin exerts on consumers’ eval-uations of products. Influence on product evaleval-uations has been observed for other “country” variables such as the country of manufacture (COM), country of design, country of parts, country of assembly (Chao
2001; Johansson and Nebenzahl1986), and country of brand origin (Balabanis and Diamantopulos 2008; Hamzaoui-Essoussi and Merunka 2007; Han and Terpstra1988). The current study focuses specifically
on the influence of the country of manufacture (COM), the“made in” information on a product label, on product evaluations, while drawing on the broader spectrum of the country-of-origin research to inform the study. COM is the focus of our attention in this study for several reasons. COM labeling is virtually a universal requirement, facilitating cross-cultural examination. Also, in this research, we wanted to examine consumer’s use of country information immediately available at the point of purchase. COM is an objective and readily accessible piece of such information. The equivocal nature of prior research also highlighted COM as a research focus and as the
best vehicle for the present research. Extant research has examined a plethora of variables pertaining to the COM effect including its antecedents, moderators, mediators, and outcomes (e.g., see Liefeld1993; Peter-son and Jolibert1995; Pharr2005; Verlegh and Steen-kamp 1999, for overviews). Consumers primarily use the country-of-origin information, in its various forms, as an indicator of product quality and of risk reduction (Bilkey and Ness 1982; Hong and Wyer
1989). However, various studies have shown that country of origin does more than signal in the quality and risk reduction area: it has also been shown to pos-sess symbolic, value-expressive, and emotional aspects (Batra et al. 2000; Laroche, Bergeron, and Goutaland
2003; Oberecker and Diamantopoulos 2011; Steenkamp, Batra, and Alden 2003; Verlegh and Steenkamp1999).
The COM effect has revealed itself in a multitude of studies of the topic (see Peterson and Jolibert 1995). However, literature suggests that further investigation is needed to clarify the scope and the boundary condi-tions of the effect. A number of recent studies indicate that consumers’ concern for the COM as a predictor of product quality is declining (Leclerc, Schmitt, and Dube1994; Samiee, Shimp, and Sharma2005; Usunier
CONTACT James G. Helgeson [email protected] School of Business Administration, Gonzaga University, 502 E. Boone Ave, Spokane, WA 99258-0009, USA.
© 2017 Taylor & Francis Group, LLC
2017, VOL. 29, NO. 3, 179–193
and Cestre 2007). Notably, the effect of diminishing importance of COM information has been docu-mented mostly in developed country-markets (USA, UK, etc.). In an exploratory fashion, the current research moves toward examining COM differences between small and large developed markets that have disparate dependence on imported products.
Specifically, the research reported here examines the developed countries of Norway and the USA rela-tive to COM awareness, importance, and use in con-sumer decision-making. Dependence on imports and several cultural variables, as well as consumer ethno-centrism, which vary between the two studied coun-tries, are advanced as rationale for hypothesized differences. Note that ethnocentrism is presented as one of the most important factors affecting consumer attitudes toward foreign products (Altintas and Tokol
2007; Shimp and Sharma1987) with much research of the construct over the years (e.g. Cilingir and Basfirinci 2014; Durvasula, Andrews, and Netemeyer
1997; Netemeyer, Durvasula, and Lichtenstein 1991; Sharma, Shimp, and Shin1995etc.). Along with con-sumer ethnocentrism, this research seeks to provide insight into the importance of brand and retailer repu-tation as choice criteria in Norway versus the USA and the relationship of these variables with the COM variable.
Finally, this study makes a contribution by investi-gating the difference between the two countries in consumers’ awareness of the COM of their purchases and in COM influence on consumer decision-making in natural (nonlaboratory) settings. Previous research has shown that when COM is the only extrinsic qual-ity cue available (vs. multiple cues, including price, brand, etc.) or when respondents were presented with a verbal description of the product (vs. an actual prod-uct in its physical form), the COM effect size tends to be artificially inflated (Liefeld 1993; Peterson and Jolibert1995). So, many of the COM studies published have utilized single-cue designs and many used verbal descriptions. By interviewing consumers in nonlabor-atory settings, the present study provides a more accu-rate account of the extent of COM influence on purchase behavior.
Background and bases for hypotheses
At the broadest level, cue utilization theory (Olson and Jacoby1972) provides an underlying base for this
research. Olson and Jacoby (1972) separate the prod-uct-related information cues into two categories: intrinsic (e.g., product shape, performance, texture, etc.) and extrinsic (e.g., price, brand name, warranties, etc.). Since product quality rarely can be reliably assessed prior to purchase, prudent consumers have to rely on intrinsic and extrinsic cues as indicators of product quality and to minimize purchase risk. COM information is an extrinsic cue (Bilkey and Ness1982; Han and Terpstra 1988; Hong and Wyer 1989) that can be used by consumers for prepurchase evaluation.
Though there may be diminishing use of COM information, the use of COM is not unequivocal. On one hand, consumers state that they are interested in and increasingly pay attention to the COM informa-tion. As an example, in 2007, Gallup Poll reported that 72% of Americans claimed that they were paying increased attention to where the products they purchase are produced (Vence2007). In 2013, a New York Times poll found that two-thirds of Americans said that they check labels to see if they are buying American goods with almost half of the respondents claiming that they were willing to pay more for the American-made garments. On the other hand, these statements are in contrast to evidence of the opposite effect provided by retailers who did notfind American-made goods gener-ating better sales than the lower-priced imported com-petition (Clifford2013).
On the academic side, a number of recent studies confirm the presence of the COM influence on prod-uct evaluations and even consumers’ willingness to pay a price premium for a more favorable country of provenance (e.g., Koschate-Fischer, Diamantopoulos, and Oldenkotte 2012). These academic findings are countered by the skeptics who claim that consumers’ concern for COM as a predictor of product quality is declining (Leclerc, Schmitt, and Dube 1994; Saimee
2011; Samiee, Shimp, and Sharma2005; Usunier and Cestre 2007), that consumers are for the most part unaware of the origin of the products in their shop-ping carts (Liefeld2004), or that consumers could not correctly identify the country of origin for a range of familiar brands (Balabanis and Diamantopoulos
2008). Notably, the effect of diminishing importance of COM information (e.g., Balabanis and Diamanto-poulos 2008; Liefeld 2004) has been documented in culturally similar (Canada, USA, UK, etc.) countries that are categorized in the GLOBE project as part of the Anglo cultural cluster (House et al.2004).
At the same time, research suggests that the various aspects of the country-of-origin effect work differently at different geographical locations. Specifically, culture (Gurhan-Canli and Maheswaran 2000), country’s
stage of economic development (Batra et al. 2000; Hamzaoui Essoussi and Merunka 2007; Reardon, Miller, Vida, and Kim2005; Sharma2011), ethnocen-trism (Cilingir and Basfirinci 2014; Durvasula, Andrews, and Netemeyer 1997; Parker, Haytko, and Hermans 2011; Pecotich and Rosenthal 2001), or historical events that resonate most profoundly with certain populations (Klein, Ettenson, and Morris
1998) were found to interfere with the positive or negative influence that country of origin exerts on consumers’ evaluation of products.
As noted, many of the studies that suggested the decline of consumers’ reliance on the country of origin, including the COM information (e.g., Liefeld 2004; Samiee2011; Usunier and Cestre2007) were conducted in the developed, culturally close cluster of countries belonging to the so-called“Anglo” cultural cluster (e.g., Canada, the UK, the USA) (House et al.2004). In our study, we compare consumers’ responses collected in the USA to those collected in Norway. These countries are both categorized as developed economies. However, there are notable differences between the two countries with regard to size of economy, dependence on imports, as well as some cultural variables.
Asking consumers about what is in their actual shopping cart and considerations that influenced their real-life purchase decisions, as done here, allows for investigation of the COM effect within a realistic, rich, context. This approach allows for more accurate, bet-ter, understanding of COM influence on consumer behavior especially when coupled with comparing the role of the COM information cue across two devel-oped economies, Norway and the USA, that display some economic and cultural differences.
Greater reliance on country-of-manufacture information in the USA
Market differences
Size of market and concomitant reliance on imports can influence consumer decision-making. In looking at the two developed economies, Norway and the USA, we see the following differences: Population, Norway 5.14 mil-lion-USA 318.9 million; Gross Domestic Product (GDP), Norway $500. 1 billion-USA $17.42 trillion;
Imports of goods and services as a percent of GDP, Nor-way 29.6%-USA 16.5% (World Bank 2014). In other words, consumers and industrial buyers in Norway must have had to rely on imported products more often (com-pared to their USA counterparts) because the smaller economy of Norway was not producing as full of a spec-trum of products as the USA economy. It can be pro-posed that the greater dependence on imports in the economy may desensitize consumers to COM informa-tion in Norway versus the USA. Imports in the Norwe-gian economy are more the norm than in the USA and thus not as much of concern or consideration in con-sumer purchases. Imports are more common, more a fact of life, less a novelty in Norway than the USA. Thus, reliance on imported consumer goods should desensitize consumers in the smaller developed market Norway to the presence of the COM information.
A final economic point of comparison for these two countries is the Gini index. A higher index number on this variable indicates greater income distribution inequality. The USA is classified as moderately high at 45.0 (2007) whereas Norway has one of the lowest Gini measures at 25.0 in the world (2008). This higher level of income inequality may indicate that more care would need to be taken by consumers in the USA than in Norway to effectively use the resources one is allot-ted, perhaps using decision-making variables more completely and closely including COM information.
Cultural differences
Besides the distinction between Norway and the USA along the lines of economy size and import depen-dence, there are general cultural differences that make the two countries candidates for comparison regard-ing COM awareness, importance, and use.
We can turn to Hofstede’s (Hofstede 2001; Hofstede Center 2015) cultural dimensions for cul-tural comparisons. The Hofstede 6-D Model consists of the following, briefly defined, cultural variables:
Masculinity: The extent that the society is driven by competition, achievement, and success, wanting to be the best versus liking what you do (Feminine).
Long Term: The extent a society maintains links to the past while dealing with the challenges of the pres-ent and future.
Individualism: The extent that a society maintains interdependence among its members. That is, it is the individual’s self-image defined in terms of “I” (indi-vidual) or“we” (collective)?
Indulgence: The extent to which people try to con-trol their desires and impulses.
Uncertainty Avoidance: The extent to which the members of the culture feel threatened by ambiguous or unknown situations and have created beliefs and institutions to avoid them.
Power Distance: The extent to which the less pow-erful members of institutions and organizations within a country expect and accept that power is distributed unequally. (Hofstede2001).
A brief profile of Norway along the lines of the Hof-stede 6-D Model reveals that Norway is: the second most Feminine culture of those studied, relatively low on Long Term perspective, Individualist, middle of the road on Indulgence versus Restraint and on Uncertainty Avoidance, and is low on Power Distance. A brief profile of the USA along the lines of the Hofstede 6-D Model reveals that the USA is: high on Masculinity, low on Long Term perspective, one of the highest of the studied countries on being Individu-alist, an Indulgent culture, low on Uncertainty Avoid-ance, and fairly low on Power Distance.
These profiles indicate tension in each culture with some 6-D variables pulling toward more examined consumer decisions, with concern for COM informa-tion for instance, and other variables indicating less examined consumer decisions. Summing up the com-parison of Norway versus the USA on these variables, we see: 1) The Masculine USA trying to“win” even in a shopping context and therefore investing time in consumer decisions and use of the full range of cues to make winning decision. Whereas Feminine Norway may notfind a need for that competitive urgency. 2) The USA scored lower on Long Term perspective than Norway and thus is more likely to view changes (new countries of manufacture?) with greater suspi-cion. 3) The USA with one of the highest scores on Individualism and a “look after themselves” attitude would lean toward looking out for COM information. 4) The USA being categorized as Indulgent may be less restrained in their consumer decisions and more laissez faire in the use of COM than for Restrained Norway. 5) The USA and Norway are very close to equal on Uncertainty Avoidance and no difference is indicated regarding COM usage from their scores. 6) The Power Distance variable is low or fairly low for Norway and the USA, respectively, and this variable would indicate equivocal potential differences in the use of COM.
Consumer ethnocentrism differences
Consumer ethnocentrism (Shimp and Sharma 1987) involves beliefs about the appropriateness of purchasing foreign-made products. For ethnocentric consumers, not only are domestic products viewed as superior, but purchasing imports is viewed as morally wrong because it hurts the domestic economy and causes loss of jobs (Shimp and Sharma 1987). Sharma (2011) found that ethnocentrism is negatively associated with product evaluations and purchase intentions for imported prod-ucts irrespective of the prodprod-ucts’ COM or of the objec-tive quality of the products being evaluated.
The rationale advanced here in the “Introduction” section regarding awareness, importance, and use of COM, coming off the discussion of size of the econ-omy, reliance on imports, and cultural differences, would speak to anticipated differences in consumer ethnocentrism between Norway and the USA. From this discussion, the proposition can be put forth that consumers in Norway would be likely to show lower levels of ethnocentrism than their counterparts in the USA. Finding such a difference from measuring the construct in both countries would augment, with a measured construct, the theory bases and provide additional support for hypotheses dealing with the COM information in consumer decision-making for Norway versus the USA.
In total, the above considerations regarding market size, import dependence, and the cultural differences between Norway and the USA suggest that:
H1: Respondents in Norway versus the USA will have lower ratings on ethnocentrism.
An ethnocentric consumer in a smaller developed country-market would be likely to experience cogni-tive dissonance between “what is morally correct to buy” (a domestic product) and what is available in a store (foreign-made products). To reduce such cogni-tive dissonance, a consumer would have to reevaluate and discount the importance of “buying domestic.” Such a market environment would be conducive to consumers in smaller developed country-markets becoming“COM agnostics” where the COM informa-tion is understood but written off as something less important, secondary, to other sources of information about the product.
Now, considering the above discussion regarding market size, import dependence, and cultural
differences, the following additional insights based on ethnocentrism can be added. Prior research has found that higher levels of ethnocentrism were associated with a predisposition to purchase domestic products and the use of country-of-origin information (Balabanis and Diamantopoulos 2008; Netemeyer, Durvasula, and Lichtenstein 1991; Orth and Firbasova 2003; Sharma
2011; Shimp and Sharma1987) while having a negative effect on attitudes toward and purchase intentions regarding foreign products (Durvasula, Andrews, and Netemeyer 1997; Klein, Ettenson, and Krishnan 2006, Kwak, Jaju and Larsen 2006; Netemeyer, Durvasula, and Lichtenstein 1991). Thus, considering the antici-pated results of measuring ethnocentrism, with lower levels expected in Norway versus the USA, and the market and cultural differences presented above, the following three hypotheses are advanced:
H2: Respondents in Norway versus the USA will have lower awareness of the country of manufacture of their purchases.
H3: Respondents in Norway versus the USA will give lower ratings to the importance of the country-of-manu-facture information.
H4: Respondents in Norway versus the USA will less fre-quently cite the country of manufacture as a factor influ-encing their purchases.
Reliance on alternative quality cues
Obviously, COM information is not sufficient for evalu-ation of a product (Phau and Suntornnond2006). For instance, research shows that both brand and COM information exert influence on product evaluations when consumers have access to a variety of information about the product (Wall, Liefeld, and Heslop 1991). Consumers are likely to give different weights to deci-sion cues (e.g., COM vs. brand vs. retailer’s reputation).
Again, following the rationale for H2–H4 above, market size, import dependence, and cultural variability are likely to come into play regarding use of decision-making criteria. If, as proposed via the rationale leading to H2, H3, and H4, consumers in Norway are less aware, show less importance, and use COM less than their USA counterparts, then that would lead to the idea that consumers in Norway may use other product cues more readily than their USA counterparts.
H5: Respondents in Norway versus the USA will give higher ratings to the importance of the brand.
H6: Respondents in Norway versus the USA will give higher ratings to the importance of the retailer reputation.
Other influence of consumer ethnocentrism
As noted, prior research has found that higher levels of ethnocentrism were associated with a predisposi-tion to purchase domestic products and the use of country-of-origin information (Balabanis and Diamantopoulos 2008; Netemeyer, Durvasula, and Lichtenstein 1991; Orth and Firbasova 2003; etc.) while having a negative effect on attitudes toward and purchase intentions regarding foreign products (Durvasula, Andrews, and Netemeyer 1997; Klein, Ettenson, and Krishnan 2006, Kwak, Jaju and Larsen
2006). This leads to the proposal that highly ethno-centric consumers are more likely to search for and be aware of the product’s COM information because of their need to ensure that they will not unknow-ingly purchase “inappropriate” foreign-made prod-ucts. For the same reason, ethnocentric consumers are likely to give higher ratings to the importance of COM information.
The discussion above aside, the relationship between COM and consumer ethnocentrism is very complex (Hamin and Elliott 2006; Hsieh 2004). Some propose that COM and consumer ethnocen-trism should not be examined without consideration of level of economic development (Hamin and Elliott
2006; Hsieh 2004: Yagci 2001). The hypotheses that follow do not make a distinction between Norway and the USA. They stand on the rationale advanced above. However, the data will be analyzed separately by country as it was collected as validation of the results across countries and cultures. As with hypoth-eses H2, H3, and H4, the next three hypothhypoth-eses examine COM awareness, COM importance, and COM as a purchase influencing factor, and as a crite-rion for product selection in simple relationships as follows:
H7: Respondent ethnocentrism will be positively related to awareness of country of manufacture of purchases. H8: Respondent ethnocentrism will be positively related to the ratings of the importance of the country-of-manu-facture information.
H9: Respondent ethnocentrism will be positively related to greater frequency of citing country of manufacture as a factor influencing purchases.
Methods
The data were collected in Norway (small, import dependent, developed market) and in the USA (large, less import dependent, developed market) by inter-viewing consumers shortly after they made a purchase. Comparison of two developed countries differing in their market size, import dependence, and cultural foundation was of primary interest to us. The data were collected by trained graduate students via mall intercept interviews. Consumers were approached when they were exiting stores with their purchases. The students conducting the interviews attended a training session during which they were provided with the interview script.
As for sample size, 224 usable mall intercept responses were obtained in Norway, and 272 were obtained in the USA. The questionnaires and the respondents’ open-ended answers were translated to and from the Norwegian language by the local collab-orators. Respondents’ participation in this study was voluntary, and no rewards were provided for partici-pation. Student interviewers were rewarded with par-tial course credit.
Procedure and measures
Using a modified version of the Liefeld (2004) sur-vey, interviewers asked respondents to indicate the most expensive item in their shopping bag or cart. Product categories such as housing, gasoline, and public transportation, for instance, for which the COM cannot play a role in the choice process, were excluded from the data collection (Liefeld
2004).
At the next stage of the interview, respondents were asked: “When you were shopping for [name of the item], what did you consider when making your choice?” The self-reported, unprompted response was coded into one of the predetermined categories: price, brand, quality, retailer, COM or, if the interviewers felt that the response did not fit any of these catego-ries, the answers were recorded verbatim for subse-quent classification. The interviewers were instructed to make two more probes:“Did you consider anything else in your choice?” and record the answers in the same manner as above. Therefore, up to three self-reported factors influencing purchase decisions were recorded per respondent.
The COM awareness was measured through the question:“Do you know where [name of the product] was made?” with response options being yes, no, and not sure. If respondents felt that they knew the COM of their purchase, they were asked to state it, and their answers were recorded. They were then asked to indi-cate the source of their knowledge with the response options being: looked at the package, purchased before, guessed, and other.
To verify the accuracy of consumers’ assumptions about the product’s COM, the interviewers asked: “May I see where this product was made?” Then, the interviewers checked the packaging for the“made in” information.
Two measures, each consisting of three items, were developed to capture respondents’ opinion about COM information importance and brand importance as criterion for product selection, with responses recorded onfive-point Likert-type scales ranging from 1D strongly disagree to 5 D strongly agree. The COM importance items were:
1. The“made in” information is the best indicator of product performance.
2. It is important to know in what country the product was made.
3. I usually pay attention to the “made in” infor-mation on products’ packaging.
The brand importance items were:
1. I rely on brand names and on my knowledge about the brands as indicators of quality. 2. A strong brand name provides all the assurance
you need that the product will perform well. 3. What a brand says about its performance is
usu-ally true.
Finally, a measure of retailer’s reputation impor-tance was included in the study. This was a single item measure that stated:
1. A retailer’s reputation is a good promise of the quality of products sold by the retailer.
Responses to each of the three-item measures were averaged to form the scores of COM Importance and Brand Importance. Retailer’s Reputation Importance was the single item retailer-related variable just described.
Next, respondents completed the 10-item version of the Consumer Ethnocentrism Scale (Shimp and Sharma 1987) and indicated their gender, age, educa-tion, and income.
Analysis and results
Demographic profile of the respondents
As afirst step of the analysis, demographic character-istics of respondents from the two countries were compared (seeTable 1).
Overall, education and income levels in our sam-ples tended to be higher than the national statistics. Sampling done via mall intercept interview might have overrepresented the wealthier and more educated consumers simply because they were the ones at the mall shopping.
Although certain bias of results obtained via convenience sampling methods is unavoidable, it is not always undesirable, depending on the purpose of the study. In the case of the current research, by asking the wealthier populations about their reli-ance on COM information, we could be sure that we were getting answers from the part of the popu-lation who were most familiar with and had experi-ence buying imported products. Likewise, asking a more educated populous about their purchase behaviors in regard to foreign-made products, rep-resents a more stringent test of several of our hypotheses. This comment is based on extant research that found, for instance, that greater con-sumer expertise leads to less reliance on country-of-origin information (Maheswaran 1994).
Products purchased
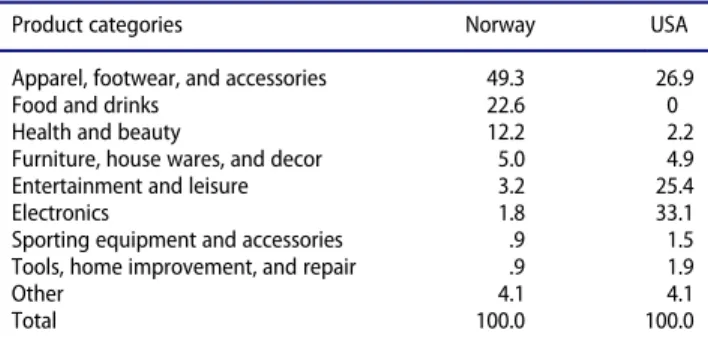
Two independent coders classified all reported pur-chases into nine product categories (seeTable 2). Any disagreements were resolved through discussion.
In order of percent of purchases, the mall shoppers in Norway purchased apparel and footwear type items (49.3%), food and drink (22.6%), health and beauty type items (12.2%), furniture and housewares type items (5.0%), and so forth; see Table 2. For the USA, the order of purchases was electronics (33.1%), apparel and footwear type items (26.9%), entertain-ment and leisure items (25.4%), furniture and house-wares type items (4.9%), and so forth. Note that many mall locations in the area of Norway where the data were collected have supermarket type stores as part of the mall. This resulted in the high level of food and drink items in the shopping carts in Norway (22.6%). This is as opposed to the location sampled in the USA where supermarkets were not shopping mall retailers. Thus, the 0% of the shopping carts in the USA con-tained food or drink items. Again, seeTable 2.
Hypotheses testing
To test H1, first the appropriateness of the 10-item Consumer Ethnocentrism Scale (CET) (Shimp and Sharma 1987) had to be assessed. The CET scale had high reliabilities, with Cronbach’s alpha being .89 in Norway and .91 in the USA.
The Norway sample of respondents showed lower levels of ethnocentrism on the CET scale (MD 2.14) versus USA respondents (MD 2.85) (analysis of vari-ance—ANOVA, (1, 494), F D 91.69, p < .001). Thus, H1 is supported. This finding provides additional rationale, and augments with a measured construct, the theory bases for next three hypotheses as men-tioned earlier.
Table 1.Demographic characteristics of respondents.
Variable Categories Norway USA
Number of respondents 224 272 Gender, % Male 25.0 50.4 Female 70.1 49.3 Not reported 4.9 .3 Age, % <24 42.4 26.5 25–34 8.0 16.9 35–44 16.0 24.2 45–54 11.2 18.4 55–64 10.3 11.0 65–74 6.7 2.6 < 75 1.8 0 Not reported 3.6 .4
Highest < High school 19.2 10.3
education High school 17.4 15.8
level, % Attend college 16.2 37.1 College graduate 25.4 25.0 Attend graduate school 8.0 4.0 Graduate degree 8.9 7.1 Not reported 4.9 .7 Income, % < $ 25,000 21.9 23.9 $ 25,000–49,999 9.8 21.7 $ 50,000–74,999 20.1 23.2 $ 75,000–99,999 15.6 18.7 > $100,000 23.7 10.3 Not reported 8.9 2.2
Table 2.The products purchased, as percentage of all reported purchases.
Product categories Norway USA
Apparel, footwear, and accessories 49.3 26.9
Food and drinks 22.6 0
Health and beauty 12.2 2.2
Furniture, house wares, and decor 5.0 4.9 Entertainment and leisure 3.2 25.4
Electronics 1.8 33.1
Sporting equipment and accessories .9 1.5 Tools, home improvement, and repair .9 1.9
Other 4.1 4.1
To test whether respondents in Norway versus the USA had lower awareness of COM of their purchases (H2), the responses to a “Do you know where the product was made?” question were re-coded. The “yes” answers were coded as 1, and the “no” and “not sure” answers were coded as 0, resulting in a dichoto-mous COM Awareness variable.“Not sure” was coded as a“no” in that the question was asked immediately after a purchase. Asking the question at that time cap-tured prior knowledge of COM or checking for it at the time of purchase. This dichotomization approach also resulted in a more stringent test of H2 than other approaches. The level of COM awareness in Norway was lower (18.3%) than that in the USA (21.0%). This difference was confirmed as significant via a chi-square test (x2 (1, N D 494) D 6.81, p < .05). Thus, the data support H2. Norwegian respondents had lower awareness of COM information than their USA counterparts.
On a side note, subsequent verification of the accu-racy of consumers’ awareness of the “made in” informa-tion against the actual COM of their purchases revealed that the percentage of correct identification was 75.0% in Norway and 62.4% in the USA. This was not a signif-icant difference (x2
(1, ND 161) D 2.51, NS). Likewise, a Z test of these proportions proved to be nonsignificant.
Our study provides insight into the process of acquiring the COM information. Of those respond-ents who thought that they were aware of the COM of their purchases, most reported that they learned it by looking at the package (30.8% Norway, 22.9% USA). Another frequently cited source of COM information was that the consumer “already knew the product’s COM or purchased it before,” (30.8% Norway, 15.6% USA). Finally, a good portion of respondents in each country told the interviewers that they just“guessed” the product’s COM (26.2% Norway, 60.6% USA). Together, these three response categories explain around 90% of the COM awareness in the two studied countries.
To test H3, first, the appropriateness of the 3-item COM Importance scale had to be assessed. Cronbach’s alpha for the 3-item COM Importance scale exceeded the recommended minimum .60 level of reliability for exploratory research (Bagozzi1994). Specifically,
Cron-bach’s alpha for the COM Importance measure was .71 in Norway and .76 in the USA. The COM Importance levels in the USA and Norway were literally identical
(MD 2.71) in this study. Thus, H3 was not supported. There was no difference in COM Importance found in respondents from the two countries.
In the process leading to H4 testing, two indepen-dent coders categorized all open-ended, self-reported, answers explaining respondents’ reasons behind pur-chase decisions. Recall that respondents were probed three times to determine the variables that they used in making their purchase decision. In addition to the originalfive reasons (i.e., price, brand, quality, retailer, and COM), the following categories were developed: style and fashion, “just liked it” capturing hedonic properties, people’s (excluding retailer’s) influence, advertising, and “other.” The count of all COM men-tions from the three probes relative to the number of respondents in each country was the measure estab-lished to test for H4. Contrary to H4, the percent of respondents in Norway that cited COM as a purchase influencer from the three probes was 1.8% of the respondents (i.e., 4 respondents) versus 0% (i.e., 0 respondents) in the USA (seeTable 3).
Even though an extremely low number of respond-ents used COM information as a decision-making var-iable, the nonparametric Fishers exact test could be applied to evaluate the sparse data obtained. Fisher’s exact test shows a significant difference in the pattern of responses obtained. This indicates that there was a significant difference in the use of COM information by respondents in Norway versus the USA albeit in the opposite direction than hypothesized (df1, N D 484, (4/214, 0/270), pD .039). Thus, H4 is not supported.
Table 3.Frequency of the country of manufacture (COM) men-tion in comparison to the five most frequently cited purchase influencing factors (% of all respondents).
Norway USA
Probe 1 Style, fashion (35.7%) Price (24.6%) Quality (28.6%) “Just liked it” (20.2%) Price (24.1%) Brand (19.9%) Brand (8.9%) Style, fashion (18.5%) Retailer (4.0%) Quality (12.1%) COM (1.3%) COM (0%) Probe 2 Price (18.8%) Price (20.2%)
Quality (18.3%) Quality (12.9%) Brand (11.2%) Style, fashion (9.2%) Style, fashion (7.1%) Brand (6.3%) Retailer (6.3%) Retailer (.7%) COM (0%) COM (0%) Probe 3 Quality (5.4%) Price (4.8%)
Retailer (4.5%) Style, fashion (4.0%) Price (4.0%) Brand (3.3%) Brand (2.7%) Quality (2.9%) Style, fashion (.4%) Retailer (1.1%) COM (.5%) COM (0%)
The paucity of self-reported use (nonuse?) of COM information, as determined in three open-ended probes of consumers’ decision-making variables at the point of purchase, is the important finding of this research. Price, brand, and quality were the most fre-quently named decision factors in both countries and by far surpassed the frequency with which COM was mentioned as a purchase influencing factor (Table 3).
Hypotheses H5 and H6 predicted that respondents in Norway would give higher ratings to the impor-tance of the brand (H5) and the retailer’s reputation (H6) as predictors of product performance, than respondents in the USA. To test H5 and H6, ANOVA was used to compare the developed scale means obtained in Norway with those obtained in the USA.
To test H5,first, the appropriateness of the 3-item Brand Importance scale had to be assessed. Cron-bach’s alpha reached satisfactory levels for Brand Importance scale: .73 in Norway and .87 in the USA. As will be recalled, Retailer’s Reputation Importance was measured in both countries with a single item measure.
Brand Importance was rated higher in Norway (MD 3.60) than in the USA (M D 3.16), and this dif-ference was significant (ANOVA, (1, 494), F D 26.26, p< .001). Thus, support of H5 was displayed.
Recall that H6 predicted that respondents in Norway versus the USA market would give higher rat-ings to the Retailer’s Reputation Importance. Respondents in Norway rated Retailer’s Reputation as significantly more important (M D 3.92) compared to respondents in the USA (M D 3.39) (ANOVA, (1, 494), F D 35.73, p < .001). Thus, the data provided support to H6.
In testing H7, which explores the relationship between respondent Ethnocentrism and COM aware-ness, no relationship was found in the combined Nor-way and USA data between Ethnocentrism and COM Awareness (N D 491, Wald x2 D 0.28, p D .596). Thus, no support to H7 was found. This was deter-mined via a logistic model with the“yes” answers to the “Do you know where the product was made?” question coded as 1, and the “no” and “not sure” answers coded as 0, resulting in a dichotomous COM Awareness variable. The model included main effects of country and Ethnocentrism and the interaction effects between country and Ethnocentrism. Also, from the model so constructed, no difference between Norway and the USA was found in each country’s
individual respondent’s relationship between Ethno-centrism and COM Awareness (N D 491, Wald x2 D 0.58, p D .447).
A strong positive relationship was found in the combined Norway and USA data between Ethnocen-trism and Importance of COM (ND 491, Wald x2 D 72.19, p D .0001). This was determined via a general linear model, which included main effects of country and Ethnocentrism and the interaction effects between country and Ethnocentrism. Thus, H8 is supported.
Also, from the model so constructed, no difference between Norwegian (r D .350, p < .001 for relation-ship) and the USA (rD .365, p < .001 for relationship) respondents was found in each countries’ individual relationship between Ethnocentrism and Importance of COM (ND 491, Wald x2 D 0.03, p D .866).
H9, which posited a positive relationship between Ethnocentrism and citing COM as a purchase influ-encing decision factor, could not be tested because of the extremely low level of respondents saying they used COM information. As will be recalled, there were only four mentions of the use of COM information in the three probes of the respondents from the two countries.
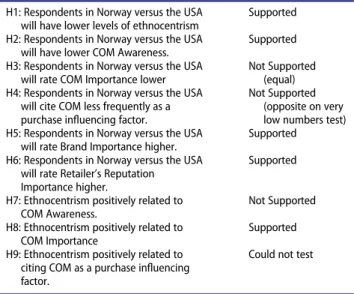
The summary of hypothesis testing is presented in
Table 4.
Discussion
In this research, Norway, a small developed market more dependent on imports, was contrasted to the USA, a large developed market, relatively less
Table 4.Results of hypothesis tests. H1: Respondents in Norway versus the USA
will have lower levels of ethnocentrism
Supported H2: Respondents in Norway versus the USA
will have lower COM Awareness.
Supported H3: Respondents in Norway versus the USA
will rate COM Importance lower
Not Supported (equal) H4: Respondents in Norway versus the USA
will cite COM less frequently as a purchase influencing factor.
Not Supported (opposite on very low numbers test) H5: Respondents in Norway versus the USA
will rate Brand Importance higher.
Supported H6: Respondents in Norway versus the USA
will rate Retailer’s Reputation Importance higher.
Supported
H7: Ethnocentrism positively related to COM Awareness.
Not Supported H8: Ethnocentrism positively related to
COM Importance
Supported H9: Ethnocentrism positively related to
citing COM as a purchase influencing factor.
dependent on imports. Norway is also categorized as a much more feminine culture, more restrained, and higher on uncertainty avoidance with lower individu-alism and power distance than the USA, which is cate-gorized as high on masculinity and individualism, more indulgent, and lower on uncertainty avoidance and higher on power distance than Norway (Hofstede Center2015).
As hypothesized, respondents in Norway showed lower levels of ethnocentrism than their USA counter-parts. This result was anticipated because of the Norway’s greater dependence on imports, market size, and cultural differences, as mentioned above.
Also, as hypothesized, the sampled respondents in Norway showed less awareness of COM information than their counterparts in the USA. Respondents in the two countries showed no difference in their assessed importance of COM information. Contrary to the hypothesis, Norwegian consumers used COM in their decision-making more than their USA coun-terparts, albeit based on a very low number of respondents that actually used COM in their self-reported decision-making.
The low number of respondents that identified COM as a purchase decision variable is really the primaryfinding of the present research. In a realistic setting, with sampled respondents contacted immedi-ately after making a purchase via a mall intercept pro-cedure, it was found that COM information was a very unimportant consideration in consumer self-reported decision-making. These results were similar to those of prior research. Studies conducted in devel-oped markets arefinding that consumers’ concern for COM is, apparently, declining (Balabanis and Dia-mantopulos 2008; Leclerc, Schmitt, and Dube 1994; Samiee2011; Samiee, Shimp, and Sharma2005; Usu-nier and Cestre 2007). In a study by Liefeld (2004), the percent of consumers self-reporting the influence of COM on purchase decisions was as low as 1.7% in the USA and Canada, with only 6.5% of interviewed consumers aware of the COM of their purchases. In this current study, the self-reported COM influence levels were low in the developed countries examined as well (1.8% in Norway and 0.0% in the USA). The Liefeld (2004) USA percent (1.7%) versus the percent reported in this research (0.0%) may even represent a decrease in the use of COM information that occurred between the time of the two studies. Thus, besides the head-to-head comparison of COM information in
Norway versus the USA, these results provided an exploratory view of the use of COM information, col-lected in a naturalistic setting, comparing a small developed country to a large developed country.
In order to properly interpret the self-reported lev-els of COM use in this study, it is important to keep in mind that this research was conducted in a natural (nonlaboratory) setting, as noted. Under natural shop-ping conditions, COM information competes for con-sumer’s attention with brand name, price, retailer’s reputation, and with physical attributes of the product (Han and Terpstra1988; Hong and Wyer1989; Wall, Liefeld, and Heslop 1991). It is not surprising, there-fore, that the relative weight of COM influence drops in the presence of other competing purchase influenc-ing factors compared to research conducted via sin-gle-cue laboratory studies. Also, some decision cues may be subsumed under primary cues such as price, brand name, retailer dispensing the product etc. in a product schema sort of fashion. Thus, besides the indication from some prior research that use of COM is declining, there is also the position of COM in the hierarchy of consumer used cues that needs consideration.
Why did sampled respondents not use COM information? This study provides some information toward an answer. In Norway, 83.3% of the respond-ents said that it was unimportant or they did not think of it, and in the USA, 71.3% said the same. Of the Norwegian sample, 12.2% said that brand or other variables were more important than COM. Of the USA sample, 24.4% said the same. Table 3 attests to these comments.
The low levels of self-reported COM influence, through three probes of what decision variables con-sumers used, however, were in dissonance with the much higher levels of COM awareness (18.3% Norway and 21.0% USA). For someone who claimed that their purchase decisions were not influenced by COM, our typical respondent exerted a remarkable amount of effort in obtaining the COM information. About half of those respondents who were aware of the COM of their purchases, obtained this information either as a result of deliberate effort at the moment of purchase (“looked at the package,” “asked the salesman,” etc.) or at some point of time in the past (“knew COM from purchasing this product before”).
A few possibilities (that are not mutually exclu-sive) might explain the discrepancy between the
reported influence of COM on purchases and the reported awareness of COM. The first possibility is that the COM information is processed in a largely subconscious manner. Hong and Wyer (1989) found that the country-of-origin information not only had a direct effect on product evaluations, but also stim-ulated subjects to think more about other product attributes, augmenting their effect. This sequential cognitive mechanism of COM effects could produce an influence on decision-making in the absence of a conscious recollection of the“made in” information as a purchase influencing factor. Another possibility is that the COM information becomes incorporated into the schemas of established brands. Extant research has shown that intrinsic and extrinsic brand attributes, benefits, images, attitudes, experi-ences, associations, thoughts, feelings (Keller 2003), as well as personality characteristics (Aaker 1997) become linked to brand schema over time. See Puli-gadda, Ross, and Grewal (2012) for an overview of this concept and development of a brand schematic-ity scale. In line with this theorizing, it seems likely that COM might become incorporated into a brand schema as well. Incorporating COM into a brand schema would effectively render further direct refer-rals to the COM information unnecessary. Never-theless, even though it has been noted in experiments, that provide COM information in an obvious fashion, that COM can influence both cog-nitive and affective brand evaluations (e.g. Herz and Diamantopoulos2013), when left to themselves in a natural environment, and asked to report on their decision-making, COM information use pales rela-tive to the use of other decision cues.
Respondents in Norway rated brand importance and retailer reputation importance higher versus those in the USA. These results shed exploratory light on a “compensation mechanism” consumers might utilize to adjust for the lack of use of COM information. However, higher ratings of the importance of brand and retailer’s reputation in Norway were accompanied by equal ratings of COM importance in both coun-tries. This suggests that respondents in the Norway market might be less certain about the quality of the products sold there and look for easy-to-use predictors of product performance to compensate for COM information.
Additional testing revealed that in both studied countries, COM importance was positively related to
Brand Importance: rD .267(p < .001) in Norway and rD .288 (p < .001) in the USA. This finding supports the view that brand’s COM might become a part of a brand’s schema.
A strong positive relationship was found in the combined Norway and USA data between COM Importance and Brand Importance (N D 496, Wald x2 D 41.32, p D .0001). No difference between Norway and the USA was found in each country’s individual relationship between COM Importance and Brand Importance (N D 496, Wald x2 D 0.44, p D .507). This was determined via a general linear model, which included main effects of country and Brand Importance and the interaction effects between country and Brand Importance.
A strong positive relationship was found in the combined Norway and USA data between COM Importance and Retailer’s Reputation Importance (N D 491, Wald x2 D 23.01, p D .0001). No difference between Norway and the USA was found in each country’s individual relationship between COM Importance and Retailer’s Reputation Importance (ND 491, Wald x2 D 0.87, p D .351). This was deter-mined via a general linear model, which included main effects of country and Retailer’s Reputation Importance and the interaction effects between coun-try and Retailer’s Reputation Importance.
In summary, the relationship between COM Importance and the three variables Brand Importance, Retailer Reputation Importance, and the previously reported Ethnocentrism (see“Hypotheses testing” sec-tion) all displayed a similar pattern of comparison for the two countries. That is: 1) all three variables showed a significant strong positive relationship to COM Importance for aggregated data across the two countries, 2) the two countries separately displayed no significant difference in their relationships between COM Importance and the three variables, and 3) there was a significant difference in the level of the three variables between the two countries.
Though there were differences between Norway and the USA on the three “target” variables, the rela-tionship between COM Importance and the three var-iables indicates similarity between the two countries. It would seem that these similarities provide addi-tional support to how alike the two countries and cul-tures are in consumer decision-making and may speak of schema chunks of information used by respondents in both countries with one variable
triggering another. Perhaps COM exerts its influence in combination with many other extrinsic quality cues (Olson and Jacoby1972), such as the reputation of a brand, reputation of a retailer that sells the brand, price level, etc.
The additional results concerning consumer eth-nocentrism were not unequivocal (i.e., H7, H8, H9). This is not entirely surprising considering, for instance, the complexity of the relationship between COM and consumer ethnocentrism noted by researchers (Hamin and Elliot 2006; Hsieh 2004) and discussed earlier in the paper. Overall, con-sumer ethnocentrism levels were moderate in Norway and the USA (MD 2.14 Norway, M D 2.85 USA, on a 5-point scale) and significantly different as hypothesized. It was hypothesized that consumer ethnocentrism would be positively related to the COM awareness (H7), COM importance (H8), and self-reported COM use (H9). Our analysis showed that ethnocentrism was: 1) not positively related to COM awareness in the combined Norway and USA data with no difference found in the individual country relationships between these variables (H7), 2) positively related to the COM importance ratings in the combined Norway and USA data with no dif-ference found in the individual country relation-ships between these variables (H8), and 3) not testable relative to the self-reported use of COM (H9). Recall that the analysis was not performed on the USA or Norway data due to the negligibly low self-reported use of COM.
At a first glance, it seems puzzling that ethnocen-trism was not related to COM awareness in the com-bined Norway and USA data or the assessment of this relationship by country. These results occurred even though there is a significant difference between Norway and the USA with regard to ethnocentrism and COM Awareness. As we noted before, the ratio of imports to national GDP is much higher in Norway than in the USA. A line of reasoning may be that eth-nocentric respondents in high-import-ratio countries might end up buying imported products because the domestic alternatives are not available or do not per-form at a satisfactory level. To reduce the ensuing cog-nitive dissonance, such ethnocentric consumers might learn to isolate their ethnocentric beliefs from routine purchase decisions.
The contribution of this study goes beyond the head-to-head comparison of Norway and the USA
on a variety of variables, especially the study of con-sumers’ self-reported use of COM information. This research not only specifically tested for evidence of consumers’ reliance on the COM information in Norway versus the USA, a small and a large devel-oped market, but also explored factors that could potentially contribute to this phenomenon. Besides market (e.g., size and import dependence) and cul-tural (e.g., Hofstede’s 6D model and ethnocentrism) variables that might map into these differences, we explored the possibility that other indicators of prod-uct quality (i.e., Brand Importance, Retailer Impor-tance) available to respondents, may work with COM information.
Implications
Of immediate application is the insight into the Norwegian market relative to the USA market. Respondents in Norway showed lower levels of ethno-centrism than those in the USA, were less aware of COM information, but may have used COM informa-tion more (albeit at minimal levels) than their USA counterparts. Respondents in Norway showed greater reliance on certain product attributes such as brands and retailer reputation than those in the USA. But, the facts appear to be that in the developed countries examined, COM was just not important in decision-making.
More broadly, thefindings here suggest managerial implications for international marketing in general. Of primary interest is how little COM information appears to be used by the studied consumers in actual decision-making. Depending on the situation, this may be a concern or a relief to a manager. It may be a concern if the manager was hoping for a demand boost because of a“favorable” COM or a relief because of worry over compensating for an “unfavorable” COM. Another aspect of the lack of use of COM is the fact that the world is becoming a one world market, and more so all the time, and COM may be slipping away from being of general decision-making concern. For other categories of countries (e.g., emerging econ-omies), this may not be the case. And for certain cate-gories or brands of products with a strong country connection (e.g., wine from France, chocolate from Belgium etc.), this may not be the case.
Of course, more research is needed before general comments can be made regarding COM information
in decision-making. If the initialfindings here can be supported more broadly for other developed markets, then marketers may need to consider whether COM information for his or her particular product is even a component of consumer decision-making and if COM is beneficial for that product or not in the range of countries in which it is sold. Also, marketing man-agers may need to pay special attention to positioning foreign brands for emerging markets because consum-ers in these markets may be attuned differently to the “made in” information than consumers in developed markets.
Here is a managerial point to note regarding COM use as a consumer decision-making variable across the countries examined. COM information is a tertiary var-iable at best relative to the varvar-iables respondents were found to use in decision-making in our developed mar-ket sample.Table 3communicates this fact well. Man-agers will need to make sure that the primary variables consumers use in decision-making for their product are perceived appropriately. Building brand and/or retail channel member’s reputations may be rewarded in the market place. After working with these variables, then consider the impact of COM.
The dynamic between COM and ethnocentrism may precipitate some creative marketing decisions in certain markets, say in emerging markets. For instance, product strategies may benefit from “hybrid” approaches were design, production, or assembly may be done in the targeted market country (see Cilingir and Basfirinci 2014). Also, communication strategies would need to be structured to capitalize on the COM and ethnocentrism dynamic in targeted markets.
Future research and limitations
As noted, there appear to be some differences between the respondents from Norway and the USA that may be applicable to the countries as a whole and that need further verification. Although the use of probabilisti-cally drawn national samples is preferable for gener-alizability, cost and availability considerations often lead researchers to use alternative sampling methods. The consumer samples used in our study were conve-nience samples, which of course limit its generalizabil-ity. COM use by the predominantly urban respondents here might be different from that of the residents of rural areas for example. Areas sampled within the countries of interest can have an obvious
impact on results. These comments point up the idea that subcultures within countries may be an interest-ing object of future studies examininterest-ing differences in consumers’ use of COM information.
Due to the nature of this current study, that is mall intercept, with no incentives provided for participa-tion and so forth, the length of the survey had to be limited. This did not allow for exploring many other intriguing characteristics of each country that could have affected the observed results. For instance, future research could examine the direct relationship of some of the many aspects of a country’s cultural orien-tation with the use (or nonuse) of COM information.
As noted above, the primary need for future research is for the exploratory speculations regard-ing developed markets to be validated across addi-tional countries, cultures, and markets. This would be an important continuation of the present research and its generalizability and provide useful managerial implications. Expanding this research to include more countries, with more extreme vari-ance in culture and economic condition, would provide additional beneficial consumer insights. Parsing out the impact of level of market develop-ment, emerging versus developed, from the impact of cultural differences would be an important addi-tional step in the flow of this research.
International marketing managers are likely to benefit from additional studies testing the “brand schema incorporation” and the “subconscious influ-ence” conjectures described herein. This research may involve laboratory “time to response” type studies. Future research could also provide addi-tional insight into the mechanism of COM’s influence on consumer decision-making in nonla-boratory settings. Such studies could perhaps assist in managerial decisions about resource allocation to different parts of the promotion budget (e.g., brand reputation) or spending money on co-op advertising (e.g., to promote retailers’ reputations). Understand-ing the psychological mechanism of COM informa-tion utilizainforma-tion (or nonutilizainforma-tion) will help in the assessment of differences across countries and cul-tures. Breaking COM out for separate study may not be a fruitful area of examination in the global-ized world of today, especially considering the blurred lines between country-of-origin concepts such as country of brand, country of assembly, country of design, and so on and so forth.
Acknowledgment
The authors would like to thank Erika S. Helgeson for her help with data analysis.
References
Aaker, J. L. 1997. Dimensions of brand personality. Journal of Marketing Research 34 (3):347–356.
Altintas, M. H., and T. Tokol. 2007. Cultural openness and consumer ethnocentrism: An empirical analysis of Turkish consumers. Marketing Intelligence and Planning 25 (4):308–325.
Bagozzi, R. P. 1994. Measurement in marketing research: Basic principles of questionnaire design. In Principles of market-ing research: Basic principles of questionnaire construction, Ed. R. Bagozzi, 1–49. Cambridge, MA: Blackwell.
Balabanis, G., and A. Diamantopulos. 2008. Brand origin iden-tification by consumers: A classification perspective. Journal of International Marketing 16 (1):39–71.
Batra, R., V. Ramaswamy, D. L. Alden, J. B. E. M. Steenkamp, and S. Ramachander. 2000. Effects of brand local and non-local origin on consumer attitudes in developing countries. Journal of Consumer Psychology 9 (2):83–95.
Bilkey, W. J., and E. Nes. 1982. Country-of-origin effects on product evaluations. Journal of International Business Stud-ies 13 (1), (Spring/Summer):89–99.
Chao, P. 2001. The moderating effects of the country of assem-bly, Country of parts, and Country of design on hybrid product evaluations. Journal of Advertising 30 (4):67–81. Cilingir, Z., and C. Basfirinci. 2014. The impact of consumer
ethnocentrism, product involvement, and product knowl-edge on Country of origin effects: An empirical analysis on Turkish consumers’ product evaluation. Journal of Interna-tional Consumer Marketing 26 (4):284–310.
Clifford, S. 2013.“That “Made In USA” Premium.” New York Times, Dec. 1, BU1.
Durvasula, S., J. C. Andrews, and R. G. Netemeyer. 1997. A cross-cultural comparison of consumer ethnocentrism in the United States and Russia. Journal of International Con-sumer Marketing 9 (4):73–93.
Gurhan-Canli, Z., and D. Maheswaran. 2000. Cultural varia-tions in country of origin effects. Journal of Marketing Research 37 (3):309–317.
Hamin, H., and G. Elliott. 2006. “A less developed country perspective of consumer ethnocentrism and“country of ori-gin” effects: Indonesian evidence”. Asia Pacific Journal of Marketing and Logistics 18 (2):79–92.
Hamzaoui-Essoussi, L. H., and D. Merunka. 2007. Consumers’ product evaluations in emerging markets: Does country of design, country of manufacture, or brand image matter?. International Marketing Review 24 (4):406–426.
Han, C. M., and V. Terpstra. 1988. Country-of-origin effects for uni-national and bi-national products. Journal of Inter-national Business Studies 19 (2):235–255.
Herz, M. F. and A. Diamantopoulos. 2013. Activation of coun-try stereotypes: Automaticity, consonance, and impact.
Journal of the Academy of Marketing Science 41 (4):400– 417.
Hofstede, G. H. 2001. Culture’s consequences: Comparing val-ues, behaviors, institutions and organizations across nations. Thousand Oaks, CA: Sage.
Hofstede Center. 2015. Hofstede Country Scores, Retrieved fromhttp://geert-hofstede.com/.
Hong, S. T., and R.S. Wyer, Jr. 1989. Effects of country-of-ori-gin and product-attribute information on product evalua-tion: An information processing perspective. Journal of Consumer Research 16 (2):175–187.
House, R. J., P.J. Hanges, M. Javidan, P. W. Dorfman, and V. Gupta (Eds.). 2004. Culture, leadership, and organiza-tions: The GLOBE study of 62 societies. Thousand Oaks, CA: Sage.
Hsieh, M. H. 2004. An investigation of country-of-origin effect using correspondence analysis: A cross-national context. International Journal of Market Research 46 (3):267–295. Johansson, J. K., and I. D. Nebenzahl. 1986. Multinational
pro-duction: Effect on brand value. Journal of International Business Studies 17 (3):101–126.
Keller, K. L. 2003. Brand synthesis: The multidimensionality of brand knowledge. Journal of Consumer Research 29 (4):595–600.
Klein, J. G., R. Ettenson, and B. C. Krishnan. 2006. Extending the construct of consumer ethnocentrism: When foreign products are preferred. International Marketing Review 23 (3):304–321.
Klein, J.G., R. Ettenson, and M. D. Morris. 1998. The animosity model of foreign product purchase: an empirical test in the People’s Republic of China. Journal of Marketing 62 (1):89– 100.
Koschate-Fischer, N., A. Diamantopoulos, and K. Oldenkotte. 2012. Are consumers really willing to pay more for a favor-able country image? A study of country-of-origin effects on willingness to pay. Journal of International Marketing 20 (1):19–41.
Kwak, H., A. Jaju, and T. Larsen. 2006. Consumer ethnocen-trism offline and online: The mediating role of marketing efforts and personality traits in the United States, South Korea, and India. Journal of the Academy of Marketing Sci-ence 34 (3):367–385.
Laroche, M., J. Bergeron, and C. Goutaland. 2003. How intan-gibility affects perceived risk: The moderating role of knowledge and involvement. Journal of Services Marketing 17 (2):122–140.
Leclerc, F., B. H. Schmitt, and L. Dube. 1994. Foreign branding and its effects on products perceptions and attitudes. Jour-nal of Marketing Research 31 (May):263–270.
Liefeld, J. P. 1993. Experiments on country-of-origin effects: Review and meta-analysis of effect size. In Product-Country Images: Impact and role in international marketing, Eds. N. Papadoupulos and L. A. Heslop, 117–156. New York, NY: Routledge.
Liefeld, J. P. 2004. Consumer knowledge and use of country-of-origin information at the point of purchase. Journal of Con-sumer Behavior 4 (2):85–96.
Maheswaran, D. 1994. Country of origin as a stereotype: Effects of consumer expertise and attribute strength on product evaluations. Journal of Consumer Research 21 (2):354–365.
Netemeyer, R. G., S. Durvasula, and D. R. Lichtenstein. 1991. A cross-national assessment of the reliability and validity of the CETSCALE. Journal of Marketing Research 28:320–7. Oberecker, E. M., and A. Diamantopulos. 2011. Consumers
emotional bonds with foreign countries: Does consumer affinity affect behavioral intentions?. Journal of Interna-tional Marketing 19 (2):45–72.
Olson, J. C., and Jacoby J. 1972. Cue utilization in the quality perception process. In Proceedings of the third annual con-ference of the association for consumer research, Venkatesan M., (Ed.), 167–179. Chicago, IL: Association for Consumer Research.
Orth, U. R., and Z. Firbasova. 2003. The role of consumer eth-nocentrism in food product evaluation. Agribusiness 19 (1):137–146.
Parker, R. S., D. Haytko, and C. M. Hermans. 2011. Ethnocen-trism and its effect on the Chinese consumer: A threat to foreign goods?. Journal of Global Marketing 24 (4):4–17. Pecotich, A., and M. J. Rosenthal. 2001. Country of origin,
quality, brand, and consumer ethnocentrism. Journal of Global Marketing 15 (2):31–60.
Peterson, R. A., and A. J. P. Jolibert. 1995. A meta-analysis of country-of-origin effects. Journal of International Business Studies 26 (4):883–900.
Pharr, J. M. 2005. Synthesizing country-of-origin research from the last decade: is the concept still salient in an era of global brands?. Journal of Marketing Theory and Practice 13 (4):34–45.
Phau, I., and V. Suntornnond. 2006. Dimensions of consumer knowledge and its impacts on country of origin effects among Australian consumers: A case of fast-consuming product. Journal of Consumer Marketing 23 (1):34–42. Puligadda, S., W. T. Ross, Jr., and R. Grewal. 2012. Individual
differences in brand schematicity. Journal of Marketing Research 49 (1):115–130.
Reardon, J., C. Miller, I. Vida, and I. Kim. 2005. The effects of ethnocentrism and economic development on the
formation of brand and ad attitudes in transitional econo-mies. European Journal of Marketing 39 (7/8):737–754. Samiee, S. 2011. Resolving the impasse regarding research on
the origin of products and brands. International Marketing Review 28 (5):473–485.
Samiee, S., T. A. Shimp, and S. Sharma. 2005. The limits to consumers’ brand origin recognition accuracy: Implications for the country-of-origin effect. Journal of International Business Studies 25 (3):579–604.
Sharma, P. 2011. Country of origin effects in developed and emerging markets: Exploring the contrasting roles of mate-rialism and value consciousness. Journal of International Business Studies 42:285–306.
Sharma, S., T. A. Shimp, and J. Shin. 1995. Consumer ethno-centrism: A test of antecedents and moderators. Journal of the Academy of Marketing Science 23 (1):26–37.
Shimp, T. A., and S. Sharma. 1987. Consumer ethnocentrism: Construction and validation of the CETSCALE. Journal of Marketing Research 24:280–9.
Steenkamp, J. B. E. M., R. Batra, and D. L. Alden. 2003. How perceived brand globalness creates brand value. Journal of International Business Studies 34:53–65.
Usunier, J. C., and C. Cestre. 2007. Product ethnicity: Revisit-ing the match between products and countries. Journal of International Marketing 15 (3):32–72.
Vence, D. 2007.“Marketers ready for shoppers with a renewed yen for American-made goods.” Marketing News 41 (19):12–15. Verlegh, P. W. J., and J. B. E. M. Steenkamp. 1999. A review
and meta-analysis of country-of-origin research. Journal of Economic Psychology 20:521–546.
Wall, M., J. Liefeld, and L. Heslop. 1991. Impact of country-of-origin cues on consumer judgments in multi-cue situations: A covariance analysis. Journal of the Academy of Marketing Science 19 (2):105–113.
World Bank. 2014. Imports of Goods and Services as % of GDP,
http://data.worldbank.org/indicator/NE.IMP.GNFS. ZS.
Yagci, M. I. 2001. Evaluating the effects of country-of-origin and consumer ethnocentrism: a case of a transplant prod-uct. Journal of International Consumer Marketing 13 (3):63–85.