CROSS COUNTRY COMPARISON OF MATH-RELATED
FACTORS AFFECTING STUDENT
MATHEMATICS LITERACY LEVELS BASED ON PISA 2012
RESULTS
A MASTER’S THESIS
BY
BETÜL BARUT
THE PROGRAM OF CURRICULUM AND INSTRUCTION İHSAN DOĞRAMACI BILKENT UNIVERSITY
ANKARA JANUARY 2020 B E T ÜL B AR UT 2020
COM
P
COM
P
B E T ÜL B AR UT 2019COM
P
COM
P
B E T ÜL B AR UT 2019COM
P
COM
P
B E T ÜL B AR UT 2019COM
P
COM
P
Cross Country Comparison of Math-Related Factors Affecting Student Mathematics Literacy Levels Based on PISA 2012 Results
The Graduate School of Education of
İhsan Doğramacı Bilkent University
by Betül Barut
In Partial Fulfilment of the Requirements for the Degree of Master of Arts
in
Curriculum and Instruction Ankara
İHSAN DOĞRAMACI BILKENT UNIVERSITY GRADUATE SCHOOL OF EDUCATION
Cross Country Comparison of Math-Related Factors Affecting Student Mathematics Literacy Levels Based on PISA 2012 Results
Betül Barut January 2020
I certify that I have read this thesis and have found that it is fully adequate, in scope and quality, as a thesis for the degree of Master of Arts in Curriculum and
Instruction.
---
Asst. Prof. Dr. İlker Kalender (Supervisor)
I certify that I have read this thesis and have found that it is fully adequate, in scope and quality, as a thesis for the degree of Master of Arts in Curriculum and
Instruction.
---
Asst. Prof. Dr. Armağan Ateşkan (Examining Committee Member)
I certify that I have read this thesis and have found that it is fully adequate, in scope and in quality, as a thesis for the degree of Master of Arts in Curriculum and
Instruction.
---
Asst. Prof. Dr. Zerrin Toker, TED University (Examining Committee Member)
Approval of the Graduate School of Education
---
iii ABSTRACT
Cross Country Comparison of Math-Related Factors Affecting Student Mathematics Literacy Levels Based on PISA 2012 Results
Betül Barut
M.A. in Curriculum and Instruction Supervisor: Asst. Prof. Dr. İlker Kalender
January 2020
The purpose of the current study is to investigate the relationship between mathematics related affective factors and mathematics literacy levels across Brazil, Norway, Singapore and Turkey. The countries selected according to their rankings on PISA 2012 cycle.
Singapore was a high-performer country, Norway was an average-performer country, Turkey was a below-average-performer country and Brazil was a low-performer country in PISA 2012. Multiple linear regression analysis was used separately for each selected country. Mathematics literacy score was used as a dependent variable, seven selected mathematics related affective factors (mathematics self-beliefs: mathematics self-efficacy, mathematics self-concept and mathematics anxiety; disposition and participation in mathematics related activities: mathematics intentions and mathematics behavior; motivational factors:
instrumental motivation for mathematics and mathematics interest) were used as independent variables. The results indicated that all factors have significant effect on students’
mathematics literacy achievement for all selected countries. In general, mathematics self-efficacy, mathematics self-concept, mathematics anxiety and mathematics behavior found that there is a same relationship for all four countries. Instrumental motivation for
mathematics, mathematics intentions, and mathematics interest showed differences among countries.
Keywords: Cross-cultural comparison, factors associated with achievement, mathematics literacy, The Programme for International Student Assessment, PISA 2012.
iv ÖZET
PISA 2012 Sonuçlarına göre Matematik Okuryazarlık Düzeyini Etkileyen Matematik ile İlişkili Değişkenlerin Ülkelerarası Karşılaştırılması
Betül Barut
Yüksek Lisans, Eğitim Programları ve Öğretim Tez Yöneticisi: Dr. Öğr. Üyesi İlker KALENDER
Ocak 2020
Bu çalışmanın amacı, matematikle ilişkili duyuşsal faktörler ile Brezilya, Norveç, Singapur ve Türkiye genelinde matematik başarısı arasındaki ilişkiyi incelemektir. Çalışmada ele alınan ülkeler PISA 2012 (Uluslararası Öğrenci Değerlendirme Programı) uygulamasındaki sıralamalarına göre seçilmiştir. PISA 2012 sonuçlarına göre; Singapur yüksek performans, Norveç ortalama performans, Türkiye ortalamanın altında performans gösteren bir ülke ve Brezilya düşük performans gösteren bir ülke olmuştur. Seçilen her ülke için ayrı ayrı çoklu doğrusal regresyon analizi yapılmıştır. Bu çalışmada, bağımlı değişken öğrencilerin matematik okuryazarlığı skorlarıyken, bağımsız değişkenler matematik ile ilgili duyuşsal faktörler; matematiksel davranış, matematik öz-yeterlilik algısı, matematik öz-kavram,
matematik kaygısı, matematiğe yönelik araçsal motivasyon, matematik çalışma ahlakı ve matematik ilgisi olarak seçilmiştir. Sonuçlar, her ülke için tüm faktörlerin öğrencilerin
matematik okuryazarlığı üzerinde önemli bir etkisi olduğunu göstermiştir. Genel olarak, seçilen dört ülke için matematiğe yönelik araçsal motivasyon, matematik çalışma ahlakı ve
matematik ilgisi değişkenlerinin matematik okuryazarlığı ile aynı doğrultuda ilişkiye sahip
olduğu, matematiksel davranış, matematik öz-yeterlilik algısı, matematik öz-kavram ve
matematik kaygısı değişkenlerinin matematik okuryazarlığı ile ilişkisinin seçilen ülkeler için
farklılıklar gösterdiği bulunmuştur.
Anahtar Kelimeler: Başarı ile ilgili faktörler, matematik okuryazarlığı, PISA 2012, Uluslararası Öğrenci Değerlendirme Programı, ülkeler arası karşılaştırma.
v
ACKNOWLEDGEMENTS
Firstly, I would like to express my sincerest appreciation to Prof. Dr. Ali DOĞRAMACI for establishing and supporting this program.
I would also like to offer my sincere thanks to my supervisor Asst. Prof. Dr. İlker KALENDER for his guidance, comments, and elevation.
Also, I would like to express my thanks, with gratitude, to Prof. Dr. Alipaşa AYAS and several people from our department who have provided their help and
encouragement during this program.
I am also thankful to my committee members Asst. Prof. Armağan ATEŞKAN and Asst. Prof. Zerrin TOKER for their valuable feedback for the study.
I am truly grateful to my dearest family for their warm support, patience, and encouragement during my study. They always believed in me, shared all the difficulties and stresses with me.
I would like to sincerely thank to and my dear friends Elif Sarıgöz, Elifnur Yazıcı, Merve Seyrek, and Tuba Oturan. I feel so lucky to have their precious friendship and supports.
Lastly, special thanks to my beloved one Ebu Bekir Öztürk for his unlimited support and encouragement.
vi TABLE OF CONTENTS ABSTRACT ... iii ÖZET... iv ACKNOWLEDGEMENTS ... v TABLE OF CONTENTS ... vi LIST OF TABLES ... ix LIST OF FIGURES ... x CHAPTER 1: INTRODUCTION ... 1 Introduction ... 1 Background ... 2 Problem ... 4 Purpose ... 5 Research questions ... 5 Significance ... 6
Definition of key terms ... 6
CHAPTER 2: REVIEW OF RELATED LITERATURE ... 8
Introduction ... 8
Factors affecting mathematics literacy ... 8
Mathematics self-beliefs ... 8
Disposition and participation in mathematics‑related activities ... 15
vii
International comparison of mathematics literacy ... 20
CHAPTER 3: METHOD ... 24
Introduction ... 24
Research design ... 24
Context ... 25
The case of Brazil ... 26
The case of Norway ... 27
The case of Singapore ... 28
The case of Turkey ... 30
Sampling ... 31
Instrumentation ... 36
Method of data collection ... 42
Method of data analysis ... 43
CHAPTER 4: RESULTS ... 45
Introduction ... 45
Factors explaining mathematics literacy... 45
Variable based analysis results ... 47
Country based analysis results ... 51
Item based analysis results ... 52
CHAPTER 5: DISCUSSION ... 61
Introduction ... 61
viii
Major findings ... 62
Implications for practice ... 68
Implications for further research ... 69
Limitations ... 70
REFERENCES ... 71
APPENDICES ... 81
APPENDIX A: PISA 2012 Summary Descriptions of the Six Proficiency ... 82
APPENDIX B: PISA 2012 Student Questionnaire Items ... 83
ix
LIST OF TABLES
Table Page
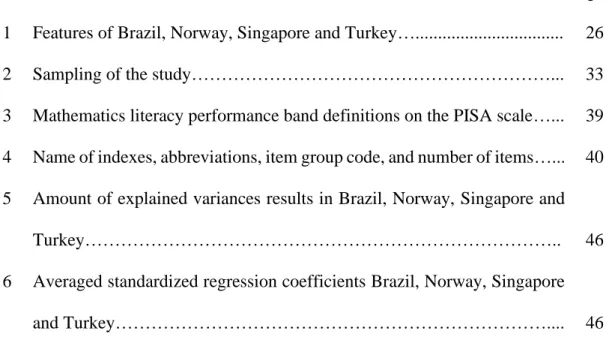
1 Features of Brazil, Norway, Singapore and Turkey…... 26
2 Sampling of the study………... 33
3 Mathematics literacy performance band definitions on the PISA scale…... 39 4 Name of indexes, abbreviations, item group code, and number of items…... 40 5 Amount of explained variances results in Brazil, Norway, Singapore and
Turkey……….. 46
6 Averaged standardized regression coefficients Brazil, Norway, Singapore
x
LIST OF FIGURES
Figure Page
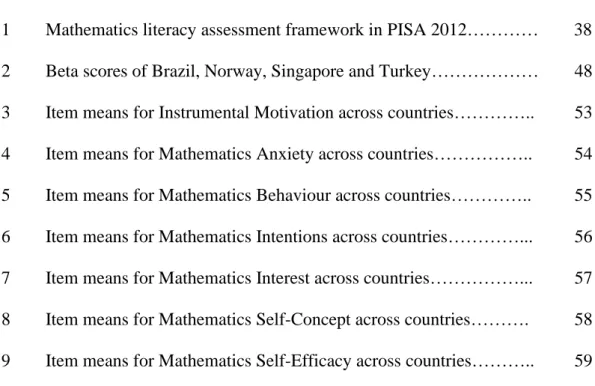
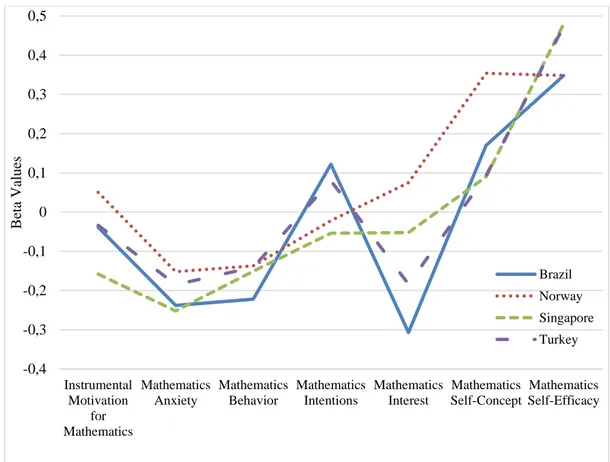
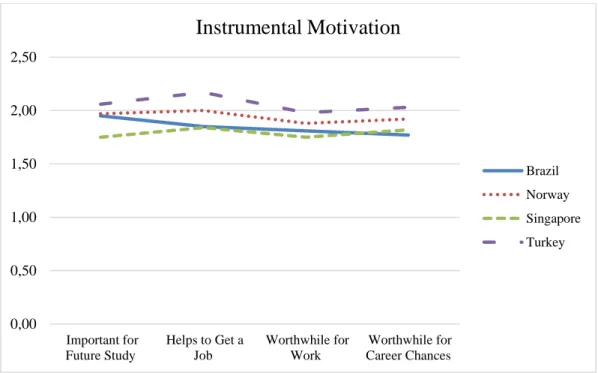
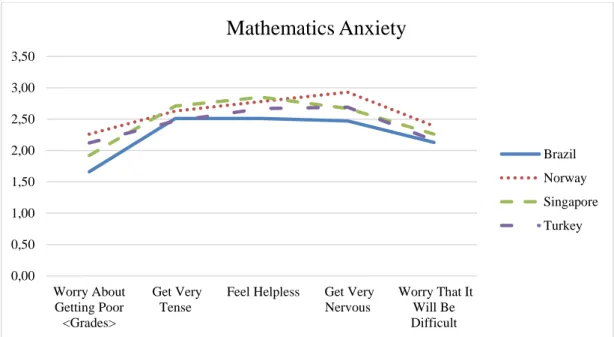
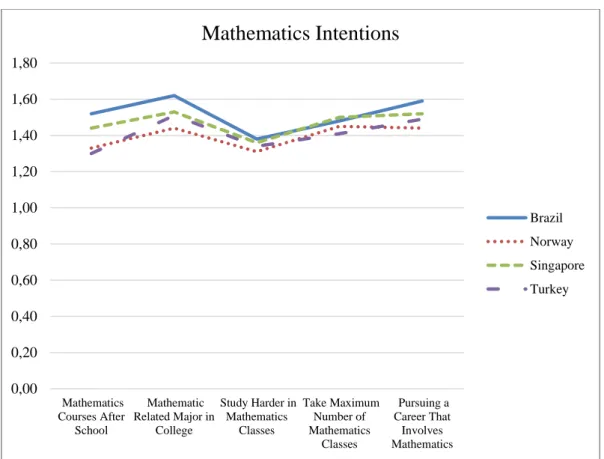
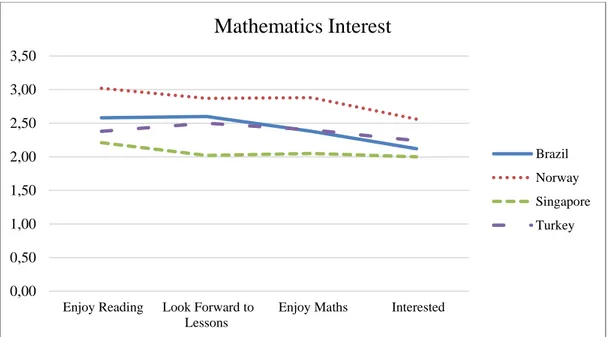
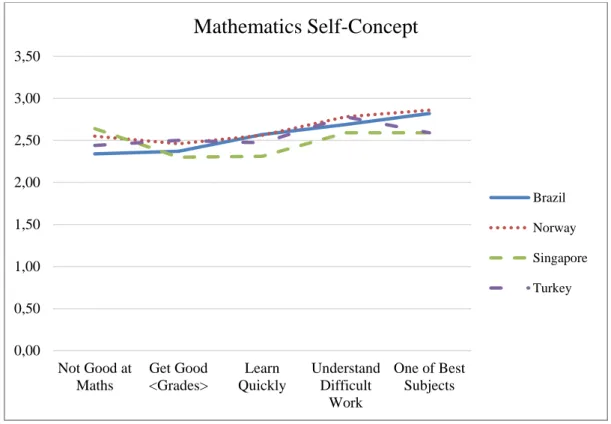
1 Mathematics literacy assessment framework in PISA 2012………… 38 2 Beta scores of Brazil, Norway, Singapore and Turkey……… 48 3 Item means for Instrumental Motivation across countries………….. 53 4 Item means for Mathematics Anxiety across countries……….. 54 5 Item means for Mathematics Behaviour across countries………….. 55 6 Item means for Mathematics Intentions across countries…………... 56 7 Item means for Mathematics Interest across countries………... 57 8 Item means for Mathematics Self-Concept across countries………. 58 9 Item means for Mathematics Self-Efficacy across countries……….. 59
1
CHAPTER 1: INTRODUCTION Introduction
Mathematics is an interdisciplinary foundation of science, technology and
engineering. It is a common language which helps understand complex problems, and apply essential connections to other fields and disciplines (Bucy, 1989). It is also a crucial subject in order to be successful in and outside of the school. In the school, both theoretical and conceptual knowledge of mathematics is important for academic achievement. Outside of the school, mathematics is essential in everyday life
activities of a person such as telling the time, shopping, counting, managing money, and cooking (Arora, Grønmo, Lindquist & Mullis, 2013). It can be saying that mathematics plays an important role in people’s life and helps people to interpret the numerical parts of life and their decision.
Competence in mathematics and mathematics literacy causes constructive
participation in today’s information society. Basically, mathematics literacy can be defined as competency for analyzing and reasoning mathematically, describing, interpreting, formulating and using mathematical concepts, facts, procedures in variety of real-life situations (OECD, 2013a).
Gregoire and Desoete (2009) states that mathematics literacy is essential for coping with daily life situations such as using maps, reading time tables, managing bills, and apprehending expiry dates. Mathematics literacy is also considered one of the 21st century skills (The Partnership for 21st Century Learning, 2019). Therefore, to be a
2
part of the rapidly changing world, students’ mathematics literacy should be given attention (Steen, 1999).
Background
Globalization have had an impact on many aspects of a country, from its economy to its educational systems. This worldwide connection has resulted in increased
competition among countries in terms of their economy and schooling. Countries needs to train their young generations to be competent in this common language, and to develop mathematics literacy skills. The importance of having mathematics literacy has been studied by several organizations and many researchers (National Council of Teachers of Mathematics (NCTM), 2000; National Research Council (NRC), 1989; Steen, 1997; Steen,1999; The Partnership for 21st Century Learning, 2019). Those studies stated that a high level of proficiency in mathematics and mathematics literacy is essential for the rapidly changing global economy.
Effectiveness of a nation's educational system can be assessed by academic achievement of students, as well as by other means. According to Arnove (2001), excellent educational systems increase the economic success and global
competitiveness of a country. Academic achievement is a crucial outcome in education. In the last decades, educational researchers started to give importance factors that affect students’ achievement in comparative ways.
In the literature, there are many factors that were reported to be related with students’ outcome variables. Among them are family background, socio-economic status, instructional strategies and techniques, teacher-student relation, school facilities and
3
resources, curriculum, individual self-beliefs, and motivation. Many researchers state that motivational factors have an undeniable effect on students’ achievement in mathematics (Schicke & Fagan, 1994; Schukajlow & Krug, 2014).
Some researchers mentioned that other affective factors such as anxiety, self-beliefs, interest, enjoyment, and motivation to learn mathematics effected students’ literacy in mathematics (García, Rodríguez, Betts, Areces & González-Castro, 2016; Murayama, Pekrun, Lichtenfeld & Hofe, 2012; Yaratan & Kasapoğlu, 2012). There are also reported findings about differences among countries on these factors (Choi , Choi & Mcaninch, 2012; Chiu & Xihua, 2008; Gamboa, Luis Fernando, Rodríguez Acosta, Mauricio & García-Suaza, Andrés, 2013; Radisic, Videnovic & Baucal, 2018).
Although countries may try to define several models to predict outcomes variables in their educational systems, contribution of comparative studies among countries is of significance. Since the predictors of outcome variables may differ among countries, determining those factors on students’ literacy might help the country to examine the effectiveness of its educational system. In this respect, international benchmarking studies such as The Program for International Student Assessment (PISA) and Trends in International Mathematics and Science Study (TIMSS) were launched (OECD, 2013a). Such studies allow participating countries to follow their situations on a comparative perspective in science, reading, and mathematics domains. Such studies are also significant importance in evaluating the student success for both nationally and internationally (Dossey, McCoren, & O’Sullivan, 2006; EURODICE, 2011).
4
As an international benchmarking study, PISA conducted by the Organization for Economic Cooperation and Development (OECD) in every three years. The first assessment took place in 2000. PISA assesses mathematics, science and reading literacy of students who are 15 years old. PISA aims to assess the literacy level of students in order to find out that if they are ready to meet real-life challenges in the future by using their knowledge and skills (OECD, 2013a). In addition, PISA gives insights for participating countries on how well their education systems prepare young people to life and work (OECD, 2013a).
The important benefits of PISA are giving insight effectiveness, equity, and efficiency of educational systems and setting benchmarks for international
comparison (OECD, 2012b). Also, Schneider (2009) defines this study as “PISA is a self-proclaimed “yield study” in assessing the total “literacy” of 15-year-olds, and hence, PISA is therefore not tied to specific curricula. It also has an emphasis on globalization and the 21st century skills, and claims to be assessing the skills that young adults will need in the emerging global economy” (p. 69).
Problem
Defining factors which affect mathematics literacy levels of students deserves to be studied in detail since mathematics literacy gained significant importance as
mathematics achievement in the last decades (Kellaghan & Madaus, 2002; Kyriakides, 2006). Considering the relationship between affective variables and outcome variables, a relational and comparative analysis may provide significant information. PISA data sets provide huge amount of information at both student and
5
school level. Enlarging the scope of the comparison by including several countries, especially high and low performing countries, is also expected to provide valuable information about explaining students’ mathematics literacy.
Purpose
The present study aims to investigate the relationships among mathematics-related affective factors (mathematics self-beliefs: mathematics self-efficacy, mathematics self-concept and mathematics anxiety; disposition and participation in mathematics related activities: mathematics intentions and mathematics behavior; motivational factors: instrumental motivation for mathematics and mathematics interest) that explain students’ mathematics literacy levels among several countries. Brazil, Norway, Singapore and Turkey are included concerning the performance levels on PISA 2012 results.
Research questions
This study within the boundaries of above problem is going to address the following questions:
1. What are the mathematics-related affective factors predicting student’s mathematics literacy levels in PISA 2012 in Brazil, Norway, Singapore and Turkey?
2. How do the relationships among mathematics-related affective factors and mathematics literacy differ across these four counties?
6 Significance
This study focuses on a global view of country-specific information on students’ mathematics literacy and its affective factors. This study provides significant information for Brazil, Norway, Singapore and Turkey. A comparison of the relationships among the factors that affect students’ mathematics literacy may provide important lessons for Brazil, Norway, Singapore and Turkey in terms of predicting mathematics literacy of students. Furthermore, identification of the relationship of math-related affective factors on mathematics literacy may benefit other low-, average- and high-achieving countries in terms of development of curriculum or improvement actions in mathematics lessons. Findings of this study also expected to provide perspectives on the effect of students’ motivation and self-beliefs on students’ mathematics literacy for stakeholders, educational policy
developers, school principals, teachers and parents. They may get general view about factors that are related with mathematics literacy. Policy makers and stakeholders may take into account in designing a mathematics curriculum, in addition, school principals, teachers and parents may take into account in designing school, classroom and home learning environment.
Definition of key terms
Mathematics literacy: Competency for analyzing and reasoning mathematically, describing, interpreting, formulating and using mathematical concepts, facts, procedures in variety of real-life situations (OECD, 2013a).
7
Mathematics anxiety: "Feelings of tension and anxiety that interfere with the manipulation of numbers and the solving of mathematical problems in a wide variety of ordinary life and academic situations" (Richardson and Suinn,1972, p. 551).
Mathematics behavior: Students participation in a range of mathematics-related activities (OECD, 2013).
Mathematics interest: Students’ interest and enjoyment for learning mathematics (OECD, 2013c).
Mathematics intention: Students’ thought about whether they intend to use mathematics in their future (OECD, 2013).
Mathematics self-concept: Students’ perceived ability in mathematics lesson (OECD, 2013c).
Mathematics self-efficacy: Individual’s judgement of their capacity or potentiality for what they can achieve to solve mathematics problems (OECD, 2013c).
Instrumental motivation to learn mathematics: Students' effort to learn
mathematics because they think that it is worthwhile to them and their future studies and careers (Eccles & Wigfield, 2002; Miller & Brickman, 2004).
8
CHAPTER 2: REVIEW OF RELATED LITERATURE Introduction
Mathematics literacy of a student may be affected by several school and student-related, affective, social and cultural factors. In this chapter, the first section is related to mathematics-related affective factors. The following factors will be defined, and their associations with mathematics achievement and mathematics literacy achievement will be reviewed in the following subsections separately: self-beliefs (mathematics self-efficacy, mathematics self-concept, mathematics anxiety), disposition and participation in mathematics‑related activities (mathematics
intentions and mathematics behavior), motivational factors (instrumental motivation for mathematics, mathematics interest). The categorization of subsections was made by PISA framework (OECD, 2013c). In the last section, some international
comparison studies were reviewed.
Factors affecting mathematics literacy Mathematics self-beliefs
Mathematics belief factors include mathematics efficacy, mathematics self-concept and mathematics anxiety. In the following subsection involved those factors and its relationship with students’ mathematics and mathematics literacy
9 Mathematics self-efficacy
Self-efficacy refers to the individual’s judgement of their capacity or potentiality for what they can achieve at assigned levels (Bandura, 1977; Schunk, 1991). PISA constructed mathematics self-efficacy index considering students’ responses about their beliefs for their capacity to solve mathematics problems (OECD, 2013c).
Previous studies showed that mathematics self-efficacy has an effect on students' mathematics and mathematics literacy achievement (Ayotola & Adedeji, 2009; Duran & Bekdemir, 2013; Güzel & Berberoğlu 2010; Liu 2009; Pietsch, Walker & Cahpman, 2003).
Liu (2009) examined the relationship between mathematics self-efficacy and mathematics achievement of 15000 high school students from the United States by using the Educational Longitudinal Study of 2002. A correlation analysis showed that there is a positive relationship between mathematics self-efficacy and
mathematics achievement. Another correlational study result which conducted by Liu and Koirala (2009) also provided similar finding by using the same sample. Studies which used PISA data also supported that findings.
Güzel and Berberoğlu (2010) revealed that the strongest positive relationship as self-efficacy in their study. The researchers analyzed PISA 2003 data in order to
investigate the relationship between mathematics self-belief factors and mathematics literacy of students by using Turkish sample. The results of the linear structural modeling showed that there is a significant relationship between mathematics self-efficacy and students’ mathematical literacy levels.
10
Walker and Cahpman (2003) also reported self-efficacy as important predictors in explaining students’ mathematics achievement. They worked on a sample of 416 high school students. They used a questionnaire including self-efficacy measures of social comparison (for mathematics) sections. They also used students' performance in mathematics at the end of their term. The results of this study reveal that students’ performance primarily related to efficacy as well as the results showed that self-efficacy predicts students’ performance better.
Some studies showed mathematics self- efficacy on students’ mathematics literacy level may affected by school types. For example, Özberk, Kabasakal and Öztürk (2017) showed that 64% of the change in students’ mathematics literacy achievement was due to differences among school types for Turkey. They conducted a study among Turkish students by using PISA 2012 data in order to investigate the school and student-level factors that affected Turkish students’ mathematics literacy achievement. According to the results of their study, mathematics self-efficacy has significant effects on mathematics literacy achievement.
Levpuscek, Zupancic, and Socan (2012) investigated whether individual and social factors are predictive of academic outcomes in mathematics (self-efficacy, final grades and national exam scores) of students. Besides that, they investigated the direct and indirect effects of those factors on adolescent mathematics achievement. The sample study consisted of 416 eighth grade Slovenian students (216 girls, 200 boys) from 13 randomly selected public schools in different regions. The results show that students’ general intelligence and self-ratings of their effort are predictive
11
of their academic self-efficacy in mathematics. Self-efficacy perception also may have an effect on students’ mathematics literacy achievement.
Mathematics self-concept
Self-concept refers to an individual's self-evaluation on tasks or subjects by comparing her past performances and others performance (Marsh, 1986). PISA defined mathematics self-concept as students’ responses about their perceived ability in mathematics lesson (OECD, 2013c).
Previous studies showed that self-concept has positive effect on students’ mathematics achievement and mathematics literacy achievement (Dulay, 2017; Güzel & Berberoğlu, 2010; Pietsch, Walker & Cahpman, 2003; Şengül, 2015; Timmerman, Toll & Luit, 2017)
Dulay (2017) showed the effect of self-concept on students’ achievement by examining 123 studies from the literature which uses correlation in the study and focuses on students’ achievement and self-concept. The study examined the studies published between 2005 and 2015. Effect of self-concept on student achievement tested via meta-analysis. Publication year, publication type, country, course achievement and education level used as moderator variables. The results of this study reveal that self-concept has a medium level positive effect on student
achievement. Besides, country and course found do not have a moderator role in the effect size of self-concept on student achievement.
12
Some other studies focused on especially mathematics self-concept and students’ mathematics achievement such as the study by Timmerman, Toll and Luit (2017). The study examined the relationship between math self-concept and math
achievement of students aged 12-14 in Netherland. The results of this study show that there is a positive correlation between math self-concept and math achievement.
Seaton, Parker, Marsh, Craven, and Yeung (2014) extended the age range and they examined the relationship between mathematics achievement and self-concept among 2786 Australian high school students aged between 11 and 17 in their study. The researchers applied Marsh's (1992) Academic Self-Description Questionnaire II for the self-concept measure and Wilkinson and Robertson's (2006) Wide-Ranging Achievement Test 4 (WRAT 4) for the mathematics achievement measure four times. They found that self-concept has a significant reciprocal relationship with mathematics achievement of students.
Şengül (2015) developed a structural model in order to examine the relationship between students’ mathematics literacy achievement and mathematics self-concept by using Turkish sample in PISA 2012. The sample of the study consisted 4848 students from 170 schools and 12 geographical regions. The researcher investigated the effects of mathematics self- concept on Turkish students' mathematics
achievement. The results of the study showed that there is a medium and positive relationship between mathematics achievement and mathematics self-concept of Turkish students.
13 Mathematics anxiety
Mathematics anxiety refers to "feelings of tension and anxiety that interfere with the manipulation of numbers and the solving of mathematical problems in a wide variety of ordinary life and academic situations" (Richardson & Suinn,1972, p. 551). In PISA 2012 mathematics anxiety is defined as follows: “students’ responses about feelings of stress and helplessness when dealing with mathematics” (OECD, 2013c).
A study by Gunderson, Park, Maloney, Beilock and Levine (2018) showed that mathematics anxiety can be shaped according to early achievement of a student. They investigated whether goal orientation and intelligence predict mathematics anxiety or whether mathematics anxiety predicts goal orientation and intelligence. The study conducted two times in six months apart, including 634 first and second graders. Path analysis results showed that early goal orientation and intelligence predicted higher mathematics anxiety. On the contrary, early mathematics anxiety did not predict later goal orientation and intelligence. Besides that, significant reciprocal relationships found which were mathematics achievement significantly predicted lower mathematics anxiety. Overall the study supported that early mathematics achievement has importance to shape later motivation and anxiety of students or early motivation has importance later achievement and anxiety.
Zakaria, Zain, Ahmad and Erlina (2012) stated that students who are high achieving have a lower level of anxiety, while low achieving students have a higher level of anxiety. They identified mathematics anxiety level differences according to gender as well as they investigated mathematics achievement considering students' anxiety level in their study. The participants of the study were 86 male 109 female secondary
14
school students from Malaysia. The results showed that there is no significant difference mathematics anxiety with respect to gender. Besides, the results showed that there is a significant relationship between students' mathematics anxiety levels and mathematics achievement.
Some studies showed that math anxiety reduces the use of right problem-solving strategies and it causes low performance on mathematics (Ramirez, Gunderson, Levine & Beilock, 2013). Ramirez et. al. (2016) investigated the relations of math anxiety, working memory and mathematics achievement of children. They concluded that a higher level of math anxiety causes a lower level of mathematics achievement of children even who has high working memory. Both studies above that
mathematics anxiety is an important variable that should be considered when depicting relational picture of mathematics literacy.
The following studies examined the correlation between students’ mathematics anxiety and mathematics literacy by using PISA data. Şengül (2015) used PISA 2012 results and showed there is a negative and medium relationship between
mathematics anxiety and mathematics literacy by involving Turkish sample. Lee and Stankov (2013) extended the number of factors and investigated the effects of fifteen factors in the four main domain (motivation, self-belief, learning strategies and attitudes towards school) on students’ mathematics literacy by using PISA 2003 data. Confirmatory factor analysis was used for investigating the effects of fifteen selected factors on mathematics literacy. The results revealed that anxiety was negatively correlated with mathematics achievement of students.
15
Timmerman, Toll and Luit (2017) examined the relationship between mathematics anxiety, test anxiety, and mathematics achievement among 108 secondary students in the Netherlands. Regression analysis results of the study revealed that there is a negative correlation between math anxiety and mathematics achievement. Ng (2012) also found negative correlation between math anxiety and achievement of students in his study. The sample consisted of 294 secondary school students in Singapore. The results of the study show that the major factors that affect students' mathematics anxiety are school-related. Mathematics anxiety and mathematics achievement found negatively correlated by using students' previous year end-of-year mathematics examination results.
Disposition and participation in mathematics‑related activities
This subsection includes students’ mathematics intention and mathematics behavior with their relation to mathematics and mathematics literacy achievement of students.
Mathematics intentions
PISA defined mathematics intentions index considering students’ responses about whether they intend to use mathematics in their future (OECD, 2013). There are not many studies about the relationship between the factor of mathematics intention and its relationship with students’ mathematics and mathematics literacy achievement.
Wang (2012) investigated the relations between students’ career and educational interests that involve mathematics, expectancies, values, and classroom
characteristics. The sample of the study included 3048 students from Michigan. The variables were students’ classroom characteristics, math grades and motivational beliefs in grade 7, students’ math grades and motivational beliefs in grade 10,
16
students’ number of math courses taken in grade 12 and students’ career aspirations in math-related areas in grade 12. Structural equation modeling revealed that students’ mathematics grades predicted positively for both students’ career
aspirations in math-related areas and number of math courses taken in high school.
Mathematics behaviors
PISA defined mathematics behaviors index as students' responses about their participation in a range of mathematics-related activities (OECD, 2013).
Koğar (2015) examined some direct and indirect factors that affect mathematics literacy of Turkish students by using the PISA 2012 data. Mediation model was used and ten indexes out of in total of seventeen indexes were found to be significant in explaining mathematics achievement of students. The results of the study show that there is a negative correlation between mathematics behavior and mathematics literacy of students. Similar result was found by Şahin and Yıldırım (2016). They also used PISA 2012 dataset and Turkish sample in their study. They analyzed some factors that affect students' mathematics literacy and mathematics behavior. They conducted a correlational study and found that mathematics behavior and
mathematics literacy are negatively associated.
Motivational factors
Motivational factors include mathematics interest (intrinsic motivation to learn mathematics) and instrumental motivation to learn mathematics. The following subsections are related to motivational factors and its relation with students’ mathematics and mathematics literacy achievement.
17
Mathematics interest (Intrinsic motivation to learn mathematics)
Intrinsic motivation refers to students’ interest and enjoyment for learning mathematics (Ryan & Deci, 2000). PISA defined mathematics interest index as students’ responses about joy and interest to learn mathematics (OECD,2013c).
Taylor et.al. (2014) conducted four studies to investigate motivational factors on students’ achievement based on Self Determination Theory (SDT). The first study analyzed the literature which conducted a meta-analysis. The selected studies from the literature were comprised of eighteen cross-sectional studies which employed the Academic Motivation Scale (Vallerand et al., 1992). According to the results of the first study, intrinsic motivation and identified regulation have a positive relationship, whereas introjected and external regulation has a negative relationship with school achievement. The second study aimed to find the strongest motivation types of students' later achievement. The sample of the study was 524 students from a high school in Canada. Students’ motivation analyzed twice in one year. Structural
equation modeling analysis results showed that intrinsic motivation was the strongest motivation type, which increased general course achievement of students over time. The third study was conducted in order to support second study. The study involved 1135 students who graduated from high school and entered a science program. The instruments of the study were AMS questionnaire and students’ math and science scores in grade 10, 11 and the first-semester score of the college. The results of the third study revealed findings similar to the second study, intrinsic motivation predicted best and positively students’ achievement over time. In the last study,
18
similar research conducted with a different sample of students from Sweden. The results of the study were the same as Study two and Study three.
Yi and Lee (2016) investigated the relationship between affective outcomes (mathematics interest and self-concept etc.) and mathematics performance of students from Korea and Singapore by using PISA 2012 results. The results of analyses showed that mathematics interest has positive effects on students’ math performance for both countries by showing higher effect for Korea than Singapore. Şengül (2015) also found a positive relationship between mathematics achievement and mathematics interest of students by using Turkish sample in PISA 2012. However, Şahin and Yıldırım (2016) used the same sample and found contrary results in their study. Contrary to other studies, Şahin and Yıldırım (2016) revealed that mathematics interest predicted mathematics achievement negatively. Their method was structural regression model in this study.
Different from other studies Marsh, Trautwein, Lüdtke, Köller and Baumert (2005) investigated the effect of mathematics interest on students’ self-concept. The study investigated the reciprocal effects models of mathematics interest, mathematics self-concept, school grades, and test scores by using longitudinal data. The researchers used structural equation modeling in order to examine the relationship between mathematics interest and achievement in their study. The results of the study show that math interest has a positive correlation with math achievement, and earlier mathematics interest has a small effect on following mathematics self‐concept. Another study conducted by Köller, Baumert and Schnabel (2001) investigated gender differences in course selection, mathematics interest and mathematics
19
achievement of 602 students (59.5% female, 40,5% male) from Germany. Students’ mathematics achievement tested at the end of Grade 7, end of Grade 10, and middle of Grade 12. The results of this study show that high achieving students have more interest than lowers from Grade 7 to Grade 10. Besides, mathematics interest has no significant effect on students’ performance, while higher interested students tend to choose an advanced mathematics course.
Instrumental motivation for mathematics
Instrumental motivation to learn mathematics refers to students' effort to learn mathematics because they think that it is worthwhile to them and their future studies and careers (Eccles & Wigfield, 2002; Miller & Brickman, 2004). PISA constructed instrumental motivation for mathematics index as follows: “whether students feel that learning and studying mathematics is worthwhile for their future studies and profession and helps to get a job” (OECD,2013c).
Pitsia, Biggart and Karakolidis (2017) examined whether mathematics literacy can predict students' motivation (intrinsic and instrumental motivation for mathematics), by using PISA 2012 data. The participant in this study was 5125 students from 192 schools in Greece. According to the two-level multilevel analysis of this study, intrinsic motivation to learn mathematics was not predicted mathematics
achievement statistically. However, instrumental motivation to learn mathematics were a significant predictor of mathematics achievement.
20
International comparison of mathematics literacy
Recently, the researchers have given importance to comparison studies. Guo (2014) compared PISA 2012 student mathematical literacy scores across Shanghai-China, the United States, Finland and Japan. He used students' mathematical literacy score as the dependent variable, and background characteristics at the school and students’ levels as control variables. He employed a multilevel model to analyze all variables simultaneously. The student-level variables included gender and the family's
socioeconomic and cultural background. The school-level variables included school type, school size, class size, student-teacher ratio, school educational resources and four types of principals' perceived levels of leadership. Four types of leadership determined by OECD as instructional leadership, framing and communicating the school's goals and curricular development, promoting instructional improvements and professional development and the leadership of the teacher. The results indicated that social, economic, and cultural status show a positive relationship with
mathematical literacy under each of the four countries. The results also indicated that class size shows a significantly positive effect on students' mathematical literacy in Finland and Japan. Besides, the study showed that there is a negative relationship between student achievement and a lack of educational resources among the four countries.
Another comparison study was conducted by Kalaycıoglu (2015) who conducted a relational analysis using socioeconomic status, math self-efficiency and math anxiety factors on students' mathematics achievement among in England, Greece, Hong Kong, the Netherlands, Turkey, and the USA. First, she used a separate structural equation model to examine the variables for each country. Secondly, she used a
21
multi-group structural equating model to compare variables among countries.
Besides, Greece and Hong Kong also have relatively high math anxiety mean values. Math self-efficacy has found the strongest effect on mathematics achievement while math anxiety has found a negative effect on students' mathematics achievement for all studied countries.
Different from Kalaycıoglu (2015) findings, Morony, Kleitman, Lee and Stankov (2013) found that self- efficacy is not a significant predictor, while self-concept is the best predictor of students’ mathematics achievement. Morony et. al (2013)
investigated the relationship of mathematics self-concept, mathematics anxiety, mathematics self-efficacy on mathematics achievement among two world regions: Confucian Asia (Singapore, South Korea, Hong Kong and Taiwan) and Europe (Denmark, The Netherlands, Finland, Serbia and Latvia). They used regression and structural equation modeling in this study. The sample of the study was 7167 fifteen years old students from nine countries. The results showed that Confucian Asian countries have lower self-concept and higher math anxiety than European countries. Self-confidence found to be an essential predictor of mathematics achievement both within each country and pan-culturally while self-efficacy found not to be a
significant predictor. Besides, the study indicated that Serb and Latvian are more overconfident than Confucian Asians even they have lower mathematics scores.
Another study by Yoshino (2012) investigated the relationship between mathematics self-concept and mathematics achievement. This study involved a research on
Japanese and American eighth-grade students by using TIMSS 2007 data. The results showed that there is a positive relationship between students' mathematics
self-22
concept and mathematics achievement for both countries. Although American and Japanese students have the same level of achievement, the results showed that Japanese students have lower self-concept than American students. This study also showed that there is a substantial impact on a country on students' mathematics self-concept. Different cultures’ effect on mathematics achievement examined and similar results found by Lee (2009). He investigated whether mathematics self-concept, mathematics self-efficacy and mathematics anxiety-related or differ from each other and whether those factors are useful in explaining the achievement of different cultures in his study. The sample of the study consisted of 41 countries that participated in PISA 2003 cycle. The results revealed that Asian-Confucian countries have the lowest self-efficacy and self-concept, while the United States and European countries have higher self-efficacy and self-concept. Besides, the results showed that Asian-Confucian countries, Mexico and Brazil have the highest mathematics anxiety, while Western European countries have lower mathematics anxiety.
Schulz (2005) also used PISA 2003 data set and conducted a cross country
comparison study which investigated self-beliefs among mathematics self-efficacy, self-concept, anxiety and their relationship with mathematics literacy. Besides, they investigated the impact of school differences on self-beliefs and the relationship between self-belief and self-efficacy with gender and socio-economic background. The results of the study showed that high performer countries have less motivation and less favorable attitudes toward mathematics except for Korea and Japan. Besides that, similar with other researches, the results of this study showed that there is a negative correlation between mathematics anxiety and mathematics literacy scores, whereas there is a positive correlation between self-efficacy, self-concept and
23
mathematics literacy scores. The socio-economic background has found the strongest effect on mathematics literacy. School variance has found positively correlated with mathematics self-efficacy and mathematics literacy scores of countries.
In conclusion, many factors affect students' mathematics achievement. The relationships between affective factors and mathematics literacy show differences across countries. However, as the literature review showed, affective level factors were generally constituted significant effect predictors on students' mathematics achievement.
24
CHAPTER 3: METHOD Introduction
The present study aims to make a cross-cultural comparison of mathematics related affective factors explaining students’ mathematics literacy levels based on PISA 2012 data set. To this end, a correlational study was designed using the data from Brazil, Norway, Singapore and Turkey. In this chapter, the first research design is defined. Then context, sampling and instrumentation are described. Lastly, data collection and data analysis methods are explained.
Research design
The present study is a correlational study, which is a type of non-experimental research design (Jackson, 2014). Correlational research design helps researchers determine the degree to which a relationship exists between two or more variables and describes the relationship among variables (Ary, Jacobs & Razavieh, 1972; Jackson, 2014). For the current study, the correlational design used to examine the relationship between mathematics-related affective factors (mathematics self-beliefs: mathematics self-efficacy, mathematics self-concept and mathematics anxiety; disposition and participation in mathematics related activities: mathematics
intentions and mathematics behavior; motivational factors: instrumental motivation for mathematics and mathematics interest) and students' mathematics literacy levels. Due to its nature, any cause and effect relationship was not established in this study. Instead, correlational design was employed to determine the strength of the
25 Context
PISA is a triennial international benchmarking study launched by OECD in 2000. PISA assesses mathematics, reading and science skills of 15-year-old students by using literacy tests. The primary purpose of PISA study is to assess students’ readiness to meet the real-life challenges in the future, rather than assess their knowledge on the specific subjects. Besides, PISA aims to get information about students, such as their preferences for learning environments and their desire to learn by using background questionnaires (Ministry of Education Turkey, 2017; OECD, 2014a). In 2012 cycle of PISA, approximately 510 000 students from 34 OECD member countries and 31 OECD non-member countries participated in the PISA (OECD, 2014a).
In the present research, four countries, Brazil, Norway, Singapore, and Norway were included based on their performance rankings in PISA 2012. Some features of included countries were given in the following table. (see Table 1)
26 Table 1
Features of Brazil, Norway, Singapore and Turkey
Countries Brazil Norway Singapore Turkey
Income level Upper middle-income
High-income High-income Upper middle-income GDP per capita $12 307 024 $101 668 171 $55 546 489 $11 707 026 Cumulative education expenditure Less than $50 000 More than $150 000 More than $150 000 Less than $50 000 Compulsory education year 9 10 6 12 % high achiever students in PISA 2012 1% 9% 40% 6% % of low achiever students in PISA 2012 67% 22% 8% 42%
The case of Brazil
Brazil is a developing country located in Latin America. Brazil has an upper middle-income economy. Brazil's GDP per capita was USD 12 307 024 in 2012; however, it showed decreases currently (World Bank Open Data, 2019). Annual spending per student from primary to tertiary education was less than USD 5000 and cumulative education expenditure for per students aged between 6 and 15 was less than USD 50
27
000 in Brazil (OECD, 2016). Total cumulative expenditure of students aged between 6 to 15 was around USD 92 000 per student on average across OECD countries (OECD, 2016), Brazil's per capita GDP and education expenditure are about one-third of the OECD countries. The Ministry of Education of Brazil is working on curriculum development, considering significantly below the OECD average score of the country. The education system comprises of 9 years compulsory primary
education (5 years elementary, four years lower secondary) and three years, not compulsory secondary education (Foreign Credits, 2012). The system does not provide alternative pathways before secondary school. Students are given a test at the end of each year to determine whether they can move on to next grade. There is an official university entrance exam at the end of secondary education as well as some universities have their entrance exam (Stanek, 2013, OECD, 2012).
The case of Norway
Norway is a developed and a high- income country which is located in Europe (World Bank Groups, 2019). Norway's GDP per capita was USD 101 668 171 in 2012 however it showed decreases currently (World Bank Open Data, 2019). Annual spending per student from primary to tertiary education was more than USD 15 000 and cumulative education expenditure for per students aged between 6 and 15 was more than USD 150 000 in Norway (OECD, 2016).
Norway implemented a curriculum reform in 2006, considering their average ranking in international benchmarking assessments such as PISA and TIMMS. Teacher training gained importance, internship opportunity and in-service training were increased. Norway has a single national curriculum with the ten years compulsory
28
and three years, not compulsory education. Norwegian education is divided into three main stages. The first stage, which is called a primary education comprises of first seven grade (Grades 1-7). The second stage, which is called a lower secondary education comprises of Grades 8-10. The third stage, which is called upper
secondary school consists of Grades 11–13. The education system does not provide a few alternative programs in the first two-stage. However, the system provides
alternative programs in the Secondary Education and subject specialization in the Grades 12-13. Students take national tests in reading in Norwegian, English, and mathematics in the beginning of Grade 5 and 8 as well as reading and mathematics in Grade 9. However, no marks are given before Grade 8 to students. Students also take one external examination and one local oral examination at the end of lower school. The Norwegian curriculum aims to have some necessary skills to be competitive in all subjects. Those basic skills involve oral skills, writing skills, reading skills,
numerical skills, and digital skills in all subjects (Braathe, 2012; OECD, 2015; Skule, Stuart, & Nyen, 2002; Tveit, 2014).
Therefore, mathematics education in Norway aims to help students reasoning mathematically, interpreting and modelling mathematics concepts, and using digital tools. However, Norway performs around average in mathematics in PISA.
The case of Singapore
Singapore is a developed country which is located in East Asia (The World Bank Group, 2019). The country rapidly developed from a low-income country to a high- income country after independence. Singapore's GDP per capita was USD 55 546 489 in 2012; however, it showed increases currently (World Bank Open Data, 2019).
29
Singapore gave a big emphasis on education in order to grow the country's economy that resulted in high-ranking in PISA. In the current education system, they
appointed qualified principals and allowed each school to set its own goals. They also gave importance to teacher training. Singapore created a system which enables student’s multiple pathways rather than a one-size-fits-all approach. However, the country still examination-oriented in the primary level, because after six years of compulsory education, all students take Primary School Leaving Examination State Exam. The compulsory education consists basic education in the first four years and orientation education in the 5th and 6th years. The general aim of the primary
education is to have comprehension in English, mother tongue and mathematics. All students follow the common curriculum, which involves English Language,
Mathematics and Mother Tongue Language education and starting from primary 3 students also take Art, Music, Character and Citizenship Education, Social Studies and Physical Education and Science subjects. They gave importance to Civic and moral education in the first four years of the six years of primary education. Starting from the fifth year, students can follow their interests and provided multiple
pathways (Ministry of Education Singapore, 2018). Students take 40 weeks education during a year.
Singaporean students performed better in understanding changes, employing mathematical models to describe changes and relationships, transforming shapes, representing three-dimension scenes, reading and creating maps (space and shape) and formulating situations mathematically while performed lower in interpreting and identifying and summarizing data from different data sets. Overall, the country
30
showed weak performance on probability and statistics whereas showed strong performance on measurement and algebra.
The case of Turkey
Turkey is a developing country which is located in Europe and Central Asia (World Bank Group, 2019). Turkey turned from a lower-middle-income economy to upper-income economy in 2005. (Felipe, Abdon, & Kumar, 2012). Turkey's GDP per capita was USD 11 707 26 in 2012; however, it showed decreases currently (World Bank Open Data, 2019). Annual spending per student from primary to tertiary education was less than USD 5000 and cumulative education expenditure for per students aged between 6 and 15 was less than USD 50 000 in Turkey (OECD, 2016). Ministry of National Education of Turkey (MoNE) currently developed a new
curriculum to implement in 2018 considering the competency of 21st and literacy skills of students.
Compulsory education in Turkey is 12 years. Similar to Norway, Turkish education divided into three stages. Those stages comprise four years of elementary school, four years of middle school education and four years of high school education. The Turkish national curriculum provides only a few alternate programs in primary education (elementary and middle school). However, it provides many pathways and other programs in secondary education. Students take centrally organized entrance examinations at the end of the Primary (Grade 8) and Secondary education (Grade 12). The previous mathematics curriculum of Turkey aimed to be competent in problem-solving, reasoning, basic mathematic skills, as well as using technology and creative thinking. However, the PISA 2012 mathematics results of Turkey were
31
below average among participant countries. Although Turkey showed improvement in all areas, achievement means the score is below the OECD average in all areas.
The OECD mathematics average percentage of high achiever students (Level 5 and above) were 13%, and low achiever students (below Level 2) were 23% in PISA 2012 cycle. The result of the PISA 2012 revealed that Singapore had the second-highest percentage of high achiever students by the percentage of 40 while the country had the second-lowest percentage of low achiever students by 8% on mathematics. The percentage of low achiever students (below Level 2) was 22% for Norway, 42% for Turkey and 67% for Brazil while the percentage of high achiever students were 9% for Norway, 6% for Turkey and 1% for Brazil in PISA 2012 cycle (OECD,2013d).
Sampling
The sample of this current research include students who are 15 years-old, three months to 16 years, two months old students who participated in the PISA 2012 cycle. The reason for assessing those age range is that compulsory education ends at that age range in most of the countries that participated (PISA, 2019). PISA 2012 assessed the skills of 15 years old students and focused mathematics domain in 65 countries and economies (34 countries are a member of OECD and 31 of them are not a member of OECD). Approximately 510 000 students who are aged between 15 years three months and 16 years two months completed the assessment in 2012 by representing 28 million 15 years sold globally.
32
The two-stage stratified sampling design was used for the PISA assessment (OECD,2013a). Firstly, individual schools having 15-year-old students were
selected. Participant countries prepared a list of eligible students from a minimum of 150 schools in their country. Schools were sampled systematically with probabilities proportional to size (PPS) by the help of the country's list. The first stage of the sampling is used for selecting within sampled schools. Then, the second -stage of the sampling is used for selecting students within schools (OECD, 2013a). Generally, 35 students selected randomly from each sampled school. After students are selected, school principals got permission from their parents because participation was not obligatory.
The participants of the current research are 5506 Brazilian, 4686 Norwegian, 5546 Singaporean and 4848 Turkish students. In the current research, Singapore, Norway, Brazil and Turkey was selected based on their performance in the PISA 2012 cycle. Singapore had a higher mathematics mean score (573.2) than OECD average, whereas Brazil and Turkey had lower mathematics mean score than the OECD average respectively by the score of 391.58 and 448.44. Norway had a similar mathematics mean score (489.30) with OECD average. (see Table 2)
33 Table 2
Sampling of the study
Country Brazil Norway Singapore Turkey
Number of PISA 2012 participants 5506 4686 5546 4848 PISA 2012 Mathematics Ranking 58 30 2 44 Mathematics literacy mean score 391.58 489.30 573.20 448.44
Therefore, Singapore was selected as a high-ranking country with a ranking of 2. Norway was selected as a middle-ranking country with a ranking of 30. Brazil was selected as a low-ranking country with a ranking of 58 among 64 countries. Turkey had a slightly lower mean score than the OECD average, it is selected as a below-average ranking country with the ranking of 44. The ranking of those countries was also similar in previous PISA results. (see Table 2)
Singapore showed a high performance in mathematics in PISA 2012 cycle by
ranking two among 65 countries. The mathematics mean score of the country was 79 points more than the OECD average (494). The country's performance showed significant improvement by ranking as the first country in all domains in PISA 2015 cycle.
Singapore performs above the OECD average in mathematics in PISA. Mathematics education in Singapore aims to help students to concretize mathematics concepts and helps students understand how to solve problems, rather than memorizing. Therefore,
34
the curriculum helps develop literacy and problem-solving skills of students (Deng & Gopinathan, 2016; OECD, 2014).
Norway showed an average performance in mathematics in PISA 2012 cycle by ranking 30 among 65 countries. The mathematics mean score of the country was 5 points less than the OECD average (494 points). Although the country's general performance remained stable, the mathematics performance was slightly lower than comparing its past performances.
The result of the PISA 2012 revealed that the percentage of high achiever students were lower than OECD mathematics average by the percentage of 9.4 in Norway. On the other hand, the percentage of low achiever students showed increases in
comparing its past performances by the percentage of 22.3. The equity level of Norwegian students has improved and 7% of mathematics performance variances explained by the socioeconomic status of students in PISA 2012 cycle. According to the PISA 2012 data, 50% of Norwegian students stated that they are interested in learning mathematics.
Norwegian students performed better in interpreting mathematical situations and problems from data, identifying and summarizing data given different ways, whereas performed worst in formulating mathematical situations, reasoning, applying facts and concepts mathematically. Overall, the country showed weak performance on determining mathematical concepts of a problem, symbolizing patterns in
mathematical situations which are related to algebra, equations, inequalities, graphics and functions.
35
Turkey showed a middle-low performance in mathematics in PISA 2012 cycle by ranking 44 among 65 countries. The mathematics mean score of the country was 46 points less than the OECD average (494 points). The percentage of high-performer students whose proficiency level 5 or 6 was 6% and low-performer students whose proficiency level was below 2 was 42% in Turkey. However, the rate of low
performer students showed a decrease since 2003. According to PISA results, there is a big proficiency level gap between socioeconomic groups, gender, school types and regions in Turkey. PISA 2012 results revealed that 44% of Turkish students are interested in mathematics, and 28% of Turkish students have mathematics anxiety. The percentage of Turkish students who have mathematics interest is higher than the OECD mean. Besides, the results showed that girls have lower interest than boys. However, they have higher instrumental motivation for learning mathematics than boys. Turkish students showed a small difference between space and shape (the strongest) and quantity content areas in mathematics. Turkish students performed better in modelling relationships and changes, interpreting and translating graphics mathematically. Overall, Turkish students better in function and equation topics.
Brazil showed low performance in mathematics in PISA 2012 cycle by ranking 58 among 65 countries. The mathematics mean score of the country was 103 points less than the OECD average (494 points). Although the country showed improvement in mathematics performance since 2003, the mathematics score showed a decrease between 2012 and 2015. Both economically lowest class students and upper-middle-class students showed improvement in mathematics performance in PISA 2012. However, equity in education remained stable since 2003. According to PISA 2012 data, 73% of Brazilian students stated that they are interested in learning
36
mathematics and 49% of students stated that they feel anxious while dealing with mathematics problems (OECD, 2012).
The results of the PISA 2012 revealed that there is a significant achievement gap between high-performer students (1.1% of students), whose proficiency level is 5 or 6, and low-performer students (67.1%), whose proficiency level was below 2, in Brazil. However, the rate of low performer students showed a decrease since 2003. The percentage of top performer students among PISA 2012 participant countries were around 12% however, the percentage of top performer students were lower than 2% in Brazil. Brazilian students performed better in applying, interpreting and evaluating mathematical outcomes. However, performed worst in formulating mathematical situations, the performance of reasoning and employing mathematical concepts of Brazilian students were on average (OECD, 2012).
Overall, the country showed weak performance on determining mathematical concepts of a problem, symbolizing and understanding patterns in mathematical situations. The traditional mathematics topics which Brazilian students struggled were algebra, equations, inequalities, graphics and functions. In the following histograms, the mean scores of each selected country are given.
Instrumentation
There are two types of instruments that PISA mainly uses. One of the instruments involves mathematics literacy test. The other instrument involves background questionnaires for students.
37
PISA 2012 paper-based mathematics literacy test arranged in nine clusters of items which are three ‘link material item clusters from previous PISA surveys, four ‘standard’ item clusters which are a new material comprised wide range difficulty and two ‘easy’ item clusters which comprise lower level difficulty (PISA, 2013a). Each participated country used seven of the mathematics items clusters out of nine clusters. Test booklets were composed of four clusters of material in mathematics, reading and science domains which are designed rotational. Each student was randomly assigned to one of the booklets. The total testing time was 120 minutes, with each cluster representing 30 minutes testing time. Mathematics literacy test included three different item types, which are open-ended, closed constructed-response and multiple-choice items (PISA, 2013a).
Besides PISA 2012 offered computer-based mathematics assessment as optional. The computer-based assessment consisted of four-item clusters with each cluster
representing 20 minutes of test time in total 80 minutes. Item types of computer-based mathematics assessment were wider range because of possible response modes. All participated countries completed paper-based assessment, besides, computer-based assessment completed by 32 countries as an optional and extra. Brazil, Norway and Singapore took computer-based assessment as an optional, however, Turkey did not take optional computer-based assessment. The scores of computer-based assessments also calculated separately (PISA, 2015a).
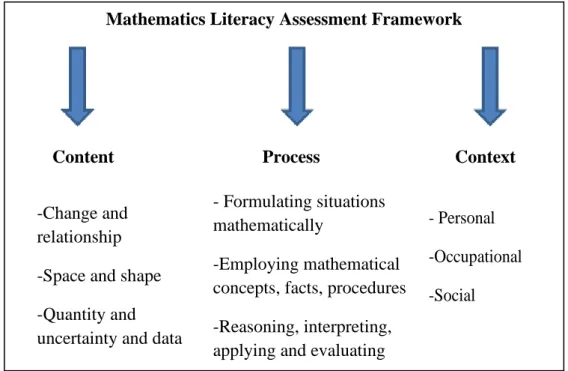
PISA 2012 mathematics literacy assessment items classified three major categories as the content, the context, and the process. The items selected for PISA 2012 are assigned across the four content categories as change and relationships, space and
38
shape, quantity and uncertainty and data. Besides, each item set in one of the four context categories as personal context, the occupational context, the societal context, and the scientific context categories. The selected items also set in one of the three mathematical processes categories as formulating situations mathematically, employing mathematical concepts, facts, procedures, and reasoning, interpreting, applying and evaluating mathematical outcomes. Distribution of items concerning all categories is balanced (OECD,2013a). (see Figure 1)
Figure 1. Mathematics literacy assessment framework in PISA 2012
Mathematics literacy outcomes explained not only as numerical scores but also as proficiency level scales in detail by the help of those categories. PISA mean score scale was 500 with a standard deviation of 100 (OECD, 2013a). (see Table 3)
Mathematics Literacy Assessment Framework
Content Process Context
-Change and relationship -Space and shape -Quantity and uncertainty and data
- Formulating situations mathematically
-Employing mathematical concepts, facts, procedures -Reasoning, interpreting, applying and evaluating mathematical outcomes
- Personal -Occupational -Social
39 Table 3
Mathematics literacy performance band definitions on the PISA scale
Proficiency levels helps explain students' knowledge and ability comparatively. OECD determines the general description of six proficiency levels. (See Appendix A)
PISA background questionnaires gather information about the participating schools, students, and parents. Each participated country answered a school questionnaire and a student questionnaire. The school questionnaire involved information about the school system, the school resources and the school climate answered by the school principals. The questionnaire for students gathered information about the home, school, learning experience and family background of a student. Besides, the student questionnaire gathered information about problem-solving experiences, mathematics learning of a student, mathematics experience of a student at school. Therefore, PISA 2012 student questionnaire was the focus of the current study.
Proficiency Level Score points on the PISA scale
6 Higher than 669.3
5 Higher than 607.0 and less than or equal to 669.3 4 Higher than 544.7 and less than or equal to 607.0 3 Higher than 482.4 and less than or equal to 544.7 2 Higher than 420.1 and less than or equal to 482.4 1 Higher than 357.8 and less than or equal to 420.1