Copyright © 2015 Informa Healthcare USA, Inc. ISSN: 2169-1401 print / 2169-141X online DOI: 10.3109/21691401.2015.1011811
Analysis of the in vitro nanoparticle–cell interactions via a
smoothing-splines mixed-effects model
Elifnur Dogruoz
1, Savas Dayanik
1, Gurer Budak
2& Ihsan Sabuncuoglu
31Department of Industrial Engineering, Bilkent University, Ankara, Turkey, 2Nanomedicine and Advanced Technologies Research Center, Ankara, Turkey, and 3Department of Industrial Engineering, Abdullah Gul University, Kayseri, Turkey
Introduction
Cancer is a disease that causes cells to change, grow, and spread uncontrollably. It may affect almost any part of the body. Most types of cancer form a mass called a tumor. Can-cer was the leading cause of death in the world. In 2008, 7.6 million people died of cancer, comprising around 13% of all deaths. It was estimated that 1 660 290 new cancer cases and 580 350 cancer deaths would occur in 2013, in the United
States alone (Siegel et al. 2013). It is expected that deaths from cancer will rise to over 13.1 million in 2030 (Boyle and Levin 2008).
Current cancer treatment methods involve radiotherapy, chemotherapy, and/or surgical intervention. However, these methods often harm the healthy cells and cause toxicity. In order to provide a less harmful and more effective solution, some research studies have focused on developing targeted nanoparticles (NPs) that can directly deliver drugs to cancer cells. This area of research requires a careful investigation of NP–cell interaction and the cellular uptake process.
Our study aims to investigate the cellular uptake of NPs using the statistical smoothing and mixed-models meth-odology. Data obtained from in vitro NP–cell interaction experiments are used to fit a penalized spline-smoothing model, formulated as a mixed model. The proposed model predicts the cellular uptake rate of NPs having different characteristics. These characteristics are size, shape, chemi-cal structure (type), and surface charge, and the concentra-tion of NP soluconcentra-tions. Although some configuraconcentra-tions of these characteristics cannot be produced due to technical limita-tions (in the chemical production of NPs), the number of the remaining configurations is still vast. Therefore, it is very costly and time-consuming to conduct experiments with all the possible configurations. However, prediction of the cel-lular uptake is still possible by using strong mathematical models. The ultimate aim is to obtain NP specifications with the desired uptake efficiency. Our study has been carried out to achieve that aim.
We have modeled the uptake rates of silica, polymethyl methacrylate (PMMA), and polylactic acid (PLA) NPs into the cell during a 48-h time interval, by means of a penal-ized spline-smoothing-mixed effects model. For each type of NP (silica, PMMA, and PLA), we have developed a model that takes the factors of NP size, charge, concentra-tion, and incubation time as inputs to predict the cellular uptake rate. Our model is based on data obtained from in vitro experiments conducted by the Nanomedicine and
Correspondence: Gurer Budak, Nanomedicine and Advanced Technologies Research Center, Ankara 06810, Turkey. Tel: 905324784529. E-mail: [email protected]
(Received 16 January 2015; accepted 21 January 2015)
Abstract
A mixed-effects statistical model has been developed to understand the nanoparticle (NP)–cell interactions and predict the rate of cellular uptake of NPs. NP–cell interactions are crucial for targeted drug delivery systems, cell-level diagnosis, and cancer treatment. The cellular uptake of NPs depends on the size, charge, chemical structure, and concentration of NPs, and the incubation time. The vast number of combinations of these variable values disallows a comprehensive experimental study of NP–cell interactions. A mathematical model can, however, generalize the findings from a limited number of carefully designed experiments and can be used for the simulation of NP uptake rates, to design, plan, and compare alternative treatment options. We propose a mathematical model based on the data obtained from in vitro interactions of NP–healthy cells, through experiments conducted at the Nanomedicine and Advanced Technologies Research Center in Turkey. The proposed model predicts the cellular uptake rate of silica, polymethyl methacrylate, and polylactic acid NPs, given the incubation time, size, charge and concentration of NPs. This study implements the mixed-model methodology in the field of nanomedicine for the first time, and is the first mathematical model that predicts the rate of cellular uptake of NPs based on sound statistical principles. Our model provides a cost-effective tool for researchers developing targeted drug delivery systems. Keywords: linear mixed model, nanomedicine, nanoparticle
uptake rate, smoothing splines, targeted drug delivery
Advanced Technologies Research Center in Turkey. Three types of sphere-shaped NPs (silica, PMMA, and PLA) have been used in the experiments. Silica and PMMA NPs were produced with diameters of 50 and 100 nm, and PLA NPs were produced with a diameter of 250 nm. For each type and size, NPs were produced with positive and negative surface charges. NP solutions with concentrations of 0.001 mg/l and 0.01 mg/l were prepared and added to healthy cell cultures. The number of NPs removed from the environment was counted at 3, 6, 12, 24, and 48 h of incubation. The difference between the number of NPs added to and removed from the environment has been calculated as the number of NPs that penetrated the cell or attached to the cell surface. The experi-ment was repeated six times for each different configuration of NP characteristics. For silica NPs, the experiments were replicated for all combinations of size, charge, and solution concentration. Observations were taken at different time points in the second replication. Also, PMMA experiments conducted with positively charged NP solutions with con-centrations of 0.001 mg/l and 0.01 mg/l were replicated, and observations were taken at the same time points in both replications. Having correlated data coming from more than one replication was the main reason why we preferred the mixed model to represent this uptake process.
Over the past few years, numerous experimental studies have been conducted to explore nanoparticle–cell interac-tion. In those studies, the effects of NP size, surface charge, concentration, chemical structure, and incubation time on the NP–cell interaction have been investigated. Most of those studies contain no mathematical models of NP–cell interac-tion, but provide general comments about the influence of some of the properties of NPs. Davda and Labhasetwar (2001) have investigated the uptake of NPs by endothelial cells in cell culture. They observed that uptake increases with the increase in the concentration and the incubation time. Chithrani et al. (2006) have also investigated the effect of incubation time on the cellular uptake of colloidal gold NPs by mammalian cells. Their results have also demonstrated that the drug delivery via NPs can be controlled by adjusting the size and shape of the NPs. Peetla and Labhasetwar (2008) have investigated the effects of surface chemistry and size of NPs on the interaction between NPs and a model endothelial cell membrane. Lin et al. (2010) have examined the impact of charge on the interactions of gold NPs with model lipid membranes.
In the previously mentioned studies, NP–cell interac-tion was only explored through observainterac-tions collected from physical experiments. Although they shed light on the role of various NP properties in the NP–cell interaction, none of them describe a mathematical model that relates the prop-erties of NPs to the NP–cell interaction. Hence, they are inca-pable of predicting the cellular uptake rate, which is the aim of our research. Besides, none of the previous studies have investigated the interactions between different NP properties (chemical structure, size, charge, and concentration of NPs) and their concurrent action, as we do in our study. In one of the very few studies proposing some mathematical models, Boso et al. (2011) tried to identify the optimal configura-tion that maximizes the NP accumulaconfigura-tion at the diseased
site. They conducted a parallel plate flow chamber in vitro experiment with spherical polystyrene NPs and developed a model of artificial neural networks (ANN) to predict the number of NPs adhering to the vasculature as a function of shear rate and NP diameter. They showed that an optimal particle diameter exists for which the number of NPs adher-ing to the vessel walls is maximized. That optimal diameter depends on the wall shear rate, which is controlled by the flow rate through the syringe pump. Their study investigated the effects of only the NP size and the wall shear rate on the NP accumulation. However, they did not use real cells. Although the scope of the study was very limited, it showed that mathematical models can help minimize the number of experiments otherwise needed to adequately understand NP–cell interaction, which is the motivation of this research. Another mathematical model was proposed by Cenk et al. (2014). They investigated the NP–cell relations regard-ing the effects of NP size, surface charge, concentration, and chemical structure. They developed a model of ANN to pre-dict the cellular uptake by utilizing the same data set used in our study. Smoothing with linear mixed-models is often pre-ferred over ANN because the latter are considered as black boxes and their outputs are harder to interpret. Furthermore, when experiments are replicated, as for the silica and PMMA NPs in our experiments, the mixed-model approach allows them to be naturally tied to a single model by means of suit-able random effects.
Although the mixed-model approach has not been used in the area of nanomedicine until now, it has been widely used to analyze clustered medical data. Mixed models can handle clustering effects by modeling them as random vari-ables. Mixed models are also tolerant of missing data (Brown and Prescott 2006). Moreover, mixed models are better at modeling complex input–output relations such as NP–cell interaction. To the best of our knowledge, our study is the first to propose a linear mixed model for cellular uptake rate. We expect that our new model will advance the research in targeted drug delivery. It contributes to applied statistics as a novel application of mixed models.
The remainder of the paper is organized as follows: our experimental methodology and design are discussed in sec-tion on ‘Materials and methods’. Our findings are presented in the section ‘Results’, and summarized in the concluding section of the report.
Materials and methods
The effective use of NPs in targeted drug delivery depends on the knowledge of the interaction between the cells and NPs. The cellular uptake of NPs depends on the size, shape, surface charge, chemical structure, and concentration of the NPs. However, it is not practical to conduct all experiments with a vast number of different values of these variables. Moreover, analysis of the experimental data is complex because of the statistically fluctuating environment of living organisms. Hence, the most efficient and reliable synthesis of the interaction data is a well-thought out statistical/math-ematical model of the complex relation between the cell uptake rate and NP characteristics. In this research, for each In vitro NP–cell interactions via a smoothing-splines mixed-effects model 801
type of nanoparticle (silica, PMMA, and PLA), we model the percentage of NPs that penetrate or attach to the cells in a 48-h time interval as a function of size, charge, and density of NPs. We use the smoothing mixed-model approach. Mixed models are designed to handle both fixed and random effects. Fixed effects are population-averaged parameters and influence average cellular NP uptake rate, while random effects address variabilities in cellular NP uptake rate due to different cases under the same treatments. Mixed models can also naturally handle semiparametric smoothing that is able to capture nonlinear relationships between predic-tors and NP cellular uptake rate. We prefer semiparametric smoothing because it can capture important local variations in uptake rates. Besides, the experiments replicated with silica and PMMA NPS can be treated most naturally with random effects in mixed-effect model setup. Those replica-tions are similar to subjects selected at random from the same population. If we fit a model for each replication, we need to estimate too many parameters, and the estimates will then be less accurate. We also need a meaningful model of future realizations as well as for past observations. Mixed models can fulfill these requirements.
Table I presents the characteristics of NPs used in our research.
In addition to the input variables of Table I, a categorical random effect variable, Repeat, is defined to track the repli-cation number for the models of Silica and PMMA. Repeat has two levels, 1 and 2, since the experiments were replicated twice for silica and PMMA. It has no fixed-effect counterpart. We may consider repeated experiments as randomly chosen subjects from a population. Since we want to predict the general behavior of the population for future replications, we include Repeat as a random effect. The aim of this study is to predict the cellular uptake rate. Hence, the cellular uptake rate is the output variable for all types of NPs. It is calculated according to the formula
Cellular uptake rate
Number of NPs attached to cell surfac
= ee or entered into cells
Total number of NPs added to the ceell culture
.
(1)
Experimental procedure
The data set used in this study was obtained from in vitro nanoparticle–cell interaction experiments conducted by the Nanomedicine and Advanced Technologies Research Cen-ter. Three types of NPs were used for the experiments: silica, PMMA and PLA. All of the NPs were spherical. Silica and
PMMA NPs were produced in two different sizes, namely, with diameters of 50 and 100 nm. PLA NPs were produced with a diameter of 250 nm. For each type and size of NP, two surface charges, positive and negative, were selected. NP solutions with two different concentrations, 0.001 mg/l and 0.01 mg/l, were prepared. In these experiments, the “3T3 Swiss albino mouse fibroblast” type of healthy cell set was used. Cells were incubated in a medium containing 10% FBS, 2 mM L-glutamine, 100 IU/ml penicillin and 100 mg/ml streptomycin, at 37°C with 5% CO2. After incubation, prolif-erating cells in the culture flask were passaged using PBS and trypsin-EDTA solution. Then, the cells incubated for 24 h were counted and placed on 96-well cell culture plates. NP solutions were added to the plates.
Micromanipulation systems in the labs, established as a “clean room” principle, were used in the in vitro NP–cell experiments. Spectrophotometric measurement methods, transmission electron microscopy, and confocal microscopy were used to examine NP–cell interactions and to obtain the data.
For silica and PMMA NPs, there were 8 different con-figurations (50 or 100 nm diameter, positively or negatively charged, at a concentration of 0.001 or 0.01 mg/l) used; for PLA NPs, there were 4 different configurations (250 nm diameter, positively or negatively charged, at a concentration of 0.001 or 0.01 mg/l) used. These led to 20 different rations of NPs in total. For each of the 20 different configu-rations of NPs, the experiments were repeated six times. At 3, 6, 12, 24, 36, and 48 h of incubation, the number of NPs removed from the environment was counted by washing the solution. The difference between the number removed from the environment and the initial number of NPs that the cells were exposed to was taken as the number of the NPs that had attached onto the cell surface or penetrated into the cells. Then, the cellular uptake rate was calculated by dividing that number by the initial number of the NPs that the cells were exposed to.
For the eight different configurations of silica NPs, the experiments were repeated and measurements were taken at 1.5, 4, 9, 18, 30, and 42 h of incubation in order to observe the process at time intervals of the first replication. For two configurations of PMMA NPs (size of 50 and 100 nm with concentration of 0.001 mg/l and positive surface charge), the experiments were repeated and measurements were taken at the same time points as those of the first replication, to check for the consistency of the results of the first replication.
Proposed models
In this research study, we have developed a smoothing-splines mixed-effects model for each type of NP (silica, PMMA, and PLA). We have used penalized splines that can be fitted as mixed models (Speed 1991). Wand (2002) also uses the mixed-model theory to fit splines, and states that the software for mixed-model analysis can be used for smoothing. The linear mixed-model formula is
y X Zu Cov u N I I u = + + é ë ê ù û ú é ë ê ù û ú é ë ê ù û ú æ è çç öø÷÷ b e e s se , ~ 0 , , 0 0 0 2 2 (2)
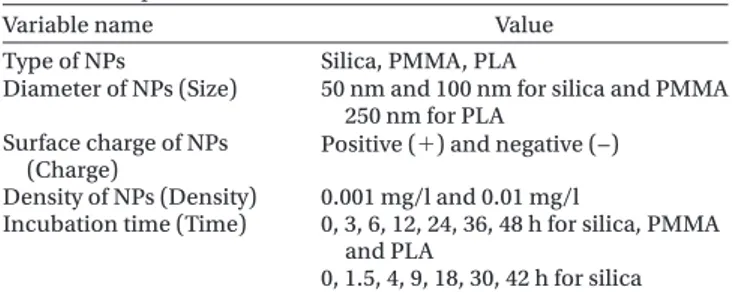
Table I. Nanoparticle characteristics.
Variable name Value
Type of NPs Silica, PMMA, PLA
Diameter of NPs (Size) 50 nm and 100 nm for silica and PMMA 250 nm for PLA
Surface charge of NPs
(Charge) Positive () and negative (−) Density of NPs (Density) 0.001 mg/l and 0.01 mg/l
Incubation time (Time) 0, 3, 6, 12, 24, 36, 48 h for silica, PMMA and PLA
0, 1.5, 4, 9, 18, 30, 42 h for silica
variables are included in the Z-matrix. Models are fitted to the data by using lme() function of package nlme in R soft-ware. The significance of terms is tested with ANOVA, and the insignificant terms are eliminated. Moreover, Repeat (R) is modeled as a random effect in models developed for silica and PMMA, because we want to draw an inference not only for those two replications but for the future replications as well. After the model (2) is fit in R, b and uˆ ˆ are obtained. To present the hourly predictions of the cellular uptake, X and Z matrices are formed for hourly grid Time 0, 1…48 h. The fitted lines are obtained with the formula
ˆ ˆ ˆ.
y X= b+Z u (8) Proposed model for silica NPs
In this model, we want to predict the fraction of silica NPs that are attached to the cell surface or have penetrated into the cell. This fraction, Uptake rate (U), is controlled by two-level categorical variables of Size (S), Charge (C), Density (D), and the continuous variable Time (T). The intercept is forced to be zero because uptake rate is zero at time zero. Hence, we do not have an intercept term. Two-way, three-way, and four-way interactions of those variables are included in the design matrix. To construct the Z-matrix, the required num-ber of knots is found to be three, with Formula (6), and the knot locations are calculated as 5.5, 15, and 31.5 with For-mula (7). The quadratic spline basis for our model becomes
(T-5 5. ) , (+2 T-15) , (2+ T-31 5. )+2
(9) Proposed model for PMMA NPs
We have 12 unique Time values in the PMMA NP experi-ments, and 3 knots are recommended by Formula (6). How-ever, a poor fit was obtained with 3 knots, whose locations were computed by Formula (7). We tried 5 knots, which gave a highly satisfactory fit. Knots are located at k1 5.5, k2 10, k3 18, k4 28 and k5 38 by Formula (7). Thus, the qua-dratic spline basis becomes
(T-5 5. ) , (2+ T-10) , (+2 T-18) , (2+ T-28) , (2+ T-38) .+2 (10)
Moreover, Repeat (R) is modeled as a random effect, as in the model of silica NPs.
Proposed model for PLA NPs
We obtained a good fit with 3 knots. Knots are located at k1 7.5, k2 18 and k3 33 by (7). The quadratic spline basis for our model becomes
(T-7 5. ) , (2+ T-18) , (+2 T-33) .+2 (11)
Results and discussion
Silica NPs
According to ANOVA results, we find that Time (T), Time Size (TS), Time Charge (TC), Time Density (TD), Time Size Charge (TSC), Time Charge Density (TCD), Time2 (T2), Time2 Size (T2S), Time2 Charge (T2C), Time2
Density (T2D), Time2 Size Charge (T2SC), Time2
where y y y u u u n k = é ë ê ê ê ù û ú ú ú =é ë ê ù û ú = é ë ê ê ê ù û , , 1 0 1 1 b b b úúúú = é ë ê ê ê ù û ú ú ú ,X , x xn 1 1 1 and Z x x x x K n n K =
-(
)
(
-)
-(
)
¼(
-)
é ë ê ê ê ù û ú ú ú + + + + 1 1 1 1 k k k k are the output vector, fixed effects, random effects, and design matrices, respectively. The function
( ) , , , x x x - < -ì í î = + k k k 0 if otherwise (3)
is called a truncated line basis function with knot k, and a collection of such functions is called a truncated spline basis. A spline is a piecewise linear function which is a linear combination of linear spline basis 1, ,(x x-k1) , ,(+¼ x-kK)+
(Ruppert et al. 2003). We have used a quadratic truncated spline basis for constructing the Z-matrix.
For given se2 and s u
2, solving the penalized least squares
problem ˆ ˆ , b b a b u u y X Z u u é ë ê ê ù û ú ú=arg min - - + 2 2 (4) with a s s= e2 u2 and penalty a u
2
gives the best predictors ˆ
b and ˆu (Robinson 1991). The solution is
( ) , ˆ ˆ b a u C C D C y T T é ë ê ê ù û ú ú= + -1 (5) where C= [X Z]and D I K K K K =é ë ê ù û ú ´ ´ ´ ´ , 0 0 0 2 2 2 2
where K is the number of knots. (Wand 2002). The number of knots is found by the formula
K= ´ xi æ è ç öø÷ min 1 , , 4 number of unique 35 (6)
and the knots are located at
kk i k K x k = + + æ è ç öø÷ = , 1 2 1
th sample quantile of the
unique for ……,K (7)
as proposed by Ruppert et al. (2003). Formulas (6) and (7) generally give good results, but sometimes, adjustments are required.
Separate models are fitted for silica, PMMA, and PLA, because each type of NP exhibits different behavior. In the proposed models, the cellular uptake rate, denoted by U, is predicted with the smoothing-splines mixed-effects model. All interactions of the input variables are included in the design matrix X. Random counterparts of all the fixed-effect
Charge Density (T2CD), and Time2 Size Charge
Den-sity (T2SCD) are significant fixed effect variables.
Random-effect counterparts of Size and Size Density turn out to be insignificant. Hence, after the elimination of insignificant terms, the final design matrices are
X T TS TC TD TSC TCD T T S T C T D T SC T CD T SCD [ ], = 2 2 2 2 2 2 2 (12) and Z T T T C T C T C T [( . ) ( ) ( . ) ( . ) ( ) ( = - - -´ - ´ - ´ + + + + + 5 5 15 31 5 5 5 15 2 2 2 2 2 --´ - ´ - ´ -´ - ´ + + + + + 31 5 5 5 15 31 5 5 5 2 2 2 2 2 . ) ( . ) ( ) ( . ) ( . ) ( D T D T D T SC T SC TT SC T CD T CD T CD T S - ´ -´ - ´ - ´ -+ + + + + 15 31 5 5 5 15 31 5 2 2 2 2 2 ) ( . ) ( . ) ( ) ( . ) C CD T´ -( 5 5. )2+SCD T´ -( 15)+2SCD T´ -( 31 5. ) .+2] (13)
The final form of the proposed model for Silica NPs becomes U f T TS f f f f f T T T T R R C R D R SC R CD R SCD R = + + + + + + ( ) ( ) ( ) ( ) ( ) b2 (( )T +eR, (14)
where all f functions are smooth functions of the terms whose fixed and random counterparts are both found statistically significant.
With the mixed model formulation, (14) is written as
U T T TS TC TD TSC TCD TSCD u T R k R k = + + + + + + + + -b b b b b b0 1 b b 2 2 3 4 5 6 8 1 { ,( k )++ = + + +
å
+ -+ - + -+ 2 1 3 2 2 3 2 4 2 k k R k k R k k R k u TC T u TD T u TSC T , , , ( ) ( ) ( ) k k k u u TCD Tk u TSC T R k k R k R 5 2 6 2 , ( -k )++ , ( -k )++e }, (15)where b b0, ,1 ¼,b7 are fixed parameters and
u1k u k uk u k 1 7 1 1 2 6 2
, , ,¼ , , , , ,¼ , are random variables for
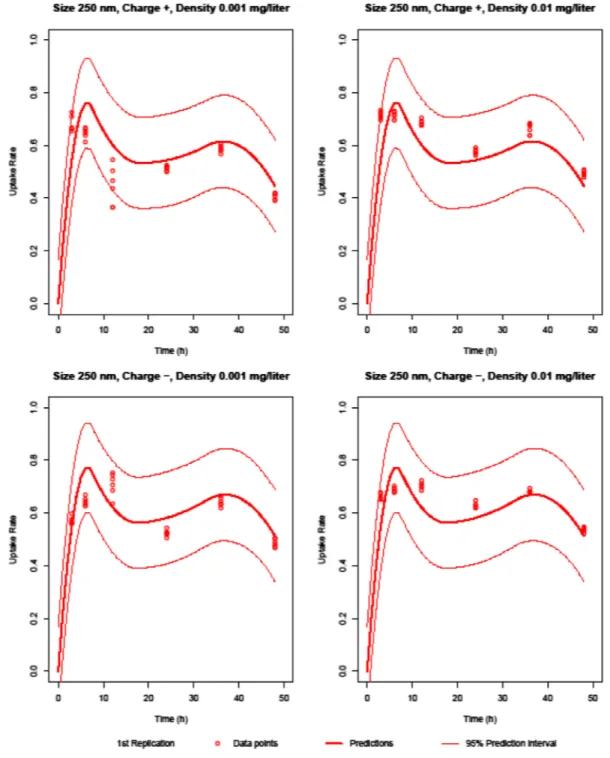
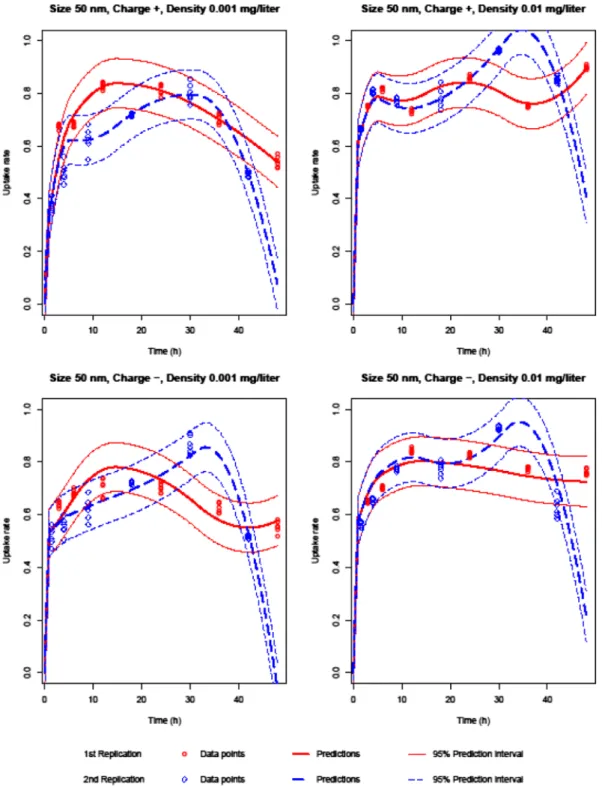
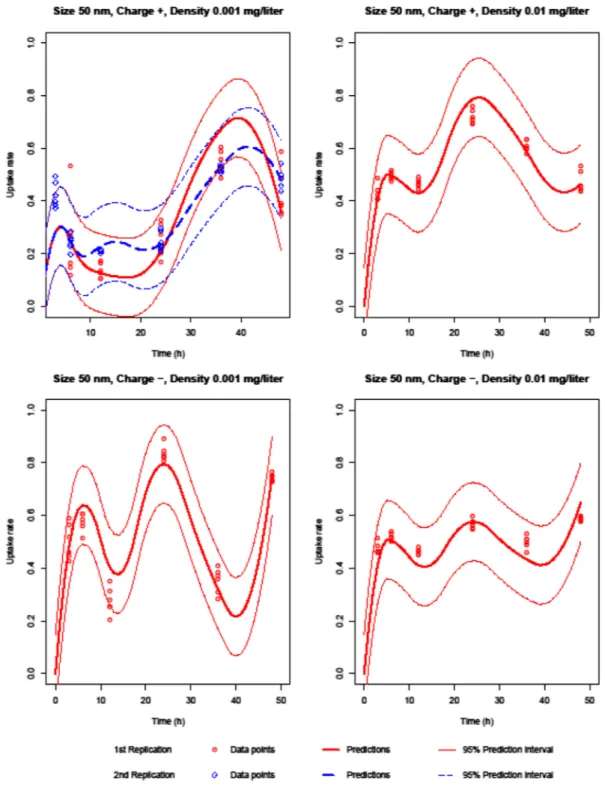
replica-tions 1 and 2, respectively, where k 1, 2, 3. Predicreplica-tions for silica NPs can be seen in Figures 1 and 2.
Silica NPs penetrate rapidly into the cell at the beginning of the incubation. Then, the cellular uptake decreases. As can be seen from Figures 1 and 2, all characteristics and almost all their interactions are effective on the uptake rate. The uptake rate is higher when the concentration is high. When NP size is 100 nm and concentration is 0.01 mg/l, positively charged NPs have lower uptake rate than the negatively charged NPs. However, for other size and concentration con-figurations, negatively charged NPs have lower uptake rate. Another observation is that when NP charge is positive, the 50 nm NPs penetrate into or adhere to the cell faster than the 100 nm NPs, approximately in first 9 h of incubation. How-ever, the uptake rate of NPs of 100 nm diameter is generally higher than the uptake rate of NPs of 50 nm diameter, for all configurations of silica NPs. The reason for this may be that the 50 nm NPs agglomerate more in the extracellular parts. Hence, the size of agglomerated parts gets bigger and pen-etration into the cell becomes harder.
PMMA NPs
For PMMA NPs, we apply ANOVA to test the significance of each term in the model after fitting the model with initial design matrices. We find that Time (T), Time Size (TS), Time Charge (TC), Time Density (TD), Time Size Charge (TSC), Time Size Density (TSD), Time Charge Density (TCD), Time Size Charge Density (TSCD), and Time2 (T2) are the significant fixed-effect variables. However, the random counterparts of Time Size Density (TSD) and insignificant fixed-effect variables are insignificant.
After removing the statistically insignificant variables, the new X and Z matrices become
X=[T T2 TS TC TD TSC TSD TCD TSCD], (16) and Z T T T T T S [ ( . ) ( ) ( ) ( ) ( ) = - - -- - ´ + + + + + 5 5 10 18 28 38 2 2 2 2 2 (( . ) ( ) ( ) ( ) ( ) T S T S T S T S T C -´ - ´ - ´ -´ - ´ + + + + + 5 5 10 18 28 38 2 2 2 2 2 (( . ) ( ) ( ) ( ) ( ) T C T C T C T C T - ´ -´ - ´ - ´ -+ + + + + 5 5 10 18 28 38 2 2 2 2 2 ( . ) ( ) ( ) ( ) ( ) ( D T D T D T D T D T SC ´ - ´ - ´ -´ - ´ - ´ + + + + + 5 5 10 18 28 38 2 2 2 2 2 TT SC T SC T SC T SC T CD -´ - ´ - ´ -´ - ´ + + + + + 5 5 10 18 28 38 2 2 2 2 2 . ) ( ) ( ) ( ) ( ) (TT CD T CD T CD T CD T SC - ´ -´ - ´ - ´ -+ + + + + 5 5 10 18 28 38 2 2 2 2 2 . ) ( ) ( ) ( ) ( ) D D T SCD T SCD T SCD T SCD T ´ - ´ - ´ -´ - ´ -+ + + + ( . ) ( ) ( ) ( ) ( 5 5 10 18 28 3 2 2 2 2 88) ],2 + (17)
respectively. For PMMA NPs, the proposed model is
U f T f T f T f T f T f T f R R S R C R D R SC R CD R = + + + + + + ( ) ( ) ( ) ( ) ( ) ( ) SSCD R R T TSD ( )+b +e , (18)
where all f functions are smooth functions. The final mixed model can now be written as
U T T TS TC TD TSC TCD TSCD u T R k R k = + + + + + + + + -b b b b b b b b 0 1 2 2 3 4 5 6 8 1 { ,( k )++ = + + +
å
+ -+ - + -+ 2 1 3 2 2 3 2 4 2 k k R k k R k k R k u TC T u TD T u TSC T , , , ( ) ( ) ( ) k k k u u TCD Tk u TSC T R k k R k R 5 2 6 2 , ( -k )++ , ( -k )++e }, (19)where b0,¼,b8 are fixed effects and u1k u k uk u k 1 7 1 1 2 7 2 , , ,¼ , , , , ,¼ ,
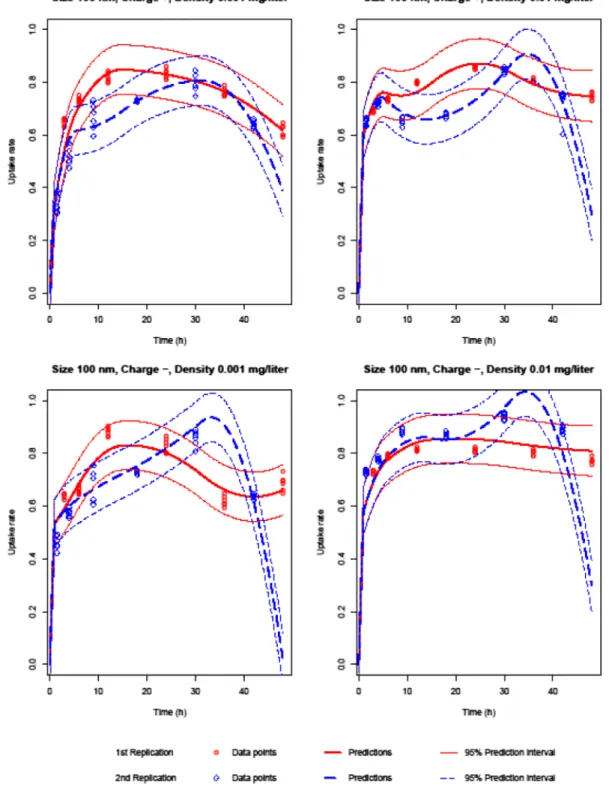
are random effects for replications 1 and 2, respectively, for each k 1, 2, 3. Hourly predictions for PMMA NPs can be seen in Figures 3 and 4.
Similar to the rate of cellular uptake of silica NPs, the rate of uptake of PMMA NPs is rapid in the first 6 h of incuba-tion. Then, the cellular uptake rate decreases for a while and fluctuates. All NP characteristics are effective on the uptake rate. The uptake rate fluctuates more when the concentra-tion is low. NPs of 100 nm diameter behave less erratically
Figure 1. Silica 50 nm predictions.
than those of 50 nm diameter. Moreover, 50 nm NPs have a higher uptake rate than the 100 nm NPs, approximately in the first 30 h of incubation. When NP concentration is high, positively charged NPs have a higher uptake rate than the negatively charged NPs. We have also observed that NPs of 0.001 mg/l concentration have higher uptake rate when NP charge is negative.
PLA NPs
For PLA NPs, after fitting our model to the data and apply-ing ANOVA, we find that Time (T), Time Density (TC), and Time2 (T2) are significant fixed-effect variables. Their
random counterparts are also significant. After eliminating the insignificant terms, the new X and Z matrices become
X=[T TC T2], (20) and Z T T T C T C T [( . ) ( ) ( ) ( . ) ( ) = - - -´ - ´ -+ + + + + 7 5 18 33 7 5 18 2 2 2 2 2 C´(T- ) ,] + 332 (21) respectively.
Figure 2. Silica 100 nm predictions.
U=f T( )+f TC( )+e, (22)
where f is a smooth function of Time and fc is a smooth function of Time Charge (TC). In the mixed-model formulation, U T T TC u T u TC T k k k k k = + + + - + -= +
å
{ , ( ) , ( b0 b1 b 2 2 1 3 1 2 2 k k )) }+2 +e, (23)where b b0, , and 1 b2 are fixed parameters, and u u1,k, 2,k are
random variables for every k 1, 2, 3. Figure 5 displays both data and the fit from our model.
For PLA, 250 nm NPs have similar uptake rates and fluctuations in this experimental setup, although they have different concentrations and zeta potentials. PLA NPs have a more organic structure and degrade more than silica and PMMA NPs. Independent of the concentration, the endocy-tosis–exocytosis balance and the electrical charge of the cell membrane are more effective on the uptake rate of PLA NPs. 806
Figure 3. PMMA 50 nm predictions.
That balance does not change for organic structures. Hence, the surface charge and endocytosis rate of the cell mem-brane determine the uptake rate. The uptake rate is slightly higher for the negatively charged NPs than for the positively charged NPs.
Derivation of prediction intervals
Recall the mixed model formulation in (2)
y X= b+Zu+e ,
whereX=[1 xi]1£ £i nandZ=[(xi-kk) ]+ £ £1i n,1£ £k K. We can
write
f x( )=Xxb+Z ux , (24)
in terms of Xx=[1 x]andZx=[(x-kk) ]+ £ £1k K. For the
mixed-model representation of penalized splines, Ruppert et al. (2003) derive the 100(1-a)% confidence interval as
ˆ( ) ; { ˆ( ) ˆ . . ( )}, f x t dfres std dev f x f x ± -æ è ç1 a2 öø÷s e - or smalll n, for large n, z 1 std dev f x f x 2 -æ è ç ö ø ÷ -ì í ï ï a . . ( ){ ˆ ( )}, îî ï ï (25) where
Figure 4. PMMA 100 nm predictions. std dev f x f x C C Cx D C T u x T . .{ ( )^ ( )} ^ , - = æ + è ç ö ø ÷ -s s s e e 2 2 1 (26) Cx=[Xx Zx], and D diag=
[
0 0 1, , , . .¼1]
Therefore, 100(1-a)% prediction interval for our case is
ˆ( ) . f x z C C Cx D C T u x T ± æ -è ç öø÷ + æ + è ç ö ø ÷ -1 2 1 2 2 1 a s s s e e (27) Figures 1–5 plot both fits and their 95% prediction inter-vals obtained from our models.
Conclusion
In this study, a penalized spline-smoothing mixed-effects model has been developed to investigate nanoparticle–cell interaction. This model enables us to predict the cellular uptake rate of NPs. The factors affecting the uptake rates are chemical structure, size, surface charge, concentration of NPs, and incubation time. Because of the vast number of combinations of these variable values, it is impractical to experiment with each combination in order to understand the uptake rate. This study contributes to our understand-ing of NP–cell interaction with a statistical model based on a manageable number of experiments. Our model takes NP characteristics as predictors and predicts the NP cellular 808
Figure 5. PLA predictions.
uptake rate for up to 48 h of incubation time. Some of the experiments have been replicated in order to get more accu-rate results, and our model is able to handle replications appropriately by means of random effects built in mixed-modeling.
In our study, we have observed that different types of NPs exhibit different behaviors in interacting with the cells. Therefore, we fit separate models for each type of NP. The cellular uptake rate of silica NPs is less erratic and stays stable, longer than that of PMMA and PLA NPs. Moreover, the uptake rate of silica NPs is generally higher than those of PMMA and PLA NPs. Among the three types of NPs, PMMA NPs are the ones whose uptake rate is the most fluctuating. Despite these differences, there are some similarities. All NP types penetrate into the cell or attach to the cell surface very
rapidly at the beginning of incubation. Then, the uptake rate decreases and continues to fluctuate.
For silica NPs, all characteristics and almost their all inter-actions are effective on the uptake rate. The uptake rate of NPs of 100 nm size is generally higher than the uptake rate of 50 nm NPs. This may be because the 50 nm NPs agglomerate in the extracellular parts, and penetration of the agglomer-ated parts becomes harder. For PMMA NPs, all chemical and surface characteristics are effective on the uptake rate, like-wise for silica NPs. One prominent observation is that NPs of 100 nm diameter behave less erratically than those of 50 nm diameter. For PLA NPs, the uptake is higher for NPs with positive charge, and concentration has no effect on it.
This study is a new application of mixed-effect modeling in nanomedicine. To the best of our knowledge, after Cenk In vitro NP–cell interactions via a smoothing-splines mixed-effects model 809
References
Boso DP, Lee S, Ferrari M, Schrefler BA, Decuzzi P. 2011. Optimizing par-ticle size for targeting diseased microvasculature: from experiments to artificial neural networks. Int J Nanomedicine. 6:1517–1526. Boyle P, Levin B. 2008. World Cancer Report. Lyon: International
Agency for Research on Cancer.
Brown H, Prescott R. 2006. Applied Mixed Models in Medicine, Second Edition, Newyork: Wiley.
Cenk N, Budak G, Dayanik S, Sabuncuoglu I. 2014. Artificial neural network modeling and simulation of in-vitro nanoparticle cell inter-actions. J Comput Theor Nanos. 1:272–282.
Chithrani BD, Ghazaniand AA, Chan WCW. 2006. Determining the size and shape dependence of gold nanoparticle uptake into mamma-lian cells. Nano Lett. 6:662–668.
Davda J, Labhasetwar V. 2001. Characterization of nanoparticle uptake by endothelial cells. Int J Pharm. 233:51–59.
Lin J, Zhang H, Chen Z, Zheng Y. 2010. Penetration of lipid membranes by gold nanoparticles: Insights into cellular uptake, cytotoxicity, and their relationship. ACS Nano. 4:5421–5429.
Peetla C, Labhasetwar V. 2008. Biophysical characterization of nano-particle-endothelial model cell membrane interactions. Mol Pharm. 5:418–429.
Robinson GK. 1991. [That BLUP is a Good Thing: The Estimation of Random Effects]: Rejoinder. Statist Sci. 6:15–32.
Ruppert D, Wand MP, Carroll RJ. 2003. Semiparametric Regression. New York, NY: Cambridge University Press.
Siegel R, Naishadham D, Jema A. 2013. Cancer statistics. CA Cancer J Clin. 63:11–30.
Speed T. 1991. [That BLUP is a Good Thing: The Estimation of Random Effects]: Comment. Statist Sci. 6:42–44.
Wand M. 2002. Smoothing and mixed models. Comput Stat.18: 223–250.
et al.’s model (2014), this study is the second mathematical model of NP–cell interactions, but unlike Cenk’s work, it is based on formal statistical principles. Our model is a linear statistical model, which makes the interactions between NP characteristics easier to understand than their nonlin-ear ANN model. Our model is also capable of linking data obtained at different times by means of the random effects. Our model will greatly help the researchers working on tar-geted drug delivery systems, and predict the average NP cel-lular uptake rates for NPs with different characteristics on a timely and cost-effective basis.
In the future, support vector machines can be used to model the uptake process of NPs. NP–cancer cell interactions can be likewise studied by the methods of this study. The models of this study can be applied to data obtained from in vivo experiments as well. Furthermore, different types of cells could be used in experiments, and our model could be extended to combine all experimental results.
Declaration of interest
The authors report no declarations of interest. The authors alone are responsible for the content and writing of the paper.
![Figure 4. PMMA 100 nm predictions. std dev f x f x C C C x T D C u x..{ ( )^( )}^ T ,-=æ+ èç öø÷ -ssese22 1 (26) C x = [ X x Z x ], and D diag= [ 0 0 1 , , ,](https://thumb-eu.123doks.com/thumbv2/9libnet/5562593.108576/9.914.148.761.75.918/figure-pmma-predictions-std-èç-öø-ssese-diag.webp)