Comparing the efficacy of exercise, internal
and external shoe modification in pes planus:
A clinical and pedobarographic study
Ozgur Taspinar
a,∗, Derya Demirbag Kabayel
b, Ferda Ozdemir
c, Hakan Tuna
b, Yasar Keskin
a,
Oznur Berke Mercimek
d, Necdet Süt
e, Selcuk Yavuz
band Filiz Tuna
baPhysical Medicine and Rehabilitation Department, Bezm-i Alem Vakif University School of Medicine, Istanbul,
Turkey
bPhysical Medicine and Rehabilitation Department, Trakya University School of Medicine, Edirne, Turkey cPhysical Medicine and Rehabilitation Department, Medipol University School of Medicine, Istanbul, Turkey dPhysical Medicine and Rehabilitation Department, Rize State Hospital, Rize, Turkey
eBiostatistics Department, Trakya University School of Medicine, Edirne, Turkey
Abstract. Pes planus is a condition that can cause pain along the innerfoot due to the absence or abnormal depression of the lon-gitudinal arch. There are few studies available that compare therapy modalities used in these patients. In our study, those treated with conservative therapies – internal and external shoe modifications and pes planus exercises – were compared clinically and pedobarographyically. 60 pes planus patients were included in the study. In the first group; internal modification was performed by placing a medial longitudinal arch support inside the shoe. In the second group, external shoe modification was performed using the Thomas heel. In the third group of patients however, only an exercise program was executed. The patients’ foot pain levels, functional asssessment, satisfaction and quality of life were recorded. Pedobarography was used in measuring both static and dynamic plantar pressure. Assessments were carried out at baseline and at the end of the first and third months respectively where intra- and inter- group comparisons were performed. Each group was composed of 20 subjects. While improvement in terms of foot pain, foot function index and quality of life was observed in all the study groups (p < 0.05), the most improve-ment was observed in the group of patients treated with internal modification (p < 0.016). This was followed by the external modification and the exercise groups respectively. No difference was observed between the internal and external modification groups in terms of patient satisfaction. Cross-sectionally; clinical assessments, pedobarographic analysis were correlated. The changes observed after static and dynamic pedobarographic studies were not significantly different between the study groups. At the end of the study it was observed that internal modification yielded the most significant clinical improvement. In the literature, there are limited publications comparing the conservative treatments with each other. In this study we aimed to compare the conservative treatments for flatfoot.
Keywords: ???
1. Introduction 1
Pes planus is the absence or depression of the lon-2
∗Corresponding author: Ozgur Taspinar, Department of
Pyhisi-cal Therapy and Rehabilitation, Alem Vakıf Unıversity School of Medicine, Istanbul, Turkey. Tel.: +90 212 533 23 26; Fax: +90 5326745917; E-mail: [email protected].
gitudinal arch while standing [1]. Frequency of pes 3 planus among adolescents and adults is reported in a 4 wide range of 1.1–43.2% [2]. There are three different 5 types of pes planus namely; flexible pes planus, short 6 achille tendon-flexible pes planus and peroneal spas- 7 tic or rigid pes planus. Flexible pes planus forms two 8 thirds of all pes planus cases [3]. Diagnosis was con- 9 firmed by direct radiograpgy in pes planus suspected 10
patients who referred to Pyhsical Therapy Rehabilita-11
tion outpatient unit with foot problems. Pes planus di-12
agnosis was concluded in direct radiography by eval-13
uation of calcaneal inclination angle. Calcaneal incli-14
nation angle is the most suitable because it provides 15
the most reliable diagnosis and is the most sensitive 16
in showing structural changes [4]. However, in assess-17
ing the dynamic and static pressure changes forming 18
along the medial longitudinal arch (MLA) pedobarog-19
raphy is the most widely used modality [5]. Pes planus 20
can be treated either conservatively or through surgery. 21
Exercise and shoe modification are the most impor-22
tant components of conservative management. Shoe 23
modification; this is achieved by placing a longitudi-24
nal arch support inside the shoe [internal modification] 25
or by the use of the Thomas heel [external modifica-26
tion] [6]. In our study we aimed to determine pre- and 27
post therapy plantar pressure changes and the effects of 28
using internal, external shoe modification and exercise 29
on foot pain, disability and consequently function and 30
quality of life in pes planus patients. 31
2. Methods 32
Sixty patients presenting with pes planus to the 33
Physical Therapy and Rehabilitation Department Out-34
patient Clinics of Trakya University Faculty of Med-35
icine Hospital between February 2011 and July 2011 36
were included in the study. The study was approved by 37
the local ethical committee. 38
Exclusion Criteria: Pes planus patients with the
fol-39
lowing features were excluded from the study; history 40
of foot surgery, those aged under 15 and over 65 years, 41
those with a foot affected by a systemic, inflammatory 42
and or infectious disease, those with a neurologic dis-43
ease affecting gait, pregnancy and those who refused 44
to participate in the study. 45
Inclusion Criteria: The cases with flatfoot were
in-46
cluded in our study. In clinical examination; navicular 47
height were measured. The prominent navicular bone 48
generally represents the highest point of the medial 49
longitudinal arch and a ruler may be used to measure 50
the distance between this point and the supporting sur-51
face [7]. The foot was defined as normal if the nav-52
icular height was normal during standing. Moderately 53
and total loss of the medial longitudinal arch or con-54
vexity of the medial aspect of the foot with the pre-55
cense of talar head on medial plantar side was catego-56
rized as flatfoot. The diagnosis was supported by X-ray 57
imaging in these patients. Having the calcaneal incli-58
nation angle less than 20 degree on the lateral weight- 59 bearing radiography of the foot is considered as the 60 inclusion criteria. Many studies have used the method 61 in our article as a criterion for flatfoot. The patients 62 with bilateral pes planus were included in our study. 63 Pes planus types were bilaterally identical. Measure- 64 ments were performed on both feet. In addition to this, 65 the left-right comparison was not made in the result 66 section. It was investigated that how generally the pa- 67 tients’ complaints were changed. The comparison be- 68 tween the right and left was not also performed in Pe- 69 dobarographic analysis, because it was considered that 70 this comparison was not the main starting point of our 71 research. For this reason, we do not have the data anal- 72 ysis of whether there is a difference between right and 73
left [8–10]. 74
Group Formation: Pes planus patients were cate- 75 gorised into three groups according to the conservative 76 therapy used thus: In the first group internal shoe mod- 77 ification was used, in the second and third groups how- 78 ever external shoe modification and exercise respec- 79 tively were used. We could not randomize our three 80 groups. Our local ethics committee requires the dis- 81 closure of all treatment options to patients in diseases 82 without a definite form of treatment. The rule requires 83 the active participation of the patient when choosing a 84 treatment option in the situation where there is more 85 than one treatment option, and where each of these 86 treatment options is not acquired superiority over each 87 other certainly. In the conservative treatment of pes 88 planus more than one type of treatment is available, 89 and the superiority of these treatments over each is not 90 clearly known. Therefore, we explained all treatment 91 options to our patient and have included them in the 92 stage of treatment decision. After 20 patients included 93 in a group no other patient was recruited. The reason 94 for this decision was to form groups with homogenous 95
number of patients. 96
Assessment: Patients’ demographic features and body 97 mass indices (BMI) were recorded. All foot patholo- 98 gies established after clinical and radiologic assess- 99 ment were recorded. In pes planus clinical assess- 100 ment pes planus types (flexible and rigid) were deter- 101 mined according to thumb dorsiflexion test (toe rais- 102 ing test/jack test) results [11]. In radiologic assessment 103 the presence of epin calcanei and pes planus was deter- 104 mined. Patients were assessed thrice as follows; before 105 the commencement of therapy and at the end of the first 106 and third months of therapy. In these assessments the 107 following were analysed; foot pain index, foot func- 108 tion index, quality of life, patient satisfaction and pe- 109
dobarographic foot pressure. The foot pain index was 110
determined using a questionnaire designed by Garrow 111
et al. [12]. While a low score showed good health, a 112
high score reflected poor health. In order to determine 113
the amount of foot pain and disability the foot func-114
tion index which is a questionnaire designed by Mak 115
et al. [13] was used. The index consists of three sub-116
groups namely; pain, disability and activity limitations. 117
While a low score showed good health, a high score re-118
flected poor health. The foot pain index and foot func-119
tion index were determined at baseline and at the end 120
of the first and third months. The Short Form-36 (SF-121
36) was used to assess the quality of life of the partic-122
ipating patients. Using this form physical and mental 123
health were determined: low and high scores reflected 124
poor and good health respectively [14]. SF-36 was de-125
termined at baseline and at the end of the third month. 126
Patient satisfaction was determined on a scale of 0–5 127
using the Likert Scale in patient groups that used in-128
ternal and external shoe modifications. In this scale 0 129
score meant dissatisfaction and a score of 5 meant high 130
satisfaction. Patient satisfaction was determined during 131
follow-up done at the end of the third month. Pedo-132
barographic assesment was conducted using the Mini-133
Emed pedobarogram device before the commencement 134
of treatment and during follow-up at 3 months. With 135
this system both static and dynamic plantar pressures 136
were measured. The device’s pressure measuring plat-137
form (650× 290 × 25 mm) contains a sensoring area 138
of 360× 180 mm consisting of three sensors in each 139
cm2. The sampling rate was 14 frames/sec, storage 140
range 20 frames, resolution 1 N/cm2, accuracy related 141
to foot 5% [15]. The patients were evaluated bare-142
footed on Mini-Emed system, Pedobarography plat-143
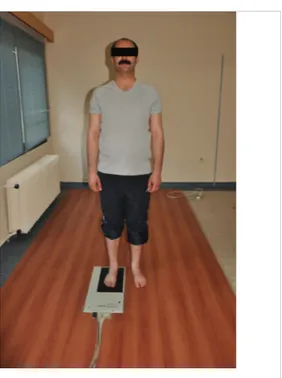
form was in the form of settled into the floor. The first 144
shot of the patient for the static measurement was per-145
formed as in the form of one foot placed on the plat-146
form of pedobarogram and the other foot on the lateral 147
side (Fig. 1). As to dynamic measurement, the subjects 148
were asked to walk continuously along a 30 m long 149
area, for a few minutes before arriving at a wooden 150
walking platform, which was 5 m long. They were in-151
structed to put the foot on the platform during their 152
normal walking rhythm [16] (Fig. 2). 153
The data on the monitor screen was fixed and 154
recorded when the weight on a single foot was ob-155
served to be equal to 50% of the body weight. Anal-156
ysis was performed separately for each foot [17]. In 157
dynamic analysis maximum force (N/cm2), maximum 158
pressure exerted by the toes (N/cm2), maximum pres-159
sure exerted by the inner part of the forefoot (N/cm2), 160
Fig. 1. The static measurement.
Fig. 2. The dynamic measurement.
maximum pressure exerted by middle part of the fore- 161 foot (N/cm2), maximum pressure exerted by the outer 162
part of the forefoot (N/cm2), maximum pressure ex- 163
erted by middle part of the foot (N/cm2), maximum 164 pressure exerted by the heel (N/cm2) and plantar sur- 165
Therapies Used: After diagnosis, all the pes planus
167
patients were educated on the condition and its vari-168
ous modes of therapy. Internal modification, external 169
modification and exercise programs were explained in 170
detail and choice of therapy was left to the patient. In 171
the first group of patients polyform material tougher 172
as per the foot measurements, and transverse arch sup-173
port were used. Because over-pronation not only af-174
fects the medial arch, it will also cause loss of the an-175
terior and lateral longitudinal arches and, if excessive, 176
the transverse arch can become rigid and somewhat 177
flattened [18]. In order to reduce the stress on the sole 178
to the minimum the sole plate surfaces were lined with 179
smooth leatherette material. All insoles were made up 180
by the same technician. The patients in the second 181
group who preferred external shoe modification were 182
required to bring circular tipped shoes that covered the 183
whole foot and were comfortable enough for every-184
day use. The expression’Circular tipped heel shoes” is 185
meant to shoes that Thomas heel will be applied are 186
with large-tipped instead of narrow and pointed. It also 187
desired not to be the type of sandal shoe. We did not 188
tend the effect of a large-tipped shoe on flatfoot, but we 189
tend in general that it should have priority in the choice 190
of healthy shoes. 191
This type of shoe is generally preferred for the 192
foot-health [19]. Shoes that were deemed fit were fit-193
ted with Thomas heel using a material derived from 194
polyurethane and the patients were instructed to use 195
these shoes for all their walking. The third group com-196
prised of those patients who refused to use shoe modi-197
fications. These pes planus patients were managed us-198
ing exercise programs. The exercise program included 199
recommended home-based pes planus routines aimed 200
at strenghtening of the foot inverters and intrinsic mus-201
cles and stretching of the gastrocnemius and evertors. 202
The Exercises for the treatment of flatfoot are: 203
1. Stretching: Stretch your gastrocnemius and soleus 204
muscles. Lean forward until a strong but tolera-205
ble stretch was perceived in the calf muscles. Re-206
peat it 3 times with the knee extended and 3 times 207
with the knee slightly (hold it 30 seconds). 208
2. Toe clawing: Flex your toes as you can (hold 209
it 10 seconds), and extend them fully (hold it 210
10 seconds). 211
3. Rise the medial border of the foot: The foot is 212
slightly inverted (the internal arch is raised), but 213
the sole is not turned upwards. The height of the 214
arch is increased, whilst the toes are still gripping 215
the ground (hold it 10 seconds). 216
4. Make a fist with your foot (hold it 10 seconds). 217
5. Small objects are picked by feet (of different 218
sizes) 219
6. Stand on the lateral sides of the foot (hold it 220
10 seconds). 221
– The exercises was done 3 times daily, as 3 sets in 222 each time by 10 repeats. There was 5 minutes rest 223
period between each set. 224
– The patients were queried about the exercises dur- 225 ing monthly outpatient controls and motivated. 226 At the end of the study the data was reviewed and en- 227 tered into the computer. Statistical analysis was carried 228 out using the SPSS 20.0 statistics program. One Sam- 229 ple Kolmogorov Smirnov Test was used to examine 230 whether the values defined by the measurement fit the 231 normal distribution. The comparison of the data which 232 were found to fit the normal distribution was perfomed 233 using single direction variance analysis and post-hoc 234 Bonferroni Test. The comparison of the data which 235 did not fit the normal distribution was performed using 236 the Kruska Wallis variance analysis and Bonferroni- 237 Corrected Mann Whitney U test. While paired t test 238 and the Wilcoxon two-sample paired test were used 239 when comparing patients within groups, the spearman 240 rho correlation analysis was used in evaluation of vari- 241 able correlations. Pearsonχ2test was used in the anal- 242 ysis of qualitative data. Differences were considered 243 as statistically significant atp < 0.05. Post hoc power 244 analysis was done at the end of study based on Foot 245 pain index baseline values. The power of this study was 246 93.2% with a minimum detectable difference (9.95) 247 between groups, with a common standard deviation 248 (8.33), with a type I error (5%), andn = 20 patients in 249
each group. 250
3. Results 251
Sixty patients with pes planus were included in the 252 study. Each of the three groups – internal modification 253 group, external modification group and exercise group- 254 consisted of 20 patients. The patients’ ages, sex and 255 body mass indices are given in Table 1 below. 256 The types of pes planus were similar in all the study 257 groups (p > 0.05). When the foot pathologies (hallux 258 valgus, epin calcanei, callus) of the patients taking part 259 in the study were compared, the difference among the 260 three groups was found to be statistically insignificant 261 (p > 0.05). However, statistically significant differ- 262 ences were observed when the groups were compared 263 in terms of FPI, FFIPS and FFIDS values recorded at 264 baseline and during follow up (p < 0.05), (Table 2). 265
Table 1
Patients’ demographic features
Variables Internal modification group (n = 20) External modification group (n = 20) Exercise group (n = 20) P Age Mean± SD 50.9± 10.4 48.7± 8.22† 52.3± 8.48∗ > 0.05 Sex Female (n, %) Male (n, %) 15, %75 5, %25 15, %75 5, %25 15, %75 15, %25 > 0.05 BMI Mean± SD 34.03± 6.48 34.46± 6.71 33.50± 7.28† > 0.05
BMI: Body mass index, SD: Standard deviation,∗:p < 0.05.†: When compared with the internal modification groupp < 0.05. Table 2
Comparison of study groups in terms of foot pain index,foot function index pain scale and foot function index disability scale at baseline and at the end of the first and third months
Evaluated parameters Internal modification External modification Exercise P
group (n = 20) group (n = 20) group (n = 20)
FPI (Mean± SD) Baseline 41.30± 8.26∗ 30.35± 8.33†,∗ 23.25± 7.01 0.001
1. Month 37.40± 8.80∗ 27.50± 6.97†,∗ 22.85± 6.72 0.001
3. Month 32.05± 6.46∗ 26.65± 6.36†,∗ 22.00± 6.12 0.001
FFIPS (Mean± SD) Baseline 46.70± 12.28∗ 26.35± 15.78†,∗ 12.60± 14.15 0.001
1. Month 38.35± 9.77∗ 22.10± 13.31†,∗ 11.35± 12.33 0.001
3. Month 32.85± 9.39∗ 20.05± 6.36†,∗ 10.35± 10.92 0.001
FFIDS (Mean± SD) Baseline 67.40± 18.45∗ 27.50± 23.70† 13.50± 20.69 0.001
1. Month 59.05± 17.27∗ 25.80± 21.67† 13.00± 19.33 0.001
3. Month 53.10± 18.33∗ 25.25± 20.81† 12.60± 18.94 0.001
FPI: Foot pain index. FFIPS: Foot functional index pain scala. FFIDS: Foot functional index disability scala. Kruskal-wallis test,∗:p < 0.016 When compared with the exercise group,†:p < 0.016 When compared with the internal modification group.
Table 3
Comparison of patient satisfaction between study groups
Degree of Internal External P
satisfaction modification modification group (n = 20) group (n = 20) Little (n, %) 2, %10 2, %10 0.797 Some (n, %) 2, %10 3, %15 Medium (n, %) 4, %20 5, %25 Good (n, %) 7, %35 8, %40 Very good (n, %) 5, %25 2, %10
Pearson chi-square test.
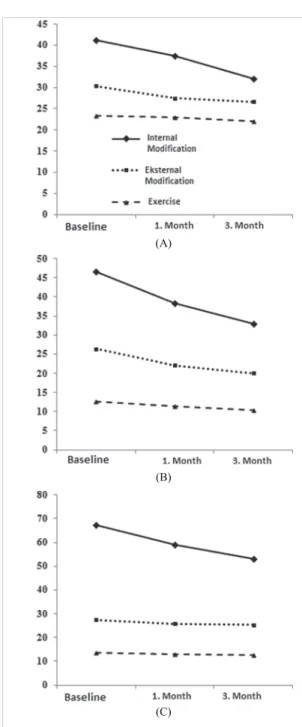
Within each group FPI, FFIPS and FFIDS values 266
recorded at baseline and at the end of the first and third 267
months respectively were compared. In each group a 268
statistically significant difference was observed in all 269
parametres recorded at baseline and during follow up 270
(p = 0.001). There was no significant difference ob-271
served between the evaluations done at 1 month and at 272
3 months in any of the groups (p > 0.005). Changes 273
in the FPI, FFIPS and FFIDS values were mostly ob-274
served in the internal modification group (Bonferroni 275
corrected Mann WhitneyU test), (p < 0.016) (Fig. 3). 276
When changes in the quality of life were analysed; 277
a statistically significant difference was observed only 278
in the internal modification group (SF36-PCS baseline 279 28.05± 5.59, 3 months 32.65 ± 5.14 and p = 0.001). 280 There was no significant difference observed in the 281 groups treated with external modification and exercise 282 in terms of quality of life (p > 0.05). No statistically 283 significant difference was observed between patients 284 treated with internal and external shoe modification in 285 terms of patient satisfaction (p > 0.05), (Table 3). 286 Taking all the 60 patients into account, the pres- 287 ence of any cross-sectional correlation between clini- 288 cal parametres and pedobarographic values was inves- 289 tigated. As a result of this investigation, all patients’ 290 clinical and pedobarographic measurements (static and 291 dynamic) were analysed at baseline and at 3 months 292 and consequently most parametres were found to be 293 correlated (Table 4). FPI, FFIPS and FFIDS values 294 were found to be higher in patients with higher sole 295 (plantar) pressure but SF36-PCS was found to be 296 lower. Static and dynamic pedobarographic measure- 297 ments of both feet (left and right) taken at baseline and 298 at the end of 3 months were compared with each other. 299 Although no significant changes were observed in any 300 of the measured parametres, changes in total plantar 301 pressure were shown in all study groups (p < 0.05). 302
(A)
(B)
(C)
Fig. 3. Changes in terms of foot pain indices (A), foot function index pain scale (B) and foot function index disability scale (C) at baseline and at the end of months 1 and 3.
The extent of this change was similar in all the study 303
groups (p > 0.05). 304
4. Discussion 305
Adult pes planus is usually a progression of pae-306
diatric foot problems namely the condition associated 307
with partial or total absence of the medial longitudinal 308 arch [17]. Studies on the conservative therapy of pes 309 planus are unavailable in literature. However most of 310 these studies are mostly on orthesis and exercise pro- 311
grams. 312
In our study we compared the efficacy of the var- 313 ious modes of orthesis namely; internal modification, 314 external modification and conservative therapy (i.e. ex- 315 ercise). The number of publications definitely report- 316 ing the effectiveness of conservative treatment on flat- 317 foot is limited. At the same time, the number of pub- 318 lications comparing the conservative treatments with 319 each other is also limited. Additionally, the majority 320 of flatfoot publications were reported at pediatric age 321 group. There are few reports in adults. Overweight and 322 high body mass index are accepted as etiologic factors 323 in the development of pes planus in both children and 324 adults [20]. However, studies are available that report 325 the contrary [21]. Although limited, there is evidence 326 that pes planus is familial and is seen more frequently 327 in women, blacks and in African countries [22]. 328 In our study 45 women (75%) and 15 men (25%) 329 were included. According to our figures pes planus is 330 thrice as frequent in women as it is in men. This is 331 coherent with other reports in literature. While inter- 332 nal and external modification groups were in first de- 333 gree obesity category, the exercise group was in the 334
pre-obese (overweight category). 335
When assessing the types of pes planus, only two 336 cases with rigid pes planus were discovered among 337 those in the internal modification group. Considering 338 the ages of the patients, the baseline assessment of in- 339 ternal modification group was found to be more ad- 340 vanced age than the other two groups. However, our re- 341 sults were showed greater improvement in several clin- 342 ical parameters in this group. Although this situation is 343 surprise for us, it was thought to be a sign of progres- 344 sion of the process in the young age groups. The ta- 345 ble has been created for static and dynamic pedobaro- 346
graphic measurement values. 347
Generally, it was reported that internal modification 348 achieved by changing the inner part of the shoe was not 349 well tolerated due to the reduction of the internal shoe 350 volume. In our clinical experience, we too discovered 351 that patients were uncomfortable with the need to in- 352 crease their shoe size necessary for the shoe modifica- 353 tion. In addition, patients were uncomfortable with the 354 turning and poor shape of the smooth material (silicon) 355 used for internal shoe modification and therefore found 356 the shoes difficult to use [6]. In order to overcome this 357 problem, we used a material harder than silicon that 358
Table 4
The relationship between pedobarographic analysis and clinical parametres at baseline and 3 months
Parameter FPI FFIPS FFIDS SF-PCS
Baseline 3. Month Baseline 3. Month Baseline 3. Month Baseline 3. Month
P p p p P P p P
Static left – the maximum pressure of the front foot
0.017* 0.010* 0.026* 0.001* 0.007* 0.001* 0.024* 0.003*
Static rigth – the maximum pressure of the front foot
0.050 0.028* 0.005* 0.001* 0.010* 0.001* 0.020* 0.007*
Static left – the maximum pressure in the rear foot
0.014* 0.020* 0.012* 0.006* 0.021* 0.008* 0.072 0.014*
Static on the right – the maximum pressure of the rear foot
0.066 0.068 0.024* 0.003* 0.019* 0.001* 0.036* 0.017*
Static left – maximum plantar pressure
0.845 0.746 0.002* 0.631 0.037* 0.654 0.852 0.638
Static on the right – the maximum plantar pressure
0.573 0.633 0.016* 0.392 0.003* 0.059 0.040* 0,861
Dynamic left – mid-foot maximum pressure
0.090 0.035* 0.001* 0.005* 0.094 0.028* 0.030* 0.003*
Dynamic right – mid-foot maximum pressure
0.001* 0.001* 0.047* 0.001* 0.001* 0.001* 0.001* 0.001*
FPI: Foot pain index. FFIPS: Foot functional index pain scala. FFIDS: Foot functional index disability scala. SF 36-PCS: Short form 36 physical
component summary. Spearsman’s rho correlationanalysis.∗:p < 0.05.
was also tailored according to the patients’ feet in the 359
group where internal modification was used [24]. 360
Interestingly, no significant difference was observed 361
in terms of patient satisfaction between the external 362
modification and internal modification groups in our 363
study. Due to the fact that the choice of therapy was left 364
to the patient, differences in basal values were present 365
between the different patient groups. With an aim to 366
get rid of this counfounding factor and to determine 367
the modality of therapy that yielded the most clinical 368
changes, all post-therapy changes in the various groups 369
were calculated and compared with each other. 370
In conclusion, the most changes in clinical parame-371
tres were observed in the internal modification group. 372
The external modification group changed in a manner 373
not different from the exercise group only in terms of 374
the foot function index. However, all the other parame-375
tres were better than those of the exercise group. This 376
means that in terms of the clinical improvement in-377
ternal modification was superior to external modifica-378
tion which was superior to exercise programs. When 379
we take the baseline assessments into account; inter-380
nal modification group consisted mostly of elderly pa-381
tients with the worst clinical conditions. It is however 382
interesting that the most clinical improvement was ob-383
served in this group of patients. 384
In our study, the other joints (knee and hip) were not 385
investigated. Studies on the effects of shoe modifica-386
tion on the other joints are available in literature [24]. 387
Foot pain is a condition correlated with functional 388
limitation and disability. According to an earlier study, 389 chronic and severe foot pain is a cause of difficulty in 390 walking and affects the daily activities in women [25]. 391 In one community-based study, pain was shown to be 392 a cause of limitation in the daily activities [26]. How- 393 ever, there is no study available showing the relation- 394 ship between disability and structural foot defect in the 395 absence of pain. In a study by Woodburn et al. [27] 396 50 patients with rheumatoid arthritis-related foot pain 397 were recruited. These patients were fitted with orthe- 398 ses especially designed by podiatrists according to the 399 specifications of the patients. 48 patients presenting to 400 the outpatient clinic were also included in the study as 401 a control group. The patients used ortheses for a pe- 402 riod of 30 months. In the group of patients fitted with 403 ortheses a rapid improvement in the FPI scores was 404 recorded. This improvement peaked in 12 months. A 405 decrease was observed in the FPI pain and disability 406 scores. In a study by Jung et al. [28], pes planus pa- 407 tients were grouped into two. While in the first group 408 of patients foot ortheses were used, both orthesis and 409 an exercise program were used in the second group. It 410 was observed that the combination of orthesis and ex- 411 ercise provided better results than the sole use of orthe- 412
sis. 413
SF36-PCS changes in the internal modification group 414 were more significant compared to the other groups. 415 This is thought to show parallelism with the change in 416 pain level. In a study by Kusumoto et al. [29] the ef- 417 fects of shoes and tailor-made sole plate on the qual- 418
ity of life in elderly women was investigated. A sig-419
nificant improvement in the quality of life (according 420
to physical and mental scores) was observed in the pa-421
tients using sole palates. Pressure changes emanating 422
from biomechanical imbalance can lead to foot pain 423
and disability. Very few studies in literature report on 424
the relationship between sole pressure changes and the 425
aforementioned symptoms [30]. 426
In our study, we used pedobarographic equipment 427
to analyse clinical and pedobarographic values in the 428
same patient group. However, in both children and 429
adults alike, normal pedobarographic values were dif-430
ficult to determine [31]. The absence of normal values 431
in pedobarographic analysis means that numeral val-432
ues of the results of such analysis are of no significance 433
when solely analysed. In pes planus patients the in-434
creased foot pressure reflects differently in pedobarog-435
raphy when different measurement areas are used. In 436
our study, we investigated the presence of any rela-437
tionship between clinical assessments and pedobaro-438
graphic analysis. Interestingly, clinical results were 439
correlated with the pressure increase (especially mid-440
foot) in most of the areas measured using pedobarogra-441
phy at baseline and at the end of the third month. Dur-442
ing follow up, pedobarographic assessments did not 443
show any changes significant enough to reflect par-444
allelism with the clinical improvement. However, the 445
length of time necessary for the formation of changes 446
in the pedobarographic analysis is unknown. In most 447
of the studies where pedobarographic changes were 448
observed, follow up lasted for at least one year [32]. 449
Therefore, while 3 months of follow up in our study are 450
enough for observation of clinical improvement, this 451
period may not be long enough for the formation of ob-452
servable pedobarographic changes. We are of the view 453
that a long period of follow-up is necessary in these 454
kind of studies. Viewed cross-sectionally, clinical and 455
pedobarographic assessments were found to be corre-456
lated with each other. However, we are of the opin-457
ion that clinical and pedobarographic changes did not 458
occur at the same time during follow up. During the 459
last assessment carried out in our study radiographic 460
analysis was not repeated and therefore the effects of 461
our therapy methods on radiographic changes were not 462
analysed. In a study where radiographic measurements 463
were used, pes planus patients using tailored-made sole 464
plates were investigated. In these patients radiographic 465
improvements on the foot arch were shown [33]. 466
5. Conclusion 467
It was found that internal modification yielded more 468
clinical improvement than external shoe modification 469 or solely executed exercise programs. Cross-sectional 470 pes planus clinical and pedobarographic analysis are 471
correlated. 472
Conflict of interest 473
Financial disclosure statements have been obtained, 474 and no conflicts of interest have been reported by the 475 authors or by any individuals in control of the content 476
of this article. 477
References 478
[1] Singh A, Kumar A, Kumar S, Srivastava RN and Gupta OP. 479 Analysis of ankle alignment abnormalities as a risk factor for 480 pediatric flexible flat foot. Internet Journal of Medical Update 481
2010; 5: 25–28. 482
[2] Igbigbi PS, Msamati BC and Shariff MB. Arch index as a 483 predictor of pes planus: A comparative study of indigenous 484 kenyans and tanzanians. Journal of the American Podiatric 485 Medical Association 2005; 95: 273–276. 486 [3] Mosca VS. Flexible flatfoot in children and adolescents. Jour- 487 nal of Children’s Orthopaedics 2010; 4: 107–121. 488 [4] Chen CH, Huang MH, Chen TW, Weng MC, Lee CL and 489 Wang GJ. The correlation between selected measurements 490 from footprint and radiograph of flatfoot. Archives of physical 491 medicine and Rehabilitation 2006; 87: 235–240. 492 [5] Menz HB. Alternative techniques for the clinical assessment 493 of foot pronation. Journal of the American Podiatric Medical 494
Association 1998; 88: 119–129. 495
[6] DeLisa JA. Rehabilitation Medicine Principles and Practice. 496 in: 2nd, DeLisa JA. Philadelphia: Lea and Febiger 1993: 496– 497
499. 498
[7] Razeghi M and Batt M. Foot type classification: A critical re- 499 view of current methods. Gait and Posture. 2002; 15(3): 282. 500 [8] Sinha S, Song HR, Kim HJ, Park MS, Yoon YC and Song 501 SH. Medial arch orthosis for paediatric flatfoot. Journal of 502 Orthopaedic Surgery 2013; 21: 37–43. 503 [9] Cilli F, Pehlivan O, Keklikci K, Mahirogulları M and Kuskucu 504 M. Prevalence of flatfoot in turkish male adolescents. Eklem 505 Hastalık Cerrahisi 2009; 20: 90–92. 506 [10] Radl R, Fuhrmann G, Maafe M and Krifter RM. Hinfoot val- 507 gus. Diagnosis and therapy of flatfoot. Der Orthopade 2012; 508
41: 313–324. 509
[11] Jack EA. Naviculo-cuneiform fusion in the treatment of flat- 510 foot. The Journal of Bone and Joint Surgery British Volume 511
1953; 35(1): 75. 512
[12] Garrow AP, Papageorgiou AC, Silman AJ, Thomas E, Jayson 513 MI and Macfarlane GJ. Development and validation of a 514 qeustionnaire to assess disabling foot pain. Pain 2000; 85: 515
107–113. 516
[13] Budiman-Mak E, Conrad KJ and Roach KE. The foot func- 517 tion index; a measure of foot pain and disability. Journal of 518 Clinical Epidemiology 1991; 44: 561–570. 519 [14] Brazier JE, Harper R, Jones NM, O’Cathain A, Thomas KJ, 520 Usherwood T and Westlake L. Validating the SF-36 health 521 survey questionnaire: New outcome measure for primary care. 522 British Medical Journal 1992; 305(18): 160–164. 523
[15] Mini-Emed System. Operating Manual. Munich: Novel; 524
1991. 525
[16] Hennig EM and Rosenbaum D. Plantar pressure distribution 526
patterns of young school children in comparison adults. Foot 527
Ankle 1994; 15, 35–40. 528
[17] Braddom LR. Pysical medicine and rehabilitation. in: Gait 529
analysis. 2nd, Braddom LR. Philedelphia: Saunders Company 530
2000: 94–99. 531
[18] Carreiro JE. Foot and Ankle. in: Pediatric Manual Medicine: 532
An Osteopathic Approach. Carreiro JE, editor. China: Else-533
vier; 2009. pp. 329–363. 534
[19] Goud A, Khurana B, Chiodo C and Weissman BN. Women’s 535
musculoskeletal foot conditions exacerbated by shoe wear: 536
An imaging perspective. American Journal of Orthopedics 537
2011; 40: 183–191. 538
[20] Kim HW and Weinstein SL. Flatfoot in children: Differential 539
diagnosis and management. Current Orthopaedics 2000; 14: 540
441–447. 541
[21] Otsuka R, Yatsuya H, Miura Y, Murata C, Tamakoshi K, 542
Oshiro K, Nishio N, Ishikawa M, Zhang HM, Shiozawa M, 543
Kobayashi A, Ito M, Hori Y, Kondo T and Toyoshima H. As-544
sociation of flatfoot with pain, fatigue and obesity in Japanese 545
over sixties. (Nihon Koshu Eisei Zasshi) Japanese Journal of 546
Public Health 2003; 50: 988–998. 547
[22] Igbigbi PS and Msamati BC. The footprint ratio as a predictor 548
of pes planus: A study of indigenous Malawians. The Journal 549
of foot and ankle surgery. Official publication of the American 550
College of Foot and Ankle Surgeons 2002; 4: 394–397. 551
[23] Healy A, Dunning DN and Chockalingam N. Effect of insole 552
material on lower limb kinematics and plantar pressure dur-553
ing treadmill walking. Prosthetics and Orthotics International 554
2011; 2: 93–110. 555
[24] Chen YC, Lou SZ, Huang CY and Su FC. Effects of foot or-556
thoses on gait patterns of flat feet patients. Clinical Biome-557
chanics (Bristol, Avon) 2010; 25: 265–270. 558
[25] Leveille SG, Guralnik JM, Ferrucci L, Hirsch R, Simonsick E 559
and Hochberg MC. Foot pain and disability in older women. 560
American Journal of Epidemiology 1998; 148: 657–665. 561 [26] Benvenuti F, Ferrucci L, Guralnik JM, Gangemi S and Baroni 562 A. Foot pain and disability in older persons: An epidemiologic 563 survey. Journal of the American Geriatrics Society 1995; 43: 564
479–484. 565
[27] Woodburn J, Barker S and Helliwell PS. A randomized con- 566 trolled trial of foot orthoses in rheumatoid arthritis. The Jour- 567 nal of Rheumatology 2002; 29: 1377–1383. 568 [28] Jung DY, Koh EK and Kwon OY. Effect of foot orthoses and 569 short foot exersize on the cross sectional area of the abduc- 570 tor hallucis muscle in subjects with pes planus: A randomized 571 controlled trial. Journal of Back and Musculoskeletal Reha- 572
bilitation 2011; 24: 225–231. 573
[29] Kusumoto A, Suzuki T, Yoshida H and Kwon J. Interven- 574 tion study to improve quality of life and health problems of 575 community-living elderly women in Japan by shoe fitting and 576 custom-made insoles. Gerontology 2007; 53(6): 348–356. 577 [30] Oeffinger DJ, Pectol RW and Tylkowski CM. Foot pressure 578 and radiographic outcome measure of lateral column length- 579 ening for pes planovalgus deformity. Gait Posture 2000; 12: 580
189–195. 581
[31] Hennig E, Staats A and Rosenbaum D. Plantar pressure distri- 582 bution patterns of young school children in comparison with 583 adults. Foot and ankle international. American Orthopaedic 584 Foot and Ankle Society and Swiss Foot and Ankle Society 585
1994; 15: 35–40. 586
[32] Bus SA, Valk GD, Van Daursen RW, Armstrong DG, Car- 587 avaggi C, Hlavácek P, Bakker K and Cavanagh PR. The effec- 588 tiveness of footwear and offloading interventions to prevent 589 and heal foot ulcers and reduce plantar pressure in diabetes: 590 A systematic revıew. Diabetes/Metabolism Research and Re- 591
views 2008; 24: 162–180. 592
[33] Kuhn DR. Radiographic evaluation of weight-bearing or- 593 thotics and their effect on flexible pes planus. Journal of Ma- 594 nipulative and Physiological Therapeutics 1999; 22: 221– 595