ÇANKAYA UNIVERSITY
THE GRADUATE SCHOOL OF SOCIAL SCIENCES ECONOMICS AND ADMINISTRATION SCIENCES
MASTERS IN BUSINESS ADMINISTRATION (MBA)
AN EXPLORATORY STUDY OF DIGITAL TECHNOLOGY APPLICATIONS USED IN RESTAURANTS AND CAFES IN ANKARA
MISAGH HAJI AMIRI
iv
ABSTRACT
An Exploratory Study of Digital Technology Applications Used in Restaurants and Cafes in Ankara
Misagh, HAJI AMIRI
M.B.A, Master of Business Administration Supervisor: Prof. Dr. Alaeddin TİLEYLİOĞLU Co-Supervisor: Assoc. Prof. Dr. İrge ŞENER
June 2019, 117 Pages
Over the past decades, digital technologies have invaded our daily life from all aspects. Such a digital revolution and features that it brings to the picture are changing the way people and business work together. Foodservice industry and specifically restaurant industry is not an exception from this phenomena. Numerous digital solutions for restaurants and cafes have been introduced and more of them are yet to come. Therefore, applying proper technological solution can be beneficial both for the business and for customers. Accordingly, assessing the current situation and development process of the technological solution into the foodservice industry is essential for countries that the foodservice industry plays an important role in their economy. Within this frame, this study aims to provide an insight into the current situation and future of technological solutions among restaurants and cafes in Ankara. This issue is studied from three different perspectives. First, in-depth interviews were conducted with managers of two businesses that create and provide technological solutions for restaurants and cafes in Ankara. Second, 18 structured interviews were conducted with restaurant owners and managers, in order to understand the existing mindset of Turkish decision makers on the topic of applying technological solutions for foodservice businesses. Finally, the survey data was collected from 261 customers in different locations of Ankara. The survey asked customers’ opinion and interest level toward certain types of technologies. It was observed that combination of
v
technological solutions and traditional tools are being used in restaurants and cafes in Ankara. In addition, intention for investment in technology was high among restaurateurs. However, high prices of technological solutions and lack of knowledge considered as biggest barriers for adaptation of technology into the sector. Moreover, Self-Service Technologies (SST) such as tablet and tabletop menu was concerned to be as favorable among both for customers and restaurateurs.
vii ÖZET
Ankara’da Restoranlarda ve Kafelerde Kullanılan Dijital Teknoloji Uygulamaları hakkında Keşfedici Bir Çalışma
Misagh, HAJI AMIRI
İşletme Yönetimi Yüksek Lisansı (M.B.A) Danışman: Prof. Dr. Alaeddin TİLEYLİOĞLU
Eş-Danışman: Doç. Dr. İrge ŞENER Haziran 2019, 117 Sayfa
Geçen on yıllarda, dijital teknolojiler günlük hayatımızın her alanına yayıldı. Bu tür bir dijital dönüşüm ve ortaya çıkardığı özellikler, insanların ve işletmelerin birlikte çalışma şeklini değiştirmektedir. Yiyecek hizmeti sektörü ve özellikle restoran sektörü, bunun için bir istisna değildir. Restoranlar ve kafeler için çok sayıda dijital çözümler sunulmuştur ve bu çözümlerin birçoğu da henüz uygulamaya geçmemiştir. Bundan dolayı, doğru teknolojik çözümün uygulanması hem işletme hem de müşteriler için faydalı olabilir. Bu doğrultuda, yiyecek hizmeti sektörü için teknolojik çözümün mevcut durumunun ve gelişim sürecinin değerlendirilmesi, ekonomilerinde yiyecek hizmeti sektörünün önemli rol oynadığı ülkeler için zaruridir. Bu çerçevede, bu çalışmada, Ankara’daki restoranlar ve kafelerde teknolojik çözümlerin mevcut durumu ve geleceği hakkında bir anlayış sağlanması amaçlanmıştır.Bu konu üç farklı bakış açısıyla incelenmiştir. İlk olarak, Ankara'da restoranlar ve kafeler için teknolojik çözümler oluşturan ve sağlayan iki işletmenin yöneticisi ile derinlemesine mülakatlar yapılmıştır. İkinci olarak, Türk karar vericilerin yiyecek hizmeti işletmelerinde teknolojik çözümleri uygulama konusundaki mevcut zihniyetini anlamak için restoran yöneticileri ve sahipleri ile 18 yapılandırılmış mülakat gerçekleştirilmiştir. Son olarak, Ankara'nın farklı bölgelerindeki 261 müşteriden anket verileri toplanmıştır. Ankette, müşterilerin belirli teknoloji türlerine yönelik görüşleri ve ilgi düzeylerini sorulmuştur. Ankara'daki restoran ve kafelerde, teknolojik çözümler ile geleneksel araçların
viii
bileşiminin kullanıldığı gözlemlenmiştir. İlaveten, restoran sahiplerinin teknoloji yatırımı yapma niyetlerinin yüksek olduğu belirlenmiştir. Ancak, teknolojik çözümlerin yüksek maliyetleri ve bilgi eksikliği, sektörde teknoloji adaptasyonu önünde en önemli engeller olarak değerlendirilmiştir. Bunun yanı sıra, tablet ve masa üstü menü gibi self-servis teknolojilerin (SST) hem müşteriler hem de restoran sahipleri için olumlu olarak dikkate alındığı ortaya çıkmıştır.
ix
ACKNOWLEDGMENTS
First and above all, I thank God for everything especially giving me a loving family that is willingly sacrifice what they have for my advancement and comfort. Without them, I would not be where I am today.
It is with immense gratitude and profound thanks that I acknowledge the support of my advisor Prof. Dr. Alaeddin Tileylioğlu through the course of this research. His wise, insightful, priceless guidance made difficulties of dissertation much easier for me. He consistently allowed this paper to be my own work, but steered me in the right direction whenever needed. Next, I would like to show my deepest respect and gratitude to Assoc. Prof. Dr. İrge Şener for her patience and efforts in each and every step. The door to Dr. Şener office was always open whenever I ran into a trouble spot or had a question about my research or writing. She always kept me inspired and motivated during the course of this research.
I would like to thank also Mr. A. Zobi and Mr. T. Yıldırım for their amazing and unbelievable help. Without their passionate participation and input, the validation survey could not have been successfully conducted. In addition, I am really thankful to my friend Mr. S. Öztürk and his lovely family for providing me a peaceful environment during my study.
Lastly, I would like to thank again my beloved father, mother, brother and his wonderful wife. This accomplishment would not have been possible without them.
x
DEDICATION
This thesis is dedicated to my parents, my teachers and anyone who had a part in my upbringing and education.
xi
TABLE OF CONTEN
STATEMENT OF NON-PLAGIARIS ... III ABSTRACT ... IV ÖZET... VII ACKNOWLEDGMENTS ... IX DEDICATION ... X TABLE OF CONTENTS ... XI LIST OF TABLES ... XIV LIST OF FIGURES ... XV
LIST OF ABBREVIATIONS ... 1
CHAPTER ONE INTRODUCTION ... 1
1.1 Problem Statement ... 3
1.2 Purpose of the Study ... 4
CHAPTER TWO ... 5
LITERATURE REVIEW... 5
2.1 Industrial Revolutions, Technology and Economy: ... 5
2.1.1 First Industrial Revolution ... 7
2.1.2 Second Industrial Revolution ... 9
2.1.3 Third Industrial Revolution ... 9
2.1.4 Fourth Industrial Revolution ... 10
2.1.4.1 Characteristics of Industry 4.0 ... 11
xii
2.2.1 The Economic Impact of the Food Service Industry on Turkish Economy .. 14
2.2.1 Food Eaten Away from Home in Turkey ... 16
2.3 Technology for the Restaurants Industry ... 18
2.3.1 Benefits of Technology for Customers and Guest Experience ... 21
2.3.2 Effect of Technology on Dining Experience ... 22
2.4 Restaurant Technology Applications/Systems ... 23
2.4.1 Robots, Artificial Intelligence, and Service Automation ... 24
2.4.1.1 Benefit and Shortcomings of RAISA ... 26
2.4.1.2 Examples of Chef Robots... 27
2.4.1.3 Examples of Waiter Robots ... 30
2.4.2 Back of the House (BOH) ... 34
2.4.2.1 Kitchen Display System ... 35
2.4.2.1 Smart Oil Management System ... 36
2.4.2.1 Customer Relationship Management (CRM) Systems ... 37
2.4.3 Front of the House (FOH) ... 38
2.4.3.1 Self-Service Technology (SST) ... 39
2.4.3.1.1 Digital Display Menu ... 40
2.4.3.1.2 Tabletop Technology ... 41
2.4.3.1.3 Self-Service Kiosks ... 42
2.5 Previous Studies about Technology Adaptation among Restaurateurs and Customers ... 44 CHAPTER THREE ... 50 METHODOLOGY ... 50 3.1 Research Design ... 50 3.2 Research Strategy ... 51 3.3 Data Collection... 52 3.4 Analysis of Data ... 54 CHAPTER FOUR ... 55 RESEARCH FINDINGS ... 55
4.1 In-depth Interviews with Technology Providers ... 55
4.1.1 Companies ... 56
4.1.2 Technological Solutions and Their Characteristics in Turkey ... 57
4.1.3 Challenges and Barriers for Adaptation of Technological Solutions for the Foodservice Industry in Turkey ... 60
4.1.4 Future of Technology for the Foodservice Industry in Turkey ... 62
xiii
4.2 Structured Interviews with Restaurateurs and Managers ... 63
4.2.1 Types of Interviewed Businesses ... 64
4.2.2 Level of Technological Use ... 65
4.2.3 Reasons for Better Tools and Upgrade ... 66
4.2.4 Important Characteristics of Technology for Restaurants and Cafes... 67
4.2.5 Interesting Technological Solutions for Restaurants and Cafes ... 68
4.2.6 Desired Topics for Upgrades on POS Terminals ... 70
4.2.7 Preparation for Upgrade ... 71
4.2.8 Challenges and Barriers for Technology Adaptation ... 72
4.2.9 Digital Marketing and Social Media ... 74
4.2.10 Attitude toward Electronic Menu, Tabletop Technology and, Robots ... 76
4.2.11 Artificial Intelligence and Robots ... 79
4.3 Quantitative Survey with Customers ... 79
4.3.1 Demographic Characteristics of Participants ... 80
4.3.2 Habit of Eating Outside ... 81
4.3.3 Most Favorite Places for Participants ... 83
4.3.4 Interests Level of Customers toward Different Types of Technologies ... 84
4.3.4.1 Waiter Robot ... 84 4.3.4.2 Chef Robots ... 85 4.3.4.3 Self-Service Kiosk ... 86 4.3.4.4 Tablet-menu ... 88 4.3.4.5 Tabletop technology ... 89 4.3.4.6 Mobile application ... 90 4.3.4.7 Summary ... 91 CHAPTER FIVE ... 92
CONCLUSION AND DISCUSSION ... 92
5.1 Limitations and Suggestions ... 96
REFERENCES ... 97
APPENDIX A: STRUCTURED INTERVIEWS WITH RESTAURATEURS AND MANAGERS ... 108
xiv
LISTOFTABLES
TABLE 1. KONDRATIEV CYCLES WITH THE MAJOR INVENTION OF THAT PERIOD ... 6
TABLE 2. DISTRIBUTION OF CONSUMPTION EXPENDITURES BY QUINTILES ORDERED BY INCOME, 2016, 2017 (SOURCE: TURKISH STATISTICAL INSTITUTE)... 16
TABLE 3. HISTORY OF FOOD SERVICE TECHNOLOGY ... 18
TABLE 4. DESCRIPTIVE ANALYSIS OF CONSUMER BEHAVIOR VARIABLES IN RESTAURANTS ... 44
TABLE 5. DESCRIPTIVE ANALYSIS OF RESTAURANT MANAGERS’ ATTITUDE TO APPLYING ICT IN THEIR RESTAURANTS IN THE FUTURE ... 45
TABLE 6. RESTAURANT TECHNOLOGIES TESTED SERVICE ... 48
TABLE 7. COMPARISON OF BOTH INTERVIEWED COMPANIES ... 63
TABLE 8. TYPES OF USED TOOLS IN INTERVIEWED LOCATIONS ... 65
TABLE 9. MAIN REASONS FOR UPGRADING EXISTING SYSTEMS ... 66
TABLE 10. IMPORTANT CHARACTERISTICS OF TECHNOLOGY FROM RESPONDENT PERSPECTIVES ... 67
TABLE 11. INTERESTING BUSINESS PROCESSES FOR TECHNOLOGY ... 68
TABLE 12. INTERESTING TOPIC FOR POS UPGRADES ... 70
TABLE 13. EXISTING BARRIERS FOR TECHNOLOGY IMPLEMENTATION... 73
TABLE 14. PREFERRED SOCIAL MEDIA PLATFORMS... 76
TABLE 15. AGE GROUPS OF THE PARTICIPANT FOR CUSTOMER SURVEY ... 81
TABLE 16. CUSTOMERS' FREQUENCY OF VISITING RESTAURANTS AND CAFES ... 82
TABLE 17. PREFERRED PLACES FOR EATING OUTSIDE AMONG RESPONDENTS ... 83
xv
LIST OF FIGURES
FIGURE 1. KONDRATIEV WAVES FROM PAST TILL PRESENT ... 6
FIGURE 2. STAGES OF KONDRATIEV WAVES ... 7
FIGURE 3. AVERAGE GLOBAL GDP SINCE 10,000 BC ... 8
FIGURE 4. THE FOUR CHARACTERISTICS OF INDUSTRY 4.0 ... 12
FIGURE 5. PERCENTAGE NUMBER OF ENTERPRISES, EMPLOYMENT, AND TURNOVER BY SECTORS IN 2015 (SOURCE: TURKISH STATISTICAL INSTITUTE) ... 14
FIGURE 6. DISTRIBUTION OF TURKISH HOUSEHOLD CONSUMPTION EXPENDITURE IN 2016 AND 2017 ... 15
FIGURE 7 . HABIT OF EATING OUTSIDE AND TYPES OF RESTAURANT THAT TURKISH PEOPLE GO WHEN THEY EAT OUT (SOURCE: KONDA, RESEARCH & CONSULTING COMPANY) ... 17
FIGURE 8. “THE SOUND OF THE SEA”, THE FAMOUS DISH IN THE FAT DUCK RESTAURANT ... 20
FIGURE 9. CHEWING JOCKEY, AN AUGMENTED REALITY DEVICE ... 21
FIGURE 10. THE TECHNICAL POTENTIAL FOR AUTOMATION ACROSS SECTORS VARIES DEPENDING ON THE MIX OF ACTIVITY TYPES (SORUCE: PRICEWATERHOUSECOOPER, 2018) ... 25
FIGURE 11. THE WORLD'S FIRST ROBOTIC KITCHEN CREATED BY MOLEY COMPANY .. 28
FIGURE 12. SPYCE, A ROBOTIC RESTAURANT IN BOSTON, USA ... 28
FIGURE 13. FLIPPY, THE WORLD FIRST AUTONOMOUS ROBOTIC KITCHEN ASSISTANCE BY MISO ROBOTICS ... 29
FIGURE 14. BAGGERS RESTAURANT IN NÜRNBERG, GERMANY ... 30
FIGURE 15. FU-RO THE WAITER ROBOT (LEFT) & HAJIME RESTAURANT IN BANGKOK, THAILAND (RIGHT) ... 32
FIGURE 16. ADA, THE TURKISH WAITER ROBOT IN CAFE CADDE MERAM IN KONYA, TURKEY ... 33
xvi
FIGURE 18. TYPICAL SMART OIL MANAGEMENT SYSTEM ... 37
FIGURE 19. VARIOUS VERSIONS OF E-MENU ... 40
FIGURE 20. HOLOGRAPHIC TYPES OF TABLETOP TECHNOLOGY ... 42
FIGURE 21. TABLETOP TECHNOLOGY AT INAMO RESTAURANT IN LONDON, U.K ... 42
FIGURE 22. MCDONALD’S SELF-SERVICE ORDERING KIOSK... 43
FIGURE 23. LEVEL OF TECHNOLOGICAL USE IN EUROPE AND JAPAN ... 46
FIGURE 24. IMPORTANCE OF TECHNOLOGY IN EUROPE AND JAPAN ... 46
FIGURE 25. FACTORS PREVENTING RESTAURANT OWNERS FROM ADOPTING TECHNOLOGIES IN THEIR RESTAURANTS ... 47
FIGURE 26. TECHNOLOGY USE AMONG RESPONDENTS IN PERCENTAGE ... 49
FIGURE 27. RESPONDENTS’ VALUE ASSESSMENT OF RESTAURANT TECHNOLOGIES ... 49
FIGURE 28. ROAD MAP AND RESEARCH DESIGN OF THE STUDY ... 51
FIGURE 29. COMPANY B‘S SOFTWARE TOOL ENVIRONMENT AND REPORTS THAT IT CAN PROVIDE ... 58
FIGURE 30. ENTERPRISE DATA MANAGEMENT SERVICE PROVIDED BY COMPANY B ... 59
FIGURE 31. PARTICIPANTS’ ROLE IN THE INTERVIEWED LOCATIONS ... 64
FIGURE 32. CATEGORIES OF INTERVIEWED BUSINESSES ... 65
FIGURE 33. TYPES OF USED TOOLS IN INTERVIEWED LOCATIONS ... 66
FIGURE 34. THE GIVEN VALUE BY PARTICIPANTS FOR THE ADAPTATION OF TECHNOLOGY IN ASKED BUSINESS PROCESSES ... 69
FIGURE 35. INTERESTING TOPIC FOR POS UPGRADES ... 71
FIGURE 36. THE ESTIMATED GIVEN TIME BY RESPONDENTS FOR A TECHNOLOGICAL UPGRADE ... 72
FIGURE 37. EXISTING BARRIERS FOR TECHNOLOGY IMPLEMENTATION ... 74
FIGURE 38. DIGITAL MARKETING AND SOCIAL MEDIA IMPLANTATION ... 75
FIGURE 39.PREFERRED SOCIAL MEDIA PLATFORMS ... 76
FIGURE 40.PARTICIPANT'S LEVEL OF INTEREST IN INVESTING E-MENU, TABLETOP AND ROBOTIC TECHNOLOGIES ... 77
FIGURE 41. PARTICIPANTS’ PERCEPTION ON THE TOPIC OF ARTIFICIAL INTELLIGENCE AND ROBOT IN THE FOOD SERVICE INDUSTRY ... 79
FIGURE 42. GENDER OF PARTICIPANTS FOR CUSTOMER SURVEY ... 81
1
FIGURE 44. PREFERRED PLACES FOR EATING OUTSIDE AMONG RESPONDENTS ... 84
FIGURE 45.CUSTOMER INTEREST LEVEL TOWARD WAITER ROBOT ... 85
FIGURE 46.CUSTOMER INTEREST LEVEL TOWARD CHEF ROBOT... 86
FIGURE 47. CUSTOMER INTEREST LEVEL TOWARD THE SELF-SERVICE KIOSK ... 87
FIGURE 48. CUSTOMER INTEREST LEVEL TOWARD TABLET-MENU ... 88
FIGURE 49. CUSTOMER INTEREST LEVEL TOWARD TOUCH SCREEN TABLE ... 89
1
LIST OF ABBREVIATIONS
AI Artificial Intelligence
AR Augmented Reality
BOH Back of the House
CRM Customer Relation Management
CPS Cyber-Physical System
FOH Front of the House
GDP Gross Domestic Product
HCI Human-Computer Interaction
Iot Internet of Things
KDS Kitchen Display System
POS Point of Sales
PDA Personal Device Assistance
RAISA Robot Artificial Intelligence Service Automation
SST Self-Service Technology
1 CHAPTER ONE INTRODUCTION
One of the fastest growing topics among academics is digital revolution or Industry 4.0, which refers to ongoing forth industrial revolution due to digital technology leap and pace of innovation (Okano, 2017). However, the impact of this phenomenon on the service sector and especially the food service industry is understudied and need extra attention (Bullinger, Neuhuttler, Nagele, & Woyke, 2017; Shamim, Cang, Yu, & Li, 2017). Internet of things (IoT), cyber-physical systems (CPR) and, real-data processing are main topics that define the main concept of industry 4.0 (Okano, 2017). These topics may not seem much relevant to the foodservice industry but in fact, the core aspect of them already found their ways to restaurants and cafes. For example, IoT technologies, which is the ability to embed connectivity into any intelligence device, is making a huge impact on the speed and performance of restaurants and cafes from placing orders and pouring drinks to managing inventory and entertaining customers (Intel, n.d.). Even the futuristic approach to restaurant automation through robots and artificial intelligence (AI) are making their place not just in people’s imagination but also into the actual kitchen of the restaurant for good reasons (Weiss et al., 2016).
We are living in the digital era where enterprises that neglect to adopt innovative technologies are vulnerable to falling behind their competitors and no industry is an exception from this notion. Digital options are transforming the way in which businesses are being done in all sectors even in those that are traditionally reliant on the human workforce. Foodservice industry, specifically restaurants and cafes, are currently undergoing such transformation (Sivalingam, 2019). According to a study
2
completed by the consultancy company PricewaterhouseCoopers in 2018, 73% of activities performed by humans in accommodation and food service sectors has the potential for automation (Hawksworth, Berriman, & Goel, 2018).
Every day more people upgrade their devices to “smart” versions. Today’s customers are connected more than ever. it is estimated that by 2020 more than 44% of the European population will have grown up with digitization. (Preveden & Tiefengraber, 2016). According to the National Restaurant Association of United State, 32 % of 18-34 years olds stated that technologies such as mobile apps, tablets, online and electronic ordering factors into their choice for selecting a quick service restaurant (National Restaurant Association[NRA], 2016). The ongoing digital revolution and new technologies that it brings can create more interconnectivity leading to greater communication, which is crucial for business such as restaurants and cafes (Benjamin, 2018).
Studies in the hospitality and food service industry indicate that technologies such as robotics and artificial intelligence (AI) can have financial and non-financial benefits for travel, tourism and hospitality companies (Ivanov & Webster, 2017). Adopting relevant technological system can bring potential benefits for a restaurant by increasing the speed of service, reducing processing cost, increasing volume and revenue and improving service and food quality (Dixon, Kimes, & Verma, 2009; Kimes, 2008). Technologies such as smart oil management, robotic, cloud-based systems, tabletop technology, and smart inventory systems are just a few examples of features that can be applied to a foodservice business in order to operate more efficiently in a very controlled environment (Intel, n.d.). For example, a restaurant with tabletop technology, integrated tables with touchscreen feature, can significantly reduce dining time by 30% just by allowing their guest to order and pay through such systems (Susskind & Curry, 2018). In addition, new technologies and innovations not only can increase the performance of restaurants and allow it to operate faster and smother but also bring uniqueness to a business which can attract more customers especially millennials who are seeking for innovation and new ways of doing things
3
(Cross, 2017). For instance, a hamburger-making robot by the name Flippy was so popular on its first day at a restaurant in Los Angeles that could not keep up with the demand and it was forced to take a break (Graham, 2018).
1.1 Problem Statement
Service Industry is the most important industry for the Turkish economy. According to the Annual Industry and Service Statistics of TurkStat (Turkish Statistical Institute), 43.2% of the active enterprises in 2017 was operating in the service sector only. In addition to that, the service industry in Turkey has the highest share of the labor force that is 36.8% of the total employment in the country. Accommodation and food service activities play an important role in the service industry and contain 2.6% of total Gross Domestic Product(GDP) of Turkey in the year 2016 (Turkstat, 2016). Meanwhile, a survey done by Turkish Statistical Institute shows that internet usage of individuals was 72.9% in 2016 and purchasing food and groceries took the fourth rank among e-shoppers in Turkey (Turkish Statistical Institute, 2018).
There are over 3,800 hotels, 5,000 catering companies, and over 200,000 restaurants and cafes in Turkey, alongside 360 shopping malls featuring food courts. (Atalaysun, 2017). These facts illustrate the importance of the service industry and especially the food service industry for Turkey. Moreover, hospitality sector and especially restaurants industry has been always facing major challenges such as lack of qualified workforce, high rate of employee turnover, high rate of operational mistakes and, theft (Demicco et al., 2013; Kuo, Chen, & Tseng, 2017; Mathath & Fernando, 2017). These challenges and many others can be addressed by applying the right type of technology solutions. As a result, staying relevant to currently available technology and providing better service for customers with the help of recent technologies and innovations is crucial in order to face existing challenges for this industry.
4 1.2 Purpose of the Study
The purpose of this study can be defined with one main research question that asks about the current situation of technological solutions for restaurants and cafes in Ankara. Three separate but interconnected objective purposed in order to address this question properly. The first objective was to gather information about available technological solutions, existing barriers for adaptation and future of them in the sector. In order to achieve this, quantitative approach in the form of two in-depth interviews with experts conducted with firms that provide various technological solutions and services for foodservice businesses in Ankara. The second objective was to explore the existing mindset of Turkish restaurateurs and restaurant managers about technological solutions. What does seem important from their perspective, what makes them stop from adopting technology into their businesses and, what are they expecting from technology in the future? Besides that, the current level of applied technology and existing systems in restaurants and cafes wanted to be investigated. To do so, 18 structured interviews with restaurateurs and restaurant managers in Ankara conducted. The third and final objective was to understand Turkish customers’ expectations and preferences for encountering specific types of technologies in restaurants and cafes. In order to achieve this goal, a survey about the interest level of customers toward certain types of technologies prepared and distributed among randomly selected people in restaurants and cafes in Ankara. 261 valid data collected and analyzed with the SPSS program.
5 CHAPTER TWO LITERATURE REVIEW
2.1 Industrial Revolutions, Technology and Economy:
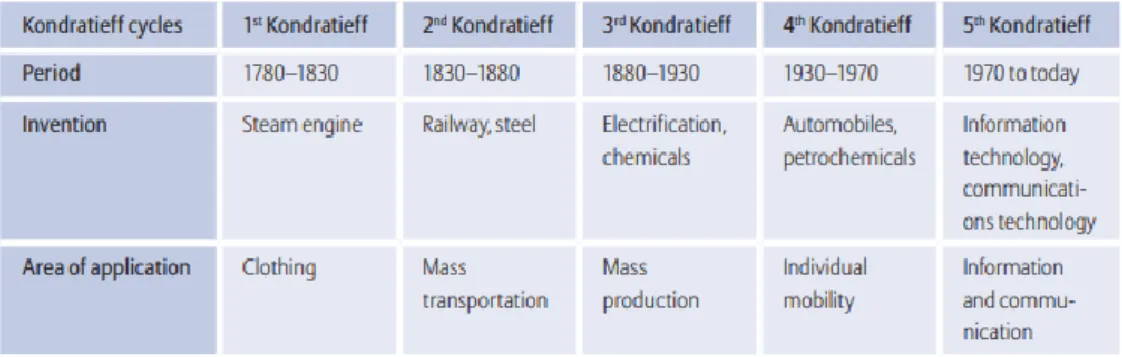
In order to fully understand the concept of industrial revolutions, it is essential to examine the history of Industrial Revolutions and how they evolved from past to present time. To do so, first, we study industrial revolutions as a whole and later we examine each industrial revolution one by one. Industrial revolutions started from a certain point of time in history and they kept happening since then. These events take a few decades to develop from the beginning to end and after each time they brought radical positive changes to the overall quality of human life that cannot be ignored (De Vries, 1994). Perhaps the first person who notices these patterns was Nikolai Kondratiev. He was a Soviet economist who attracted the attention of the world by analyzing the macroeconomic performance of leading economics of that time which was UK, USA, France, and Germany between 1790 and 1920 (Tichy, 2011). Kondratiev stated that these economies went through similar cycles or waves that range between 40 to 60 years and contains alternating interval between high sectoral growth and interval of relatively slow growth (Kondratiev, 1935) (Table 1 & Figure1).
6
Table 1. Kondratiev Cycles with the major invention of that period
Figure 1. Kondratiev Waves from past till present
Kondratiev explained these economic behaviors by changes in technology, wars, the birth of new countries and the fluctuation in the production of gold (Kondratiev, 1935). Later Joseph Alois Schumpeter, who considered to be one of the leading economists in the 20th century, perfected Kondratiev idea by his theory of “Economic Development and Disruptive Technology” (Emami-Langroodi, 2017). Schumpeter added some internal factors such as political reasons, economic status and social factors for explaining those cycles that he named “Kondratiev Waves” (Tichy, 2011). Schumpeter was also the first person who claimed that these waves were the
7
effect of big innovations such as steam power and electricity that cause the big change in the world’s economy and caused Industrial Revolutions (Tichy, 2011). Later he stated his theory of Creative Destruction based on that and today the world knows him as a man who discovered capitalism (Emami-Langroodi, 2017).
As it is illustrated in Figure 2, the Kondratiev waves have 4 phases that include expansion, deflationary growth, recession and stagflation that is the turning point between expansion and deflationary growth.
Figure 2. Stages of Kondratiev Waves
Almost all industrial revolutions followed such wave characteristic and in fact, the world is in the latest wave that caused by the innovation of the internet and its fast expansion in today's life (Cavusoglu, 2015). The industrial eras will be defined in detail in the following sections.
2.1.1 First Industrial Revolution
First Industrial Revolution (Industry 1.0) started in the 1760s by the invention of steam power and it almost took 70 years to develop completely. Since this
8
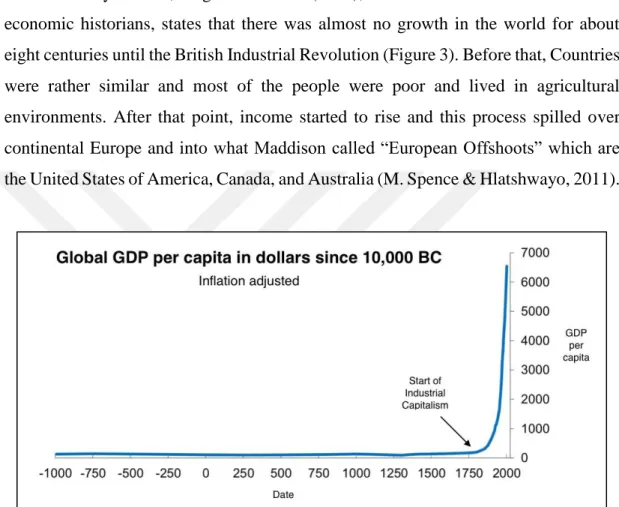
phenomenon started in the United Kingdom it is also known as the British Industrial Revolution but soon enough it spread to all over the world (De Vries, 1994). In this period, the production cycle evolved from physical human strength to machine power resulting in higher quantity and improved quality. This dramatic change in production made a huge impact on the structure of the world economy and its growth, for the first time in history. In fact, Angus Maddison (2007), who considered as one of the best economic historians, states that there was almost no growth in the world for about eight centuries until the British Industrial Revolution (Figure 3). Before that, Countries were rather similar and most of the people were poor and lived in agricultural environments. After that point, income started to rise and this process spilled over continental Europe and into what Maddison called “European Offshoots” which are the United States of America, Canada, and Australia (M. Spence & Hlatshwayo, 2011).
Figure 3. Average Global GDP since 10,000 BC
The first industrial revolution not only had a significant role in the world economy but also on its social structure. After that point, everyday life became significantly easier that lead to a better quality of life and increase in population and the average length of life. As the first Industrial revolution proceeded its journey, European countries turned to Near, Middle, and Far East countries that resulted in more sources, production and higher trade among their markets. At the end of the first
9
industrial revolution, not only the industrial aspect of human life evolved but also its social and international relations shaped as well (De Vries, 1994).
2.1.2 Second Industrial Revolution
The second Industrial Revolution does not happen immediately after the first one. Although it usually dated between 1870 and 1915, some of its characteristics started in 1850 (Mokyr, 1998). In general, the second industrial revolution or Industry 2.0 accelerated the mutual feedback between science and technology. It extended the limited and localized achievements of the first industrial revolution to the much broader range. The purchasing power of money for middle and working class increased rapidly which lead to higher living standards (De Vries, 1994). The second industrial revolution turned the large technological system from exceptions to commonplaces. Basically, Industry 2.0 was a chain of innovation and success that leaded one to another and final result of them were mass production and abundance of products. Electricity was the most important innovation of that era which superior the steam power and ensured that the machines are further advanced for mass production. Electricity made the production of steal cheaper and easier which lead to its mass production and expansion of railroads that allowed products and raw materials to move much faster for long distances. Meanwhile, the telephone or “talking telegram” was invented, which was a huge step by the mean of communication. There were also some achievements in other sectors such as agriculture and food processing, household technology and human welfare but they were not as significant as those mentioned. These series of innovations and achievement lead to the development of the heavy industry and prepared the way for the upcoming industrial revolutions (Mokyr, 1998).
2.1.3 Third Industrial Revolution
10
in the 1960s. This industrial revolution directed by the shift of mechanical and analog electronic technology to digital electronics. It all started with the development of digital technology and the invention of an electrically driven mechanical calculator that lead to basic modern computers. This was a huge step in the development of communication technologies along with the supercomputers. For the first time in history, the man was capable of solving multiple and complex problems in a very short time that allows him to reach beyond its imagination. At the same time, new types of energies such as nuclear, wind, thermal and solar were emerging to decrees the level of dependency of human to oil and other fossil fuel energies. The turning point in this era was the discovery of internet which connected world more than ever and resulted in an explosion of knowledge that leads to numerous innovation in almost all sectors. Fields such as nanotechnology biotechnology, artificial intelligence (AI), robotics, quantum computing, and 3-D printing are the most recent and still advancing topics that are the result of this breakthrough technology (Rifkin, 2012).
2.1.4 Fourth Industrial Revolution
The term “Industry 4.0” introduced for the first time in the year 2011 at Honnavor Trade Fair and it originated from a project in the high-tech strategy of the German government. Experts suggested that the modern industrial revolution has arrived in the information era and when the German government took these suggestions seriously, the fourth industrial revolution by the name of Industry 4.0 was established. After the trade fair, a working group on Industry 4.0 was formed. One year later, the group presented the final report on the actual implementation of Industry 4.0 to German government at Hannover Fair in 2013 (Okano, 2017).
Industry 4.0 contains a vision for tomorrow’s manufacturing where products find their way independently through the production process (Moavenzadeh, 2015). Intelligent factories, machines, and products communicate with each other and cooperatively drive production where raw materials and machines are interconnected
11
within the Internet of Things (IoT). The objectives in Industry 4.0’ vision are highly flexible, individualized and resource friendly mass production (Deloitte, 2015).
Three paradigms can explain the core aspect of Industry 4.0 according to experts (Okano, 2017; Weyer, Schmitt, Ohmer, & Gorecky, 2015); the smart product, the smart equipment or machine and augmented operator. The smart product refers role of the final output as an active role of a system that has a memory and collects data and information after production. The second paradigm refers to smart equipment that uses edge technology and sensitive sensors in an interconnected platform to operate side-by-side humans. Such platform described by Cyber-Physical Production System (CPPS). The last paradigm which is augmented operator targets the worker who needs to operate in the explained environment while they provide required technical support to that environment (Weyer et al., 2015).
2.1.4.1 Characteristics of Industry 4.0
Industry 4.0 can be considered as the next generation of digitalization in manufacturing which enables firms to customize their output at a lower cost and better quality. Such smart businesses with a high level of automation and efficiency can vary widely from one industry to another; however, they share some mutual specifications and characteristics (Nilsen & Nyberg, 2016). Literature research reveals that there are four main characteristics for defining Industry 4.0; vertical networking of smart production, horizontal integration through value chain network, end-to-end engineering and exponential technologies (Deloitte, 2015; Nilsen & Nyberg, 2016) (Figure 4).
12
Figure 4. The four characteristics of Industry 4.0
The first main characteristics of Industry 4.0 is the vertical networking of smart production in a factory. This characteristic can be achieved by connecting machines and devices within a system inside the firm that it is highly dependent on information sharing through sensors, control system, and cloud-based solution. Such a system named Cyber-Physical Production System (CPPS) or Cyber-Physical Production (CPS) that allow the production customer-specific and individualized. CPS create an autonomous organization of production management that increase a firm’s performance and its resource efficiency (Deloitte, 2015).
The second main characteristic of Industry 4.0 is horizontal integration via a new generation of the global value chain. This means that a firm should consider itself as a part of a global value chain network and position itself accordingly (Nilsen & Nyberg, 2016). Various departments of a firm such as a warehouse, R&D, purchasing, production, and sales not only can monitor and exchange product data in real-time but also can access history of any part or product at any time. This enables integrated
13
transparency within the firm and achieves a high level of flexibility that allows it to respond more rapidly and accurately to problems and challenges that occurs within an organization or market. Moreover, this kind of horizontal integration facilitates global optimization and generate completely new business models and new models of cooperation in the future (Nilsen & Nyberg, 2016).
The third main characteristic of Industry 4.0 is lifecycle management and end-to-end engineering through the entire value chain. Engineering the product life cycle to obtain a model is an achievable goal with the help of rapid development within the area of virtualization and communication. Designing and developing new product or service need seamless engineering through the product lifecycle. This coordinated production system enables new synergies to be created between product development and production system itself (Deloitte, 2015).
The last and fourth characteristic of Industry 4.0 is the impact of exponential technology on industrial processes. This characteristic can be considered as the most important one because it helps and feeds other characteristics of Industry 4.0 by acting as an accelerant or catalyst (Deloitte, 2015). For example, advanced robotics and sensor technology with the help of Artificial Intelligence (AI) have the potential to allow individualized solutions, flexibility, and cost savings for industrial processes. Another good example is additive manufacturing or 3D printing that allows new manufacturing solutions and new supply chain solutions or a combination of both for creating new business models (Nilsen & Nyberg, 2016).
2.2 The Importance of the Service Industry for the Turkish Economy
The service industry is the most important industry for the Turkish economy not only because of its highest share in the labor force but also for the high rate of active enterprises in Turkey (Turkstat, 2016). According to annual industry and service statistics report, 41.7% of the active enterprises in 2015 was in the service sector only.
14
Moreover, 36.8 % of total Turkey’s labor force occupied by service sector alone which followed by 28% in industry, 22.6% trade and 11.8 % construction sector (Figure 5).
Figure 5. Percentage number of enterprises, employment, and turnover by sectors in 2015 (Source: Turkish Statistical Institute)
If we categorize Turkish Gross Domestic Product in three sections of Agriculture, Industry, and Services, the service sector dominates Turkey’s GDP by 60.72% of the total share, which follows by 32.36% and 6.93% in industry and agriculture sectors respectively in the year 2016 (Turkstat, 2017).
2.2.1 The Economic Impact of the Food Service Industry on Turkish Economy
According to Turkish Statistical Institute Report in 2016, accommodation and food service activities has 2.6% of total GDP of Turkey, which is the same amount as human health and social service activities and higher than information and communication (Turkstat, 2016). The Turkish food and beverage industry is a 300 billion dollar market with approximately 40,000 companies operating in the sector. Turkey’s Hotels and Restaurants Institutes (HRI) sector represents around 6% of Turkey’s total food and drink market. There are over 3,800 hotels, 5,000 catering companies, and over 200,000 restaurants and cafes in Turkey, alongside 360 shopping malls featuring food courts (Atalaysun, 2017).
Half of the 80 million population of Turkey is below the age of 35 and this young population is one of the major factors that drive consumer behavior such as
15
traveling and eating out (Atalaysun, 2017). Hotel and Restaurant Industry (HRI) is around 20 billion US dollar market in Turkey. Istanbul (a most populated city in Turkey) generate 43% of the HRI sector’s revenue alone and five cities of Muğla, Antalya, Izmir, Ankara, and Bursa generate 30 % of that revenue. The remainder is generated throughout the rest of Turkey. Over half of this revenue belongs to fast food and restaurants combined, with hotels as the next largest, and then under ten percent each for bakeries/patisseries, coffee shops, food stalls, and catering companies/schools (Atalaysun, 2017).
Figure 6. Distribution of Turkish household consumption expenditure in 2016 and 2017
According to the Turkish Statistical Institute, expenditure on restaurants and hotels take 6.2 % of household consumption expenditures in the year 2017 for Turkish families while it was 6.4% in 2016 (Figure 6). This is fourth place in total household consumption expenditures and comes after housing, food, and transportation respectively (TurkStat, 2018).
16
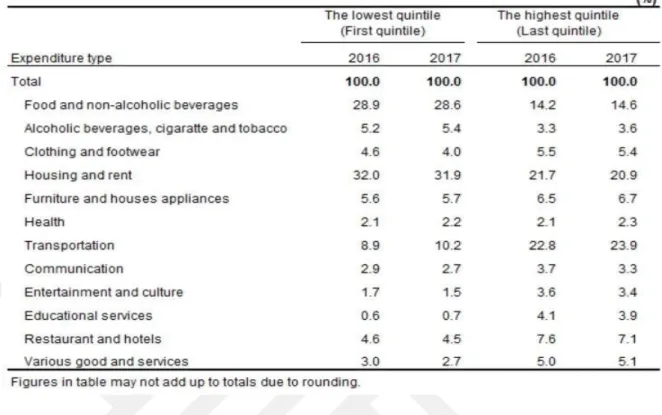
Table 2. Distribution of consumption expenditures by quintiles ordered by income, 2016, 2017 (Source: Turkish Statistical Institute)
In addition to that, when we look at the distribution of consumption expenditures by quintiles ordered by income in 2017, restaurant and hotels expenditures was 7.1% for households in the fifth quintile (the highest quintile). Table 2 compares this
distribution for the year 2016 and 2017 (TurkStat, 2018).
2.2.1 Food Eaten Away from Home in Turkey
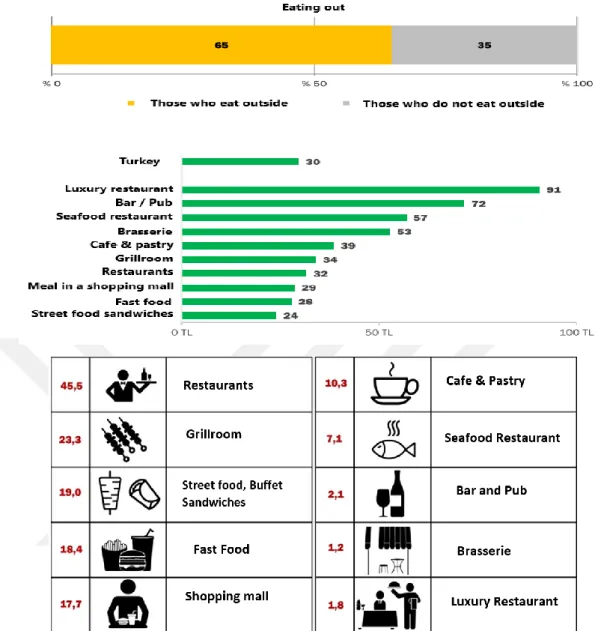
Unfortunately, there are no official statistics for the number of people who eat their meal out of the house and how much they spent on which types of restaurants. However, on December 2017 a private survey was conducted by a research and consulting company by the name of Konda with cooperation of Metro Toptancı Market about Turkish people eating and drinking habits. On the survey, which was done on almost 3000 individuals from 163 different regions in Turkey, 65 % of participant stated that they usually eat out of their houses. The average amount of money spent on each person was 30 Turkish Lira (Konda, 2017).
17
Figure 7 . Habit of eating outside and types of restaurant that Turkish people go when they eat out (Source: Konda, Research & Consulting Company)
Moreover, the following result obtained when the participants were asked about the types of places they go when they are eating out (Figure 7). As it is illustrated, most Turkish people have their meals in an ordinary restaurant (Lokanta) that serve traditional Turkish food. Grillrooms (Kebapçı) is the second most visited place among Turkish people and it follows by buffet Sandwiches (Dönerci) and fast food restaurants. The least visited places where brasserie (Birahane) and luxury restaurants among Turkish people (Konda, 2017).
18 2.3 Technology for the Restaurants Industry
The evolution of food service technology from low-tech to high-tech has a very long history (Table 3). The turning point starts in the 1990s with the introduction of new packaging systems and convenience/availability of high tech devices in the kitchen, which allowed the development of new highly effective business models into the market (Pantelidis, 2009). The rapid leap and development in digital technology raise the question that how these technologies will enhance and improve customers dining experience in the coming years. People in the field believe that there is tremendous scope for revolutionizing the experience and even behavior of our eating and drinking by means of the intelligence marriage of dining with the latest digital technology (Spence & Piqueras-Fiszman, 2012: 311).
19
New technologies and innovations not only can increase the performance of restaurants and allow it to operate faster and smother but also bring uniqueness to a business which can attract more customers especially millennials who are seeking for innovation and new ways of doing things (Cross, 2017). Literature review indicates that there are various studies that show applying relevant type of technology for proper restaurants can be beneficial for the business in topics such as; revenue, efficiency, speed, quality of service, management, customer satisfaction and safety (Dixon et al., 2009; Frontline, n.d.; Kansakar, Munir, & Shabani, 2017; Kimes, 2008; H.-Y. Wang & Wu, 2014). Adopting a relevant technological system can bring potential benefits for a restaurant by increasing the speed of service, reducing processing cost, increasing volume and revenue and improving service and food quality. Systems such as kitchen display systems (KDS) and table management system can result in advancing food production and tightening service time while communications technologies and handheld devices can reduce the order taking time and shortening payment (Kimes, 2008). Technologies such as Self-Service Technology (SST) enables customers to consume different benefits and services on their own, independent of the involvement of an employee at a company which results in increased level of satisfaction in customers, lowering cost and creating brand loyalty for the business (Kincaid & Baloglu, 2008). Self-service technologies and off-site ordering/reservation systems will assist staff and can result in lowering labor costs in the restaurant. Moreover, online reservation or ordering make the restaurant more accessible for customers, which result in higher revenue for the restaurant (Kimes, 2008).
According to Spence (2014), there has been an enormous growth in modernist cuisine in recent years that relied on the development and use of new technologies in the kitchen. Although one may see the major of such technologies in the press releases or news stations, various technologies have already found their way unannounced into many of restaurant environment (Spence & Piqueras-Fiszman, 2014: 312).
20
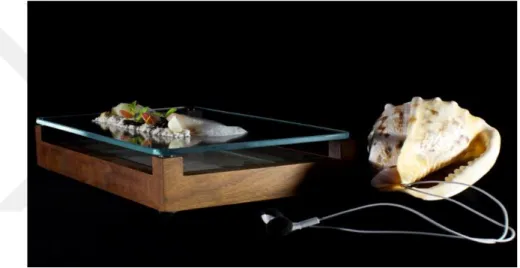
The level of technology does not necessarily need to be very high or complex for providing a unique dining experience. A good example to illustrate this point is a famous seafood dish by the name of “The sound of the sea” that is served in The Fat Duck restaurant in Bray, UK. This dish has been a signature of this successful restaurant for so many years. The stylish dish with a seashore theme comes with an empty seashell that has iPod earphones (Figure 8). The iPod plays a soundscape of crashing waves and seagulls that was developed by a London-based sonic design agency. Such simple technology involvement with the perfect dish has the potential of transforming dining to strong emotional experience for some people (Spence & Piqueras-Fiszman, 2012: 315-316).
Figure 8. “The sound of the sea”, the Famous dish in The Fat Duck restaurant
Restaurant technology can also come with Human-Computer Interaction (HCI) as a form of food-related augmented reality (AR) or virtual reality (VR). Although it may seem like a weird and strange concept for a dining experience, it attracted a growing amount of researcher in Human-Computer Interaction community over the recent years (Tanaka, Koizumi, Uema, & Inami, 2011). For instance, “Chewing Jockey” is a decent food related augmented reality (AR) that enhance the eating experience by creating or filtering sound effect with jaw motion (Figure 9). This system consists of three main elements for designing/filtering sound effect, bite detection and self-feedback system. Creators of Chewing Jockey believe their creation
21
can enhance the eating sensation for dentures users or those who are not able to bite strongly because of their medical condition. They also claim that their device can be used for entertainment and chewing game experience such that when the user starts to chew, they will hear sounds (e.g. screaming) which make the food feel like a living creature inside the user month. Alternatively, it can make the sound effect of super crispy potato chips for each bite (Koizumi, Uema, & Inami, 2011).
Figure 9. Chewing Jockey, an augmented reality device
2.3.1 Benefits of Technology for Customers and Guest Experience
Technology systems in a restaurant can benefit customers by improving their dining experience. Improved convenience and increased control are the two main benefits of technology for customers in a restaurant. When customers are provided with higher substantial control over their provided service, they are more likely to be
22
satisfied (Dixon et al., 2009). Increased control of customer in a restaurant can appear as behavior control, cognitive control, and decisional control. Behavioral control relates directly with the influence and power of customers for modification of their service. For example, customizing orders and choosing the time of serving at the desired table can enhance behavioral control for customers in the restaurant. Cognitive control concerns with the predictability of a situation for customers in the restaurant. For instance, providing the estimated time for delivering a service to customers can enhance their cognitive control over their provided service. Decisional control is the degree of freedom that customers can have by choosing among a selection of outcomes and goals. For example, the paging system can give options for customers who are waiting to be seated weather to stay in the restaurant or leave and return when their table is ready (Dixon et al., 2009; Kimes, 2008)
2.3.2 Effect of Technology on Dining Experience
Depending on the stage of dining, technology can play an important role in the dining experience in the restaurants. Various types of technology can be applied in order to enhance managing customer dining experience. In general, the dining experience consists of six stages (Kimes, 2008):
1) Pre-arrival: Time period from when customers decide to go to a restaurant until they actually arrive at the restaurant
2) Post-arrival: Time period from the arrival of customers until they are seated at their table
3) Pre-process: Time period from when customers are seated until they place their order 4) In-process: Time period from when customers receive their order until they ask for
their cheek
5) Post-process: Time period from when customers request for check until they leave the restaurant
6) Table turnover: Time period from when customers leave their table until the table is reseated again
23
Each stage of dining experience can benefit from technology systems that specifically designed to enhance the performance of the restaurant. During the pre-arrival stage, the restaurant should provide options such as preordering (whether online or with a phone call), online reservation/ordering in order to give more control to customers for managing their time. The goal of the post-arrival stage is to minimize waiting and seating process for customers or at least make it predictable. Table management systems (TMS) and communication systems provide tools for restaurant operators to achieve these goals. With the help of such technologies, managers in the restaurants can track when tables are available and specify accurately the waiting times. Moreover, it allows managers to determine the right table that best fits the party and customers prefer. Pre-process stage can benefit from two primary technology of handheld devices and communication systems that allow speeding up the ordering time. Handheld order-taking technology is specifically designed for reducing order time and improve quality of service provided by allowing servers to give more attention to customers and provide them with more detail and information on items that are being ordered. During the in-process stage, technologies such as kitchen display system (KDS), TMS and communication and paging devices can give control to the pace at which the meal is prepared and ensure that orders are being prepared in a timely fashion. Tightening the post-process stage is crucial to not only improve customer satisfaction but also allowing greater customers to be seated in busy times. Beside TMS and communication systems discussed above, different types of payment methods through handheld devices can speed up the payment process (Kimes, 2008).
2.4 Restaurant Technology Applications/Systems
Nowadays, many restaurants apply various types of technology in their businesses in order to operate with fewer mistakes, higher productivity, and improved marketing know-how. The digital age has created a wave of technological applications and systems that changed the way restaurants operate and monitor their actions (Frederick et al., 2013: 116). In general, the restaurant’s structure is divided into two
24
main parts, which are Front of the House (FOH) and Back of the House (BOH). Any operation related to customers in the dining areas such as taking orders, delivering food and completing payment belongs to the front of the house (Walker, 2010). Back of the house or back-office are areas that relate with purchasing, receiving, storage, food preparation, service, dishwashing area, sanitation, accounting, budgeting and control (Meyer & Vann, 2013: 152). Technologies used in restaurants are also split into two main groups; systems/applications that are used in FOH operations and those used in BOH operations. Moreover, there are systems that integrate both parts so that operators can input and extract information from both programs (Walker, 2010: 392). There are also technologies such as robots and artificial intelligence (AI) that can be applied on both the front of the house and the back of the house (Mathath & Fernando, 2017: 293). In this section, first we discuss this technology and later we take a look at technologies related to BOH and FOH separately.
2.4.1 Robots, Artificial Intelligence, and Service Automation
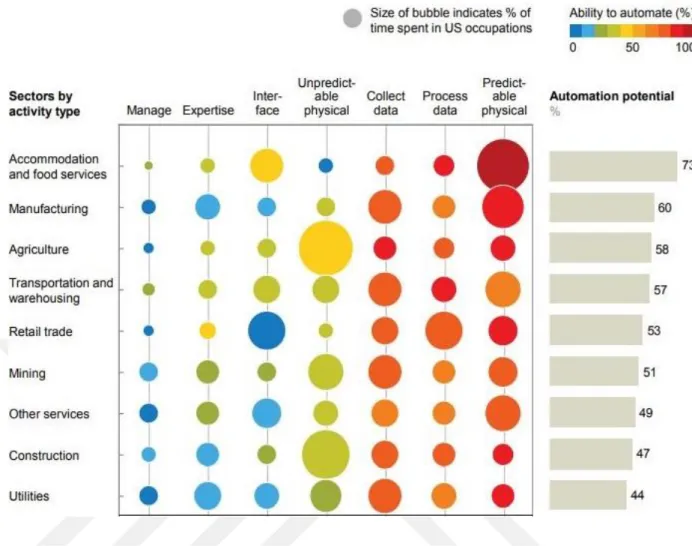
According to a study done by PricewaterhouseCooper worldwide in 2018, 73% of activities performed by humans in accommodation and food service sector has the potential for automation (Figure 10). In their study, they also mentioned Turkey with having 33% potential jobs at risk of automation. Moreover, Turkey is considered as a country that has relatively high exposure to later waves of automation but relatively lower exposure in short term (Hawksworth et al., 2018).
25
Figure 10. The technical potential for automation across sectors varies depending on the mix of activity types (Soruce: PricewaterhouseCooper, 2018)
Robots, Artificial Intelligence and Service Automation (RAISA) can address some main challenges for the hospitality industry. Challenges such as labor shortage, an increase of non-English speaker international travelers and a large volume of customer’s data are few of them (Bowen & Morosan, 2018). Especially the shortage of qualified workforce and a high rate of employee turnover of the hospitality sector is becoming a critical issue for some countries (Kuo et al., 2017; Mathath & Fernando, 2017). For example, It is estimated that there will be a shortage of 60,000 workforce a year for the hospitality sector in UK only if restriction for immigration is too tight due to Brexit (The impending withdraw of the United Kingdom from the European Union) (Kamal, 2017). It is predicted that by 2030, companies that effectively adopt
26
and implement RAISA into their businesses will have a competitive advantage over those who did not (Bowen & Morosan, 2018).
2.4.1.1 Benefit and Shortcomings of RAISA
Applying RAISA has its benefits and costs like any other technology. Mathath & Fernando (2017), mention benefits of robots for the food industry in minimizing errors, increasing efficiency, reducing capital costs, increasing productivity, reducing operational cost, improving product quality and consistency, increasing accuracy, increasing flexibility, reducing labor turnover and higher repeatability (Mathath & Fernando, 2017: 288-291).
Costs and benefits can be both financial and non-financial for applying RAISA in the hospitality industry (Ivanov & Webster, 2017). The most important financial benefits of RAISA is the labor cost saving that resulted by using 24/7 service robots, chatbots and self-service kiosk instead of human employees. In addition to that, chatbots can provide services for multiple customers at the same time, which is not possible with the traditional way. Adopting these technologies does not necessarily mean to eliminate human forces but rather enhancing employees with their tasks and improving productivity. Robots and artificial intelligence can also have a positive contribution to sales due to being interesting and unique for some customers especially in the early stage of adaptation of technology in the sector.
Main non-financial benefits of applying RAISA is enhancing the perceived service quality through unique methods of servicing, communicating and engaging customers. For example, the limited scope of languages by staff can be eliminated easily by applying RAISA and communicating through multiple languages with customers is easily feasible inside the business. RAISA can also create value for customers by providing service in a fun and entertaining way. Furthermore, RAISA would solve the problem of sectoral employee turnover and eliminate any law related
27
problem with hiring and firing staff (Ivanov & Webster, 2017).
On the other hand, there are financial and non-financial costs for adopting RAISA in the hospitality industry. Financial expenses include the cost for acquisition, installation, maintenance, software update, staff training or hiring specialist and costs for adapting the environment to facilitate robot’s mobility. There can also be non-financial cost related to the resistance of employees for adopting RAISA into their work environment. Adopting any types of new technology into business need reengineering of the processes inside the organization. This may include training staff to use new technology and redefining operations manual for them, which may push some people out of their comfort zone. Furthermore, employees may consider new technology as a threat to their jobs. Resisting to adopt new technology can also extend to customers as well. Some people might feel uncomfortable and unsure on how to use new technology or they may just prefer the touch of human rather than high tech device for providing service for them (Ivanov & Webster, 2017). In other words, acceptance of customers and employees are two determining factors for the success of new technology into the business. Even if financial calculation for adopting new technology is favorable, managers still need to consider customers and employees and understand their perception for adopting new technology (Dixon et al., 2009; Kimes, 2008).
2.4.1.2 Examples of Chef Robots
Although the concept of using Artificial Intelligence (AI) in the kitchen may sound like a very new topic, in fact, the first prototype was designed more than a decade ago (Hashimoto et al., 2008). Kyoto University in Tokyo with the help of National Institute of Information and Communications Technology of Japan designed and built a smart kitchen where AI observe and learn the process of cooking with the help of smart sensors, motion detector cameras and thermal cameras (Hashimoto et al., 2008).
28
Figure 11. The world's first robotic kitchen created by Moley Company
A British company by the name of Moley Robotic perfected this idea by combining it with perfectly designed robotic arms and created the world’s first fully automated and intelligent cooking robot in 2015 (Figure 11). Their robot can learn up to 2,000 recipes and mimic the motion of chef human with the help of 20 motors and 130 sensors (Gibson, 2015).
Figure 12. Spyce, a robotic restaurant in Boston, USA
The above-mentioned robots are specially designed for the household task and not suitable for restaurants and businesses. Robotic technology and robot chefs come in a variety of types for the restaurant industry. Perhaps the most successful and recent one is by the name of Spyce, which was founded by four MIT graduate students
29
(Holey, 2017). Spyce currently runs a Boston restaurant that relies on seven autonomous cooking pot that rotates and prepares freshly made dishes for customers (Figure 12). As of March 2018, Spyce is capable of preparing seven different bowls from seven different parts of the world. Each bowl takes 3 minutes or less to prepare and cost just 7.5$ (Spyce, 2017).
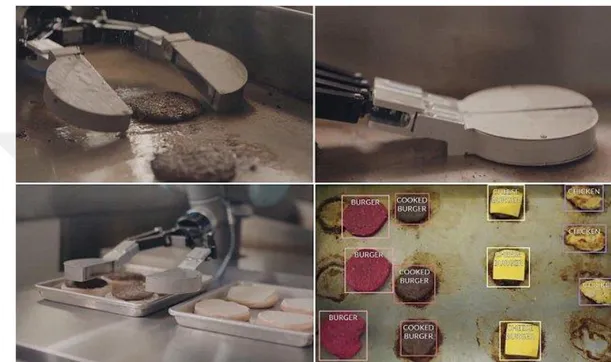
Figure 13. Flippy, The world first autonomous robotic kitchen assistance by MISO robotics
The world first autonomous robotic kitchen assistance by the name of Flippy gained media attention since it started his job at the Caliburger restaurant in Los Angles (Godwin, 2018; Graham, 2018; Holey, 2017). Flippy is a robotic arm with Artificial Intelligence (AI) that is made by MISO robotics (Figure 13). It is designed specifically for use in the commercial kitchen and fast-food restaurants. This robotic arm is capable of making burgers up to 1,000 a day according to David Zito, CEO of Miso Robotics (Bandoim, 2018; Graham, 2018). It has different arms/tools for flipping the meat, removing cooked meat from the heat and cleaning the grill for after cooking. Flippy is food-safe device and it is equipped with laser sensors that allow staff to collaborate with Flippy safely. Moreover, it has 3D and thermal scanners for eyes and
30
manufacturer-connected AI for the brain (Bandoim, 2018). The cloud-connected artificial intelligence of Flippy enables it to learn from its surroundings and learn new skills over time. CaliBurger plans to expand Flippy to more than 50 of its franchises throughout worldwide by the end of 2019 (Owano, 2017).
2.4.1.3 Examples of Waiter Robots
Deploying robotic technologies and automation for the front of the house in a restaurant means less waiter/waiters for delivering orders to the customers (Asif, Sabeel, Rahman, & Khan, 2015). Many think that the digital technologies may just assist the waiter for taking and transferring orders to the kitchen. However, it may not be too long before the elimination of the waiter at first place for taking orders. Successful example for this idea is the Baggers Restaurant in Germany (Pantelidis, 2009) which use the clever engineering that relies on gravity for the delivery of food and drinks on the table (Figure 14).
31
Exactly same concept is applying in nine branches of Rollercoaster Restaurants in Europe and the Middle East (http://www.rollercoasterrestaurant.com). These restaurants operate with no waiter for delivering orders and customers can place their order through tablets that are handed to them. These tablets are integrated with the POS system and Kitchen Display System of the restaurant for real-time communication between FOH and BOH. Moreover, details information about menu items and their nutritional facts are provided for customers through the same device. Customers just place their orders through those tablets and after a while, their food or drinks slide spirally from the upper floor (kitchen of the restaurant) to their table (Alton Towers, 2016).
Using robots in the environment of restaurants are becoming more common as robotic technology advance each day. Social service robots are the type of robots that can do the jobs of a servant in the restaurant (Weiss et al., 2016). According to IFR (International Federation of Robotics), a service robot is a robot that automatically provides useful services for humans or other machines, excluding manufacturing operations (https://www.ifr.org/service-robots/). Social robots are those that are designed to communicate and interact with humans and are capable of understanding the social term (Asif et al., 2015).
The first restaurant that used robots for delivering its food to customers was a Chinese restaurant in Pasadena, California in 1983. Those robot waiters were huge in size and were not practical due to the low level of robotic technology of that time (Davis, 2012). Nowadays, there are several restaurants and cafes around the world that use robots for not only delivering orders to customers but also for entertainment (Mathath & Fernando, 2017; Weiss et al., 2016). Hajime is a Japanese robotic restaurant with a samurai theme that is located in Bangkok, Thailand. Customers place their orders through a user-friendly touch screen that is installed in front of them and a legless robot that dressed as a samurai wheels down to the kitchen and delivers orders when they are ready (Weiss et al., 2016). For safety reasons, the restaurant is designed
32
in a way that no customers can be in the path of the robot and only through windows they can pick their delivered dishes (Figure 15, right).
Figure 15. FU-RO the waiter robot (left) & Hajime restaurant in Bangkok, Thailand (right)
Another great example for waiter robot is FU-RO restaurant robot that is produced by South Korean Robotics Company by the name of Future Robot Co. Ltd. This practical restaurant robot is specially designed for restaurants such that it can be integrated with POS and other operating of the restaurant (Figure 15, left). Customers and waiter robot can easily interact with each other through specially designed HRI (Human-Robot Interaction) service technology by the company. With the help of FU-RO customers can access to menu, order and even pay with their bank or credit card (Weiss et al., 2016).
33
Figure 16. Ada, the Turkish waiter robot in cafe Cadde Meram in Konya, Turkey
The Turkish example for using the robot as a waiter is Cadde Meram cafe in Konya, Turkey. This place is not only a cafe but also a robotic application center for Software Engineering Company by the name Akinsoft. The robot by the name of “Ada” is serving humans by delivering orders and greeting customers in the cafe for the first time in Turkey (Figure 16) (Anadolu Ajansi, 2015). This robot is 150 cm long and weight around 30 kg. There are special paths for robots in the restaurant in order to move and provide services for tables without any accident (Akinsoft, 2018).
Anthropomorphism is an important concept that needs to be taken into consideration for using waiter robots in a restaurant or in the hospitality sector in general. Human responds and likeness toward robots is not linear and can change dramatically according to robot autonomy, capabilities and anthropomorphic differences (Murphy, Gretzel, & Hofacker, 2017). This idea is known as The Uncanny Valley and it first brought up by Masahiro Mori, a robotics professor at the Tokyo Institute of Technology in 1970. Mori observed that as robots become more and more humanlike, people start to feel more comfortable around them until some certain point (Figure 17). Some people start repulsing robots and feeling uncomfortable after that point but the relation becomes positive again as the robots look more like healthy
34
humans (Mori, 2012). In other words, the degree of how robots move, act and resemble human can affect acceptance, affective reaction, and loyalty of customers toward the waiter robot (Murphy et al., 2017).
Figure 17. The Uncanny Valley by Mori in 1970
2.4.2 Back of the House (BOH)
Back of the house or back-office are areas that relate with purchasing, receiving, storage, food preparation, service, dishwashing area, sanitation, accounting, budgeting and control (Meyer & Vann, 2013: 152). Similarly, BOH technology consists of product management systems for purchasing, managing inventories, menu management, controlling labor costs and kitchen display systems. Most of these systems and applications come in the form of software programs that allow operators to be up to date and have accurate information for better decision making (Walker, 2010: 392). According to the American Hotel & Lodging Association (AH & AL),