C om mun. Fac. Sci. U niv. A nk. Sér. A 1 M ath. Stat. Volum e 67, N umb er 2, Pages 1–10 (2018)
D O I: 10.1501/C om mua1_ 0000000856 ISSN 1303–5991
http://com munications.science.ankara.edu.tr/index.php?series= A 1
A CORRECTION ON TANGENTBOOST ALGORITHM
ONUR TOKA AND MERAL CETIN
Abstract. TangentBoost is a robust boosting algorithm. The method com-bines loss function and weak classi…ers. In addition, TangentBoost gives penal-ties not only misclassi…cation but also true classi…cation margin in order to get more stable classi…ers. Despite the fact that the method is good one in ob ject tracking, propensity scores are obtained improperly in the algorithm. The problem causes mislabeling of observations in the statistical classi…cation. In this paper, there is a correction proposal for TangentBoost algorithm. After the correction on the algorithm, there is a simulation study for the new algo-rithm. The results show that correction on the algorithm is useful for binary classi…cation.
1. Introduction
Classi…cation, in other words supervised learning, is a procedure that obtain a classi…er based on a training dataset. The observed classi…er determines which class the observation belongs to. High accuracy in the testing dataset means that the classi…er is better one. Risk classi…cation, cancer detection, object detection, outlier detection, image classi…cation are some applied areas in classi…cation methods. Over the last decade, many statistical methods have been applied including linear regression, logistic regression (LR), neural networks (NNet), Naive Bayes (NB), k-nearest neighbor (kNN), Support Vector Machine (SVM), boosting methods and other approaches [1, 2]. The methods are usually based on optimization problems comprised loss functions. While advanced methods minimize misclassi…cation not only using loss functions but also using the distance between di¤erent classes’inputs such as SVM, boosting methods classify inputs according to sum of some weak classi…ers [3].
Boosting is a general method to improve the performance of weak learners. Boosting algorithms are iteratively methods and the weak classi…ers are obtained in each iterations. Then, combining weak classi…ers is a way of determining the
Received by the editors: May 08, 2017, Accepted: June 27, 2017.
2010 Mathematics Subject Classi…cation. Primary 62G35, 62F40; Secondary 62F35. Key words and phrases. Boosting, Binary classi…cation, TangentBoost.
c 2 0 1 8 A n ka ra U n ive rsity C o m m u n ic a tio n s Fa c u lty o f S c ie n c e s U n ive rs ity o f A n ka ra -S e rie s A 1 M a t h e m a tic s a n d S t a tis tic s . C o m m u n ic a tio n s d e la Fa c u lté d e s S c ie n c e s d e l’U n ive rs ité d ’A n ka ra -S é rie s A 1 M a t h e m a tic s a n d S t a tis t ic s .
consistent loss function. After arguing that robust loss function should penalize both large positive and negative margin, they proposed a new loss function, Tangent loss, and a new boosting algorithm TangentBoost. Although the method is better one in object tracking, probabilities (p) assign class label improperly because of p 2 2 + :5;2 + :5 [10].
In this study, for TangentBoost algorithm, propensity score is rede…ned in order to get accurate weights and class labels properly. Section 2 reviewed binary classi-…cation, loss functions and concerned boosting methods in binary case. In Section 3, robust loss properties, Tangent loss function and the correction were given. In addition, importance of weights and class assign probabilities with the correction were showed. In Section 4, simulation results were given.
2. Boosting Algorithms in Binary Classification
Binary classi…cation is one of the most encountered methods in applications. Spam mail detection, pattern characterization, diagnosis, digit recognition, signal recognition are some application phases of binary classi…cation. The basic logic is to …nd classi…er that can assign observations to two classi…ers well according to inputs. Let consider g maps a inputs vector x 2 X to label y 2 f 1; 1g. The classi…er function f : X ! R is the predictor of class label by the way of g (x) = sign [f (x)]. Loss function is de…ned as below:
L (f (x) ; y) = L (f (x) y) ; f (x) 2 R; y 2 f 1; 1g (2.1) The predictor is g (x) = sign [f (x)] and f (x) > 0, case assigns to 1 and -1 oth-erwise. Combining information f (x) and y from the Equation (2.1), it is seen that f (x) y < 0 means misclassi…cation and f (x) y > 0 means accurate classi…cation. The quantity of f (x) identi…es the distance from the case to the classi…er. There-fore, minimizing Equation (2.1) is a¤ected not only misclassi…cation but also large margin from the classi…er. To get robust classi…er, loss functions, which also give penalty to large positive margin, have been investigated [8, 9].
Especially in boosting methods, minimizing loss function value is an important task. The most common loss functions are exponential loss and logistic loss that are de…ned as Equation (2.2) and Equation (2.3):
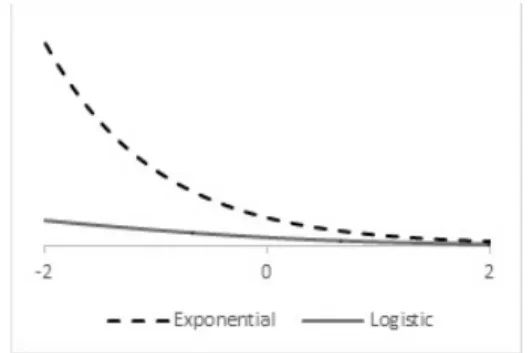
Figure 1. Exponential and Logistic Loss
LExp(y; f (x)) = exp ( f (x) y) (2.2)
LLog(y; f (x)) = log (1 + exp ( f (x) y)) (2.3)
Changing loss functions in the algorithms is a way of obtaining new boosting algorithm. The penalty values for misclassi…cation are changed by using di¤erent loss functions. For instance, exponential loss increases penalty values very rapidly than logistic loss though exponential and logistic losses grow unbounded. Logistic loss is also unbounded but its increase is not as rapid as the exponential loss. In addition, exponential loss gives less penalty values than logistic loss in accurate clas-si…cation, but both functions’penalty values for large positive loss value are zero. It is also examined in Figure 1. The mention di¤erences cause di¤erent weighting for training data. Using loss functions, lots of boosting algorithm are proposed. AdaBoost is popular and the …rst algorithm that could adapt to the weak learners (See [11] for algorithm and the method). LogitBoost was proposed similarly. The main di¤erence is that LogitBoost utilizes logistic loss to weight the data points, while AdaBoost utilizes exponential loss (See LogitBoost algorithm in [12]). On the other hand, unbounded increment of penalty value reveals the over…tting problem. Therefore, bounded loss functions and its boosting algorithms have been proposed in the few years [13, 14]. TangentBoost is an alternative loss function and the method has bounded loss function. In the next section, the algorithm and the correction on the algorithm are given.
3. TangentBoost and the Correction
Robust boosting algorithms obtain classi…ers without being a¤ected by outliers. In training data, some mislabeled (outliers) and contaminated observations may a¤ect the classi…er. It is usually pointed out that outliers may easily spoil classical boosting algorithms such as AdaBoost, RealBoost [15]. As a result, classi…ers can be improper and their generalization ability may not be good. To make classi…ers more stable, some researchers proposed robust boosting algorithms [13, 14, 16, 17, 18].
TangentBoost is also robust boosting algorithm that combines squared risk function and Tangent link function.
The idea behind TangentBoost algorithm is probability elicitation and condi-tional risk minimization [19]. The connection between risk minimization and prob-ability elicitation has been studied in [9]. The results showed that if maximal reward function has equality with the formula J ( ) = J (1 ) , the classi…er f is invertible and has symmetry f 1( v) = 1 f 1(v), then new link function and
reward function are a way of obtaining a new loss function by using Equation (3.1):
(v) = J f 1(v) 1 f 1(v) J0 f 1(v) (3.1)
After theoretical properties, from the tangent link (f ( ) = tan ( :5)) and the risk function C = 4 (1 ), tangent loss function is given in Equation (3.2)[9]:
(v) = 2tan 1(v) 1 1 (3.2)
Tangent loss function arranges more penalties to positive margin than the other loss functions. It is clear from the Figure 2, unlike classical loss functions; tangent loss function penalizes not only negative margin but also positive margin. Penalizing large positive margin limit the e¤ect of observations which are very far from classi…er though it is accurate classi…ed. TangentBoost algorithm is adapted with the similar way of LogitBoost (See LogitBoost codes in [20] and [21]). However, probability of class label is not proper because of p 2 2+ :5;2 + :5 in TangentBoost algorithm
[10]. To solve this problem, propensity scores are reduced to interval [0; 1] by using formula p = tantan 11((f ) tan1) tan 11(( 1)1) instead of p = tan 1(f ) :5. TangentBoost
algorithm with the correction is given as below [22].
In the algorithm, after initialization the values, weights and z(m)i are calculated by formula obtained Tangent loss function. In the second loop, reweighted least squares obtain the most important variable for the …rst iteration. Using the most important variable and its linear regression prediction, classi…er function, weights, propensity scores are updated. The algorithm continues during the iterations. After the last iteration, the classi…er function describes the class labels.
Probabilities for assigning class label, in another saying propensity scores, are limited to between zero and one with the correction. When the propensity score is around zero or one, it means class label of observation is clear and weight of
observation is around zero. That is, if propensity score is enough to de…ne class label, the weight starts to decline and concerning observation will not be very im-portant in the next iteration. On the other hand, if propensity score is around 0.5, observation is near to classi…er. As a result, the weights start to increase and the observation around the classi…er will be more important in the next iteration. Af-ter de…ning best variable for each iAf-teration via iAf-teratively reweighted least squares, then it is easy to …nd classi…ers for all iterations. At the end of the algorithm, sign of combining classi…er or the propensity scores decide class labels. Additionally, TangentBoost is one of the alternative boosting method that produce propensity score like logistic regression. Separating propensity scores more than two labels is aimed to obtain multiclass label [23]. The method becomes comparable to lo-gistic regression with the statistical correction on propensity scores. Furthermore, classifying observations will become more stable with the correction.
In summary, correction on TangentBoost can be good process to obtain classi…er that not been a¤ected by outliers in training data. In the simulation design, it will be seen how TangentBoost can obtain better classi…er than classical most-known methods in the presence of outliers and mislabeled data.
Algorithm: TangentBoost Algorithm with the correction on p
Inputs: Training data set D = f(x1; y1) ; (x2; y2) ; ; (xn; yn)g, where y is class
label f 1; 1gfor observations x and number M for weak learners. Initial Values:Class label probabilities 1(x
i) = :5 and the classi…er ^f1(x) = 0
Loop 1. m = 1; 2; ; M
Calculate the zi(m) and weights for all observations given formula below:
For label y = 1, zi(m)= ( 1) 1 + tan2( :5)
For label y = 1, zi(m)= 1 + tan2( :5)
For the weights, wi(m)= (m)(xi) 1 (m)(xi) , wi(m)= wi(m)
P wi(m)
Loop 2.
Minimize LS problem below to select the most important variable with the given equation where hq (xi)im= P iwi(m)q (xi) for each k = 1; 2; ; K. a k =h1iwh k(xi)ziiw h k(xi)iwhziiw h1iwh 2k(xi)iw h k(xi)i 2 w b k= h k(xi)2iwhziiw h k(xi)iwh k(xi)ziiw h1iwh 2k(xi)iw h k(xi)i2w End of Loop 2.
Obtain important variable k given formula: k = arg min k P i wi(m) zi a k k(xi) b k 2
Obtain classi…er and also probability score for all observation ^ f(m+1)(x i) = ^f(m)(xi) + a k k(xi) + b k (m+1)(x i) = tan 1(f^(m)(x i)) tan 1( 1) tan 1(1) tan 1( 1) End of Loop 1.
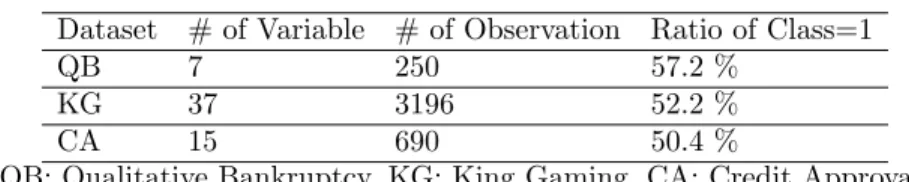
[25], qualitative bankruptcy [26] and credit approval datasets [27]. There is some basic information about datasets in Table 1.
Two of dataset’s labels are completely separable from each other’s. However, there is only one set, credit approval, which has a linearly inseparable data structure. These datasets were included to vary number of observations, number of variables and class label proportions.
Table 1. Some Information about Real Dataset Example Dataset # of Variable # of Observation Ratio of Class=1
QB 7 250 57.2 %
KG 37 3196 52.2 %
CA 15 690 50.4 %
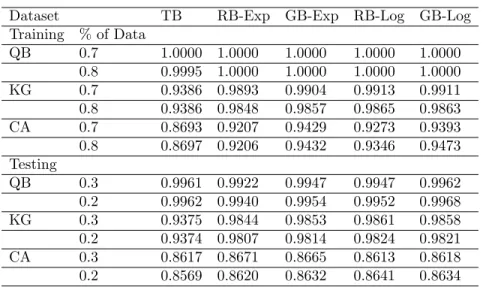
QB: Qualitative Bankruptcy, KG: King Gaming, CA: Credit Approval In Table 2, when training part is 70% and 80% of data, when number of itera-tion is 40, means of overall accuracy in both training and testing parts are given for 250 repetitions. TangentBoost algorithm had similar results in training and testing part for all datasets. There were not any dramatically decreasing from training to testing accuracy scores. On the other hand, while all other boosting algorithm gave impressive result for completely separable datasets, there were not any signi…cant di¤erences between classical algorithms and TangentBoost in testing accuracy scores. Moreover, there were dramatically decreasing all classical boosting algorithms’ scores from training datasets to testing datasets while there was not any di¤erences in TangentBoost algorithm. To summarize the results, Tangent-Boost will not useful in completely separable dataset without mislabeling while the method may be useful almost separable data. Accuracy results of classical boosting methods easily decreased in testing data when the training data are not completely separable. Logistic and exponential loss functions are incapable to preserve stability of general accuracy rate in CA testing data as seen from Table 2 .
To clarify the robustness of TangentBoost in the presence of mislabeled observa-tions, di¤erent proportions of mislabeled observations were obtained on qualitative bankruptcy and credit approval datasets. In Table 3, when training part is 70%, when number of iteration is 40, means of overall accuracy in testing parts are given
Table 2. Mean of the Overall Accuracy in Real Datasets for Tan-gentBoost and some Classical Boosting Methods
Dataset TB RB-Exp GB-Exp RB-Log GB-Log
Training % of Data QB 0.7 1.0000 1.0000 1.0000 1.0000 1.0000 0.8 0.9995 1.0000 1.0000 1.0000 1.0000 KG 0.7 0.9386 0.9893 0.9904 0.9913 0.9911 0.8 0.9386 0.9848 0.9857 0.9865 0.9863 CA 0.7 0.8693 0.9207 0.9429 0.9273 0.9393 0.8 0.8697 0.9206 0.9432 0.9346 0.9473 Testing QB 0.3 0.9961 0.9922 0.9947 0.9947 0.9962 0.2 0.9962 0.9940 0.9954 0.9952 0.9968 KG 0.3 0.9375 0.9844 0.9853 0.9861 0.9858 0.2 0.9374 0.9807 0.9814 0.9824 0.9821 CA 0.3 0.8617 0.8671 0.8665 0.8613 0.8618 0.2 0.8569 0.8620 0.8632 0.8641 0.8634
QB: Qualitative Bankruptcy, KG: King Gaming, CA: Credit Approval TB: TangentBoost RB-Exp: RealBoost with exponential loss; GB-Exp: GentleBoost with exponential loss RB-Log: RealBoost with logistic loss; GB-Log:
GentleBoost with logistic loss
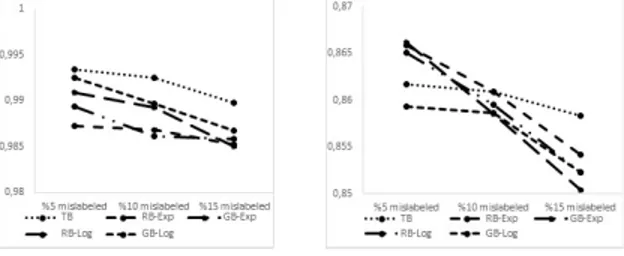
for 250 repetitions. TangentBoost was better than the methods in the presence of mislabeled observations in testing part as seen in Table 3 and Figure 3.
Table 3. Mean of the Overall Accuracy in Real Datasets for Tan-gentBoost and some Classical Boosting Methods in the presence of mislabeled data
Dataset TB RB-Exp GB-Exp RB-Log GB-Log
Training % of mislabeled QB 0.05 0.9934 0.9873 0.9909 0.9894 0.9925 QB 0.10 0.9925 0.9869 0.9893 0.9861 0.9897 QB 0.15 0.9898 0.9852 0.9850 0.9858 0.9867 CA 0.05 0.8617 0.8659 0.8662 0.8651 0.8593 CA 0.10 0.8609 0.8609 0.8585 0.8595 0.8586 CA 0.15 0.8583 0.8542 0.8504 0.8523 0.8523
QB: Qualitative Bankruptcy, CA: Credit Approval
TB: TangentBoost RB-Exp: RealBoost with exponential loss; GB-Exp: GentleBoost with exponential loss RB-Log: RealBoost with logistic loss; GB-Log:
Figure 3. Accuracy scores of the methods according to mislabeled proportion (Left).Quality Bankruptcy testing data (Right).Credit Approval testing data
5. Results
In this study, TangentBoost algorithm is given with a correction. Outliers or contaminated part in training data may be problem in boosting algorithm. Espe-cially, outliers in boosting algorithms can in‡uence weak classi…ers very easily. To overcome this problem, robust boosting algorithms are e¤ective methods. Tangent-Boost with the correction is quite useful if there are outliers or contaminated part near the classi…er in almost linearly separable data.
References
[1] Duda, R. O., Hart, P. E. and Stork, D. G. Pattern classi…cation. 2nd. Edition. New York, 2001.
[2] Fan, L., and Yang, Y. A loss function analysis for classi…cation methods in text categorization. Proc. ICML,(2003), 472-479.
[3] Schapire, R. E., MSRI Workshop on Nonlinear Estimation and Classi…cation,The Boosting Approach to Machine Learning An Overview, 2002.
[4] Masnadi-Shirazi, H., Mahadevan, V., and Vasconcelos, N. (2010). On the design of robust classi…ers for computer vision. In Computer Vision and Pattern Recognition (CVPR), (2010) IEEE Conference on (pp. 779-786).
[5] Debruyne, M. Robust Support Vector Machine Classi…cation, Leuven Statistical Day,(2008). [6] Ma, Y., Li, L., Huang, X. and Wang, S. . Robust Support Vector Machine Using Least Median
Loss Penalty, Proceedings of the 18th IFAC World Congress, (2011).
[7] Wu, Y., Liu, Y. Robust Truncated-Hinge-Loss Support Vector, Journal of the American Statistical Association, (2007)Vol. 102, No. 479.
[8] Huang, X., Shi, L., and Suykens, J. A., Support vector machine classi…er with pinball loss. IEEE transactions on pattern analysis and machine intelligence, (2014), 36(5), 984-997. [9] Masnadi-Shirazi, H. The Design Of Bayes Consistent Loss Functions For Classi…cation,
Uni-versity of California, Phd Dissertation, San Dieago, 223 p, 2011.
[10] Kobetski, M. and Sullivan. J. Improved Boosting Performance by Exclusion of Ambiguous Positive Examples. In ICPRAM, (2013).
[11] Freund, Y., and Schapire, R. E. A desicion-theoretic generalization of on-line learning and an application to boosting. In European conference on computational learning theory,(1995),(pp. 23-37), Springer Berlin Heidelberg,
[12] Friedman, J., Hastie, T., and Tibshirani, R. Additive logistic regression: a statistical view of boosting (with discussion and a rejoinder by the authors). The annals of statistics, (2000), 28(2), 337-407.
[13] Sano, N., Suzuki, H., and Koda, M., A robust boosting method for mislabeled data. Journal of the Operations Research Society of Japan, (2004), 47(3), 182-196.
[14] Miao, Q., Cao, Y., Xia, G., Gong, M., Liu, J., and Song, J. , RBoost: label noise-robust boost-ing algorithm based on a nonconvex loss function and the numerically stable base learners. IEEE transactions on neural networks and learning systems, (2016), 27(11), 2216-2228. [15] Kanamori, T., Takenouchi, T., Eguchi, S., and Murata, N., The most robust loss function for
boosting, In Neural Information Processing, (2004), 496-501, Springer Berlin/Heidelberg. [16] Rosset, S., Robust boosting and its relation to bagging, In Proceedings of the eleventh ACM
SIGKDD international conference on Know ledge discovery in data mining, (2004), pp. 249-255.
[17] Freund, Y., A more robust boosting algorithm, arXiv preprint arXiv:0905.2138, (2009). [18] Kanamori, T., Takenouchi, T., Eguchi, S., and Murata, N., Robust loss functions for boosting.
Neural computation, (2007), 19(8), 2183-2244.
[19] Savage, L. J. The Elicitation of Personal Probabilities and Expectations, Journal of American Statistical Association,(1971), 66:783-801.
[20] Dettling, M., and Bauhlmann, P., Boosting for tumor classi…cation with gene expression data. Bioinformatics, (2003), 19(9), 1061-1069.
[21] Tuszynski, J., http://svitsrv25.ep‡.ch/R-doc/library/caTools/html/LogitBoost.html, 2013. [22] Toka, O., Gudermannian Loss Function and Gudermannian Binary Classi…cation
Method,Hacettepe University PhD Thesis, 2016.
[23] Ocal, N., Ercan, M. K., and Kadioglu, E. Corporate Ratings and a Model Proposition for the Manufacturing Industry at Borsa Istanbul. International Journal of Financial Research, (2015), 6(3), 13.
[24] Lichman, M., UCI Machine Learning Repository [http://archive.ics.uci.edu/ml]. Irvine, CA: University of California, School of Information and Computer Science, 2013.
[25] Shapiro, A. D., Structured Induction in Expert Systems Addison, Wesley. This book is based on Shapiro’s Ph.D. thesis at the University of Edinburgh entitled "The Role of Structured Induction in Expert Systems". 1987.
[26] Asuncion, A., and Newman, D.J., UCI Machine Learning Repository. Irvine, CA: University of California, School of Information and Computer Science, 2007.
[27] Quinlan, R., Simplifying decision trees, International Journal Man-Machine Studies, , (1987), 27, pp. 221-234.