Economic Growth Accelerates in the Last Quarter
Z¨umr¨ut ˙Imamo˘glu† ve Barı¸s Soybilgen‡
Executive Summary
In order to monitor and analyze the changes in the Turkish economy on a regular basis, Betam tracks selected monthly indicators of economic ac-tivity in Turkey. Because most indicators are still not released as seasonally adjusted by the statisti-cal agency, TurkStat, Betam seasonally adjusts these series as needed. Betam uses these monthly indica-tors in making real-time forecasts for quarterly GDP growth. Our forecasts and a summary of monthly economic activity in Turkey are updated and pub-lished every month starting January 2011 under the section “Monthly Economic Outlook and Forecasts” on our website. This report stands as the first of those in the series.
Using the latest monthly data released last week on November indicators, Betam expects the real GDP to grow by 2.2 percent in the last quarter. This amounts to a 8.7 percent annual growth for 2010 overall. Starting from the first quarter, the economy had grown by 0.5, 3.5 and 1.1 percent quarterly in 2010, respectively.
In the coming months we will be watching closely the effects of the Central Banks’s new policy mix on the economy. The big question is whether this pol-icy, a decrease in the policy rate coupled with an in-crease in reserve requirements, will actually achieve the monetary contraction that the Central Bank is hoping for in order to contain inflation while mak-ing Turkey a less desired destination for short term
†
Dr. Z¨umr¨ut ˙Imamo˘glu, Betam, Research Associate. zumrut.imamoglu@bahcesehir.edu.tr
‡
Barı¸s Soybilgen, Betam, Research Assistant. baris.soybilgen@bahcesehir.edu.tr
capital inflows that threaten financial stability and appreciate the Turkish Lira. To the degree that it achieves the purpose, the policy mix can have an adverse effect on GDP growth. However, a failure might drive the current account deficit up to unsus-tainable levels as well as increase inflation. Turkey’s current account deficit has reached 41,6 billion dol-lars in November and we expect the year-end figure to be 6.1 percent of the GDP.
Selected Monthly Indicators
Table 1 lists the monthly indicators and show per-centage changes in the fourth quarter.1 A high in-crease in almost all indicators are observed in Oc-tober followed by small declines in November. De-cember figures of some indicators are still not re-leased yet. We use our forecasts of these variables in calculating quarterly changes.2 The fourth quar-ter changes show an increase from the third quarquar-ter suggesting acceleration in the real GDP growth in this quarter.
Looking closer to hard data, the Industrial Pro-duction Index (IPI), and exports decreased by 1.3 and 3.0 percent respectively in November compared to the previous month. The decrease came after sub-stantial increases in October and both production and exports still remained above September levels. Capacity Utilization Rate (CUR) increased by 3.4 percenatge points. Imports continued to increase but slowed pace. It only added 0.2 percent over the
1All indicators are real (or inflation adjusted) and
season-ally adjusted.
2The calculations are updated every month when the data
is released.
6.6 percent increase in October. Most of the change came from imports of consumption and investment goods.
Consumption Indicators
Durable and nondurable consumption goods produc-tion indices both decreased in November by 1.9 and 9.3 percent. Imports of consumption goods also de-clined, by about 2.9 percent. The Special Consump-tion Tax (SCT) increased in November by 1.5 per-cent (after adjusting for inflation) but slowed pace compared to October.
We expect all consumption indicators to increase in the fourth quarter. The last column of Table 1 shows the estimated quarterly changes. Only the ca-pacity utilization rate in durables and non-durables is already released and it increased 1.6 and 2.7 per-centage points, respectively.
Investment Indicators
Intermediate goods, one of the leading indicators for industrial production, had increased by 1.8 percent in the third quarter. In October and November, im-ports of raw materials continued its rise, increasing by 3.7 percent and 0.7 percent, respectively from the previous month.
Production of intermediate goods had slightly de-creased in the third quarter by 0.3 percent. But it increased both in October and November by 2.3 and 1.8 percent, respectively. The capacity utilization rate (CUR) for intermediate good production has also increased in both months. Overall, we expect an increase in intermediate good producton in the fourth quarter.
Imports and production of capital goods also show an acceleration in the fourth quarter.
Forecasts for 2010-Q4
Betam forecasts the seasonally adjusted real GDP growth from the third quarter to fourth quarter to be 2.2 percent. This amounts to a calendar adjusted 7.3 percent increase from the fourth quarter of 2009 to fourth quarter of 2010, and a 8.7 percent annual real GDP growth from 2009 to 2010. The year on year quarterly change in the third quarter was 6.3 percent (calendar adjusted).
Betam bases its forecasts on the monthly data summarized in Table 1. We update this table and our forecasts every month when the data is released and share it publicly.
IPI fully recovered, CUR is not back to its pre-crisis level yet
Figure 1 shows monthly changes of real and sea-sonally adjusted Capacity Utilization Rate (CUR) and Industrial Production Index (IPI) since January 2007. As shown in the figure, IPI nearly reached the highest point before the crisis which was in March 2008. On the other hand, CUR is way below the pre-crisis levels. CUR’s 2007 average was 80.2 per-cent. In December 2010, CUR reached 77.1 percent according to Betam’s seasonally adjusted numbers. Between December 2009 and December 2010, CUR increased 0.66 percentage point per month on aver-age. According to these numbers, we expect that the industry will stay below pre-crisis capacity uti-lization level for a few quarters more.
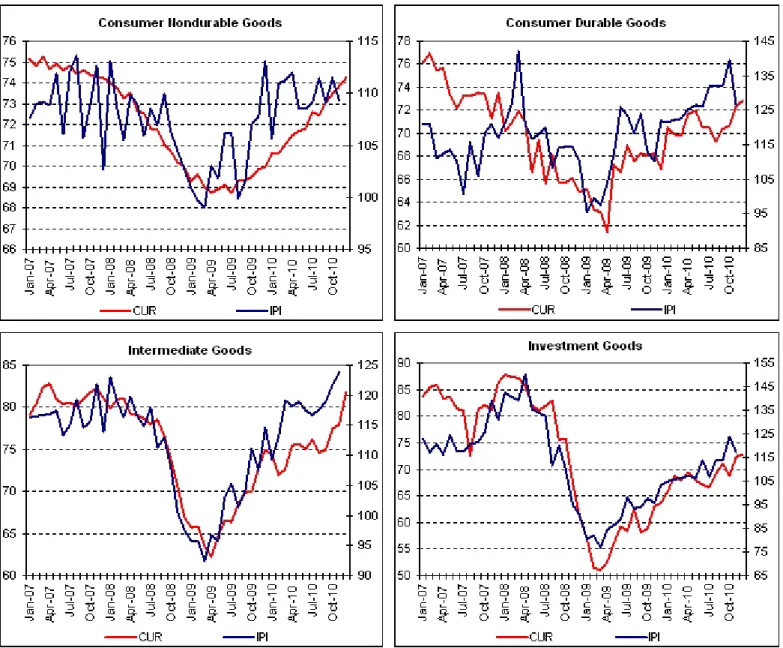
Figure 4 shows the monthly changes of real and seasonally adjusted IPI’s and CUR’s components. Investment goods manufacturing is far from recov-ery. However, intermediate goods manufacturing is fully recovered from the crisis and other sectors are close to a full recovery. In December, all the components of IPI except intermediate goods expe-rienced a decline. Durable, nondurable and invest-ment goods manufacturing fell 9.3, 1.9 and 5.4 per-cent, respectively. When we analyze the components of CUR, we see that none of the sectors have recov-ered yet. Among all the sectors intermediate goods manufacturing seems to be in the best situation. In November and December intermediate and invest-ment goods experienced the biggest increase. The sum of the two month increase in these sectors were 5.5 and 5.6 percentage points, respectively.
After the unexpected increase in October, exports fell in November
Figure 2 shows monthly changes of real and season-ally adjusted import and export volume indices. Be-tween November 2009 and November 2010, exports increased by 0.3 percent per month on average. On the other hand, the monthly average growth of im-ports was 2.4 percent. In October exim-ports raised 3.9 percent which is above the regular growth trend of
Figure 1: CUR ve IPI (real, calendar day corrected and seasoanlly adjusted, left axis for CUR and right axis for IPI)
Source: TurkStat, Betam.
exports, however in November exports fell 3 percent and nearly returned to the October level. The surge in imports since the recovery began slowed down in November. Although, in September, imports in-creased 6.6 percent, in November they inin-creased by 0.2 percent.
Figure 6 shows the monthly changes of real and seasonally adjusted imports of basic economic cat-egories. About 70% of Turkey’s imports are inter-mediate goods which includes oil and natural gas, though lately the surge in imports is caused by im-ports of investments and consumer goods. Between November 2009 and November 2010 imports of in-vestment goods, consumer goods and intermediate goods increased by 7, 2.2 and 1.4 percent per month on average respectively. After the high increase in October, imports almost stayed at the same level as in November. Imports of consumer goods decreased by 2.9 percent, while imports of intermediate goods and investment goods increased by 0.7 and 3 percent, respectively.
Figure 3 shows the monthly changes in exports for major manufacturing industries in Turkey. During the recession, the automobile industry had a large decrease in exports and is still way below the pre-crisis levels. Moreover, automobile industry expe-rienced a decline both in October and November,
Figure 2: Volume indices of exports and imports (real, calendar day corrected and seasoanlly ad-justed)
Source: TurkStat, Betam.
also machine and equipment sector experienced a similar decline in the last two months. In the last months, textile and clothing goods sectors had a volatile course and it’s likely to remain that way.
Figure 5 shows the export performance of all manufacturing sectors in October and November. Mainly exports of manufacturing sectors declined in November. The largest fall was observed in the metal industry, automobile industry and tabacco in-dustry followed. Because the automobile inin-dustry and the metal industry are among the biggest ex-porters, the fall in these sectors pushed the monthly growth of aggregate exports to the negative values in November.
Real GDP growth is expected to slow down in 2011
In 2010, economic growth in the Turkish Economy was driven by a surge in the internal demand while external demand remained weak due to the global crisis. As a result, the current acount deficit in-creased substantially. Last month, the Central Bank of Turkey announced that the current account deficit was worrisome and posed a threat to financial sta-bility in the country. As a result the Central Bank announced a new policy mix to curb the excessive
Figure 3: Monthly changes of important industries’ exports (real, calendar day corrected and seasoanlly adjusted, million $)
Source: TurkStat, Betam. Each component of exports are transformed into real series by using TUIK’s price index of the corresponding component and then it is seasonally adjusted.
short term capital flows to Turkey, in order to de-crease the current account deficit.
In the first quarter of 2011, we will be watching for the effects of the Central Banks new policy on the economic activity. If the policy, an interest rate cut coupled with an increase in banks’ reserve re-quirements, causes a monetary contraction, as the Central Bank hopes, consumption and investment demand will fall, depressing the internal demand. As long as Europe’s demand for imports stays weak, Turkey’s exports cannot increase substantially in the short-run. Therefore, the growth rate of real GDP might decrease substantially in 2011.
However, if the Central Bank’s policy cannot be successful in reducing internal demand, then the cur-rent account deficit can reach unsustainable levels. Moreover, inflation, which is already off the 2011 tar-get, might start to increase.3 Of course, we have to
note that the Central Bank cannot hope for much help from the government in terms of a tight fiscal policy since elections are going to be held mid-June in 2011. The critical point for the Turkish economy next year will be achieving a growth rate that will
3Inflation in 2010 was 6.48% which was in line with the
target. The 2011 target is set to be 5.5%.
not cause inflationary pressures and keep the current account deficit at reasonable levels.
Table 1: Monthly and quarterly percentage changes of selected economic indicators, 2010 October November December Quarter III Quarter IV Hard Data
Industrial production index (IPI) 3,1 -1,3 1,4 3,2*
Capacity utilization rate (CUR) 1,2 1,6 2,1 -0,8 3,4
Intermediate goods import 3,4 0,7 1,8 5,3*
Consumer goods import 13,6 -2,9 8,9 10,4*
Investment goods import 18,7 3,0 10,5 21,2*
SCT 5,2 1,5 3,9 5,7*
Automobiles 7,7 -6,8 1,7 9,2*
IPI Detail
Nondurable consumer goods 2,2 -1,9 0,2 0,5*
Durable consumer goods 5,5 -9,3 4,8 0,7*
Intermediate goods 2,3 1,8 -0,3 4,2*
Investment goods 8,7 -5,4 2,1 8,3*
CUR Detail
Nondurable consumer goods 0,6 0,5 0,5 1,5 1,6
Durable consumer goods 0,4 2,4 0,6 -1,9 2,7
Intermediate goods 3,3 0,8 4,6 -0,2 5,0
Investment goods -3,3 5,2 0,4 1,3 3,5
Soft Data
Consumer confidence index (TurkStat) 0,1 2,7 2,5 2,8
Real sector confidence index 5,3 2,7 1,5 -0,7 9,6
Financial Data
˙IMKB 6,9 1,2 -3,8 4,8 9,8
Source: TurkStat, TCMB, IMKB, Betam
Table 2: Betam’s quarterly and annual growth rate forecasts (real, seasoanlly adjusted) Betam’s quarterly real GDP growth rate forecast (from 3rd quarter to 4th quarter) 2.2
Betam’s annual real GDP growth rate forecast (2010) 8.7
∗
For some indicators December data are not yet released by TurkStat. Betam uses its monthly forecasts for these variables in its calculations for quarterly forecasts. Whenever the actual data is released, Betam updates its calculations and forecasts accordingly. The 4th quarter values thus reflect the changes from the third quarter based on these calculations.
Figure 4: Monthly changes of CUR’s and IPI’s components
Figure 5: Monthly changes of manufacturing industry exports, October 2010 and November 2010
Figure 6: Monthly changes of imports’ components