(ELPUB).
Consortial Use of Electronic Journals in Turkish Universities
Yaşar Tonta; Yurdagül Ünal
Department of Information Management, Hacettepe University 06800 Beytepe, Ankara, Turkey
e-mail: {tonta, yurdagul}@hacettepe.edu.tr
Abstract
The use of electronic journals has outnumbered that of printed journals within the last decade. The consortial use of electronic journals through publishers’ or aggregators’ web sites is on the rise worldwide. This is also the case for Turkey. The Turkish academic community downloaded close to 50 million full-text articles from various electronic journal databases since the year 2000. This paper analyzes the seven-years’ worth of journal use data comprising more than 25 million full-text articles downloaded from Elsevier’s ScienceDirect (SD) electronic journals package between 2001 and 2007. Some 100 core journals, constituting only 5% of all SD journal titles, satisfied over 8.4 million download requests. The lists of core journals were quite stable, consistently satisfying one third of all demand. A large number of journal titles were rarely used while some were never used at all. The correlation between the impact factors (IFs) of core journal titles and the number of downloads therefrom was rather low. Findings can be used to develop better consortial collection management policies and empower the consortium management to negotiate better deals with publishers.
Keywords: electronic journals; consortial use of electronic journals; core journal titles; Turkish universities; Bradford Law of Scattering; ScienceDirect.
1. Introduction
Scientific journals are one of the major information sources of library collections. Currently, some 25,000 refereed journals are being published world-wide. Libraries spend about two thirds of their budgets for the subscription to and licensing of scientific journals and make them available online. Consortial agreements signed between libraries and publishers/aggregators enable users to get access to electronic journals through the Internet. Users can easily download the full-texts of articles that appear in thousands of electronic journals. Yet, the great majority of articles downloaded by the users tend to get published in a relatively small number of “core journals” in each field. Those core journals can easily be identified by means of an analysis of COUNTER-based use data.
Studies based on such analyses of empirical journal use data are scarce in Turkey. This paper attempts to identify the most frequently used core journals by Turkish academic users. Our analysis is based on data of more than 25 million full-text articles downloaded by Turkish universities from Elsevier’s ScienceDirect (SD) electronic journal package over a seven-year period (2001-2007), making it perhaps one of the most comprehensive electronic journal use studies carried out on a national scale. The volume of data enables us to identify the core journals as well as to determine their stability over the years. Findings can be used to develop better collection management policies and improve the conditions of the national consortial license for Turkish universities.
2. Universities and Consortium Development in Turkey
As of 2008, the total number of universities in Turkey is 115. Most (85) are state-sponsored. The tertiary education system is governed by the Higher Education Act of 1981. The Higher Education Council (YÖK), consisting of members from universities and outside interests, is the policy-making body for all universities including private/foundational ones. The selection and admission of students takes place through a national entrance exam administered by a center (ÖSYM) under the authority of YÖK. The total number of students enrolled in the higher education system (including students in the distance education and vocational programs) was 2,453,664 in the 2006/2007 academic year. The number of graduate students was rather low: 108,653
Proceedings ELPUB2008 Conference on Electronic Publishing – Toronto, Canada – June 2008
master’s, 33,711 Ph.D. students. More than half (54.5%) of all undergraduate students study social sciences. The rest study technical sciences (17.3%), math and sciences (10%), medicine (9%), language and literature (4%), agriculture and forestry (3.2%), and arts (2%) [1, 2]. The number of faculty in the 2006/2007 academic year was 89,319 (12,773 professors, 6,150 associate professors, 15,844 assistant professors, and 54,562 research assistants, specialists, and others) [3].
The National Academic Network and Information Center (ULAKBİM) of the Turkish Scientific and Technological Research Center (TÜBİTAK) was founded in 1996 to set up a national academic and research network and use it as a testbed to share precious information resources among university libraries. In addition, ULAKBİM aimed to provide access to electronic information sources and services by signing national site licenses with publishers on behalf of all Turkish universities. In fact, the first experience of the Turkish universities with electronic journals dates back to the second half of 1990s following the establishment of ULAKBİM. On November 14, 1997, ULAKBİM organized a day-long meeting for university library directors and their superiors (i.e., vice-rectors overseeing libraries) and presented its views on setting up a consortium for university libraries to cooperate and share electronic resources as stated in its by-law. In 1998, ULAKBİM offered the first trial databases to universities [4]. However, ULAKBİM’s priorities had changed due to financial and administrative difficulties experienced at that time and the Center was not able to immediately carry out some of its duties (one of which was to set up a consortium) as specified in its foundational by-law. Thus, ULAKBİM could not live up to the expectations of the potential members of the consortium, namely university libraries, in its formative years.
Meanwhile, a few university libraries signed joint licensing projects with publishers in 1999 and 2000. Following this, the Consortium of Anatolian University Libraries (ANKOS) was created in 2001 as a voluntary association run by a nine-member Steering Committee. ANKOS developed the Turkish National Site License (TRNSL) document and member libraries began to sign agreements with publishers to get access to electronic journals and bibliographic databases [5, 6]. These initial agreements were “mostly informal subscription arrangements” for printed journals including access to electronic copies thereof. In 2004, ANKOS began to sign multi-year consortial licenses to get access to the electronic copies of journals (excluding their printed equivalents) [7, 8]. Thanks to the indefatigable efforts of ANKOS, several universities, especially the newly-established ones, provided access to electronic journals for the first time through such licenses. Some universities did not even have any sizable journal collections at that time.
As more university libraries joined ANKOS over the years, the number of databases offered and their use has increased tremendously. ANKOS currently has some 90 members including a few non-university entities. ULAKBİM has also been a member of ANKOS from the very beginning. As of 2008, ANKOS licenses a total of 30 packages of electronic journals and books. Some of those packages are as follows: Blackwell’s, Ebrary, Emerald, Gale, Nature Publishing Group, Proquest, Sage, ScienceDirect (SD) e-books, Wiley Interscience, and journal packages offered by professional associations such as ACM, ACS, ALSPS, and SIAM. The number of licensees for each package ranges between 4 (Elsevier’s MD Consult) and 74 universities (Oxford University Press), average being 24 universities [9].
Apparently it took ULAKBİM longer than anticipated to convince TÜBİTAK to allocate resources to provide access to electronic journals and books on a national scale [10]. After a precious loss of about seven years, ULAKBİM came into scene once again in 2005. Having secured funds (apparently) from the European Union (EU), TÜBİTAK’s Science Council authorized ULAKBİM, in late 2005, to sign national site licenses with publishers covering potentially all universities. This authorization enabled ULAKBİM to make electronic databases available to all Turkish universities and research centers through its National Academic License of Electronic Resources (EKUAL) starting from 2006 [11].
The first package offered to universities on a national scale through ULAKBİM’s EKUAL has been ISI’s (now Thomson Scientific) Web of Science (WoS) [12]. The coverage of EKUAL has been expanded in February 2006 so as to include training and research centers of public hospitals under the administration of the Ministry of Health. EKUAL currently has 105 member universities and research centers as well as 48 hospitals. As of early 2008, ULAKBİM offers 11 electronic databases to universities and research centers. These databases are as follows: BMJ Clinical Evidence, BMJ Online Journals, CAB, EBSCOHost, Engineering Village 2, IEEE, Journal Citation Reports (JCR), Ovid-LWW, ScienceDirect, Taylor & Francis, and the Web of Science. Some databases are offered to all members (e.g., Thomson Scientific’s WoS and JCR databases, and Elsevier’s SD) while others depend on the number of members requesting access (for instance, almost 90 members requested access to the Engineering Village 2 and IEEE databases while 31 members preferred access to the CAB database). In addition to the above databases, all 48 hospitals get access to the following databases through
ULAKBİM’s EKUAL: Blackwell Synergy, Embase, ScienceDirect Health Sciences, Springer, The Cochrane Library, Wiley Interscience, and Xpharm [13].
In addition to ANKOS and ULAKBİM, the Associaton of University and Research Libraries (ÜNAK) also took part in consortial licensing of electronic resources starting from 2001. The ÜNAK-OCLC Consortium provides access to OCLC’s databases such as First Search, WorldCat and the Net Library [14]. The number of licensees ranges between 5 and 24. Non-OCLC databases are apparently outside the realm of the ÜNAK-OCLC Consortium.
Some 12 million full-text journal articles or book chapters were downloaded in 2007 by the Turkish academics from various databases [15]. Downloads from Elsevier’s SD usually constitute more than half the total.
3. Literature Review
Libraries sign agreements with publishers for “big deals”. Publishers provide a set of journals as part of the big deal package. In the early days, this approach was embraced readily by the university libraries because it was attractive for users to perform a cross-search and get access to the full-texts of articles regardless of whether their library subscribed to that title earlier. Yet, some of the journal titles provided in the big deal agreements are not necessarily the most frequently used ones. Paying license fees for marginal journal titles embedded in the big deals tends to increase the total license fees to a certain extent and limits the choices of libraries, not to mention the possible overlap of journal titles offered by different publishers and aggregators. To support the license fees of the big deals libraries ought to cut some of their subscriptions to journals that are used perhaps more frequently. Big deals are therefore increasingly being criticized in recent years because of monopoly, price hikes, and the inclusion of journals that may not be at the top of the priority lists of libraries [16, 17, 18]. Some universities in the United States therefore rejected the big deals and negotiated new agreements with publishers. For instance, Cornell University agreed to identify journal titles from a package and only include them as part of the license agreement with Elsevier [19]. Gatten and Sanville [20] analyzed the download data to identify the use patterns of journal titles within a big consortium (OhioLINK). They wondered if the rarely used journal titles within a consortial big deal package can be dropped from the subsequent years’ negotiations without undermining the use of one or more consortium members, thereby making the big deal more cost effective. They showed that an orderly retreat (i.e., title-by-title elimination of rarely used titles) “based on the ranking of articles-downloaded aggregated across member institutions appears to be a reasonable method to employ if needed. . . . An effective orderly retreat means consortia have the ability to manage a Big Deal based on a ‘cost for content’ approach.”
It may sometimes be more economical for a library to pay-per-view rather than sign a big deal agreement, especially if the use is not that great ([21, 22]; see also [17] . It should be noted that the big deal publishers seem to soften their stand on “all or nothing” approach and some of them allow libraries to pick the titles they want out of a big deal package.
One way for the libraries to find out if the electronic journals licensed are used or not is to conduct use studies. Findings of such studies empower library administrators and enable them to develop better collection management policies [23, 24]. Especially studies of cost-benefit analysis are noteworthy [25, 26, 27].
Use analyses based on SD database of electronic journals are not that many [28, 29, 30, 31]. In general, core journals satisfied large percentage of requests [28, 29, 32, 33]. For instance, half the use of the Middle East Technical University (METU), a leading Turkish university, is satisfied by 136 core journals. One third of all journals satisfied 86% of all need [25, p. 73].
Evans and Peters [34] analyzed the aggregated use of more than 100 business and management journals included in the Emerald Management Xtra (EMX) collection and tested if the dispersal of some 6,4 million articles downloaded in 2004 by the “big deal” users fitted the “80/20 rule” or Pareto principle. They found that the most frequently used 15 journals satisfied 36.7% of all download requests and the download data did not conform to the 80/20 rule: 47.4% of journals satisfied the 80% of download requests. Aggregated use of the members of the Consortium of University Libraries of Catalonia (CBUC) of, among others, EMX collection (formerly MCB) between 2001 and 2003 displayed a similar trend: 46.2% journals satisfied 80% of more than 200 thousand download requests [35].
There are studies that test the relationship between some bibliometric indicators such as the journal impact factor (IF), half life, total number of citations and the number of use (downloads) [32, 36, 37, 38, 39, 40]. Some studies report the existence of such a statistically significant relationship between the use based on bibliometric
Proceedings ELPUB2008 Conference on Electronic Publishing – Toronto, Canada – June 2008
indicators and that of download data ([39], p. 36; [40], p. 319) while others do not [36, 41, 42]. Darmoni, Roussel, Benichou, Thirion, and Pinhas [43] defined a new measure called the “Reading Factor” (RF), “the ratio between the number of electronic consultations of an individual journal and the mean number of electronic consultations of all the journals studied” (p. 323) and compared the RF and IF values for 46 journals. They reported no correlation “between IF and electronic journal use as measured by RF” (p. 325).
Although such findings can be used in collection management to some extent, the use of electronic journals cannot be explained by a single factor such as journal IFs or RFs. Bollen, Van de Sompel, Smith and Luce [44] developed a taxonomy of impact measures based on journal usage data that includes frequentist author-based (i.e., IF) and based (i.e., RF) measures as well as structural author-based (i.e., webometrics) and reader-based measures. Recently, Bollen and Van de Sompel [45] examined the effects of the community-reader-based characteristics such as the total student enrollment and the size of the discipline in terms of the number of journals on journal usage. They defined a journal Usage Impact Factor (UIF) mimicking ISI’s IF. They then used the two-years’ worth of download data obtained from the 23-campus California State University to rank journals on the basis of UIFs. They reported a negative correlation between UIF and ISI’s IF values in general. No correlation was found for most disciplines between UIF and IF values. However, UIF and IF correlations “seemed to be related to the ratio between the sizes of the undergraduate and graduate community in a discipline.” (p. 146)
Studies based on the MESUR database containing large volumes of usage and citation data will shed new lights on the relationship between use-based measures and the community- or subject-based characteristics of journal use. Developed by Bollen and his colleagues, the database contains usage data spanning 100,000 journals and citation data spanning 10,000 journals for 10 years. In addition the database has “publisher-provided COUNTER usage reports that span nearly 2000 institutions worldwide. . . . MESUR is now producing large-scale, longitudinal maps of the scholarly community and a survey of more than 60 different metrics of scholarly impact.” [46]
4. Methodology
Data used in this paper come from the ScienceDirect (SD) Freedom Collection of electronic journals database of Elsevier. SD contains the full-texts of some 8 million articles published in more than 2,000 journals. The SD Freedom Collection provides access to the contents of both subscribed and non-subscribed Elsevier journals with “dynamic linking to journals from approximately 2,000 STM publishers through CrossRef” [47].
The seven-years’ (2001-2007) worth of COUNTER-based download statistics of Turkish universities from Elsevier’s SD database were obtained from the publisher. The number of full-text articles downloaded from each journal by each university was recorded. The analysis was based on more than 25 million articles downloaded from over 2,000 Elsevier journals. Most frequently used “core” journal titles were identified. Tests were carried out to see if the distribution of downloaded articles to journal titles conformed to the Bradford’s Law of Scattering, the 80/20 rule and the Price Law. Using ISI citation data (Journal Citation Reports 2006), the correlation between the journal impact factors (IFs) of core journal titles and their use based on the number of downloads was calculated to see if journals with high IFs were also used heavily by the Turkish academic community. What follows is the preliminary findings of our study.
5. Findings and Discussion
Turkish academic users downloaded a total of 25,145,293 full-text articles between 2001 and 2007 from 2,097 different journals included in Elsevier’s SD database [48]. Two-thirds of those articles were downloaded over the last three years (2005-2007) (Fig. 1). March and December are the most heavily used months of the year while the number of downloads appears to decrease considerably during the summer.
5,843,049 (est.) 5,652,780 5,264,423 4,575,094 1,362,934 810,203 3,346,381 0 1.000.000 2.000.000 3.000.000 4.000.000 5.000.000 6.000.000 7.000.000 2001 2002 2003 2004 2005 2006 2007 Year N u mb er o f d o w n load ed ar ti cl es
Note: The number of use in the last quarter of 2007 was estimated according to the average rate of increase (70.67%) of the last four years (2003-2006).
Figure 1. Number of full-text articles downloaded from ScienceDirect (2001-2007)
Table 1 shows the frequencies and percentages of journal titles satisfying one third, two third, and all requests downloaded between 2001 and 2007 as well as on an annual basis. Based on data presented in Table 1, Figure 2 shows the annual distributions of journal titles by regions (i.e., percentage of journal titles satisfying one third, two third and all download requests). The first one third of all download requests (some 8.4 million articles) were satisfied by 105 “core” journals, constituting a mere 5% of all journal titles. The second one third were satisfied by 273 journals (12.9% of all journal titles). In other words, 378 journal titles (some 18% of all journal titles within SD) satisfied two thirds of all download requests. The last one third of requests were satisfied by 1,719 rarely used journals (82.1% of all SD journal titles).
When the download statistics were analyzed on an annual basis for seven years, the pattern of use of core journals did not change much: on the average about 90 core journal titles invariably satisfied one third of all download requests each year (77 journal titles in 2001, 83 in 2002, 95 in 2003, 103 each in 2004 and 2005, 92 in 2006, and 93 in 2007) (Table 1). Percentage of core journal titles ranged between 4.6% (2007) and 6.2% (2001) of all SD journals. The use patterns of moderately and rarely used journal titles did not fluctuate much, either: percentage of moderately used journal titles ranged between 12.8% (2007) and 16.7% (2001) while the rarely used ones constituted the overwhelming majority (77% in 2001 and 82.6% in 2007) of all SD journals.
Table 1. Distribution of journals by regions Number of journals 2001-2007 2001 2002 2003 2004 2005 2006 2007 Region N % N % N % N % N % N % N % N % 1 105 5.0 77 6.2 83 5.2 95 5.7 103 5.8 103 5.5 92 4.8 93 4.6 2 273 12.9 206 16.7 225 14.1 255 15.4 271 15.2 274 14.6 262 13.7 257 12.8 3 1,719 82.1 950 77.0 1,292 80.8 1,304 78.8 1,409 79.0 1,498 79.9 1,553 81.4 1,663 82.6 Total 2,097 100.0 1,233 99.9 1,600 100.1 1,654 99.9 1,783 100.0 1,875 100.0 1,907 99.9 2,013 100.0
Proceedings ELPUB2008 Conference on Electronic Publishing – Toronto, Canada – June 2008 1 10 100 2001-2007 2001 2002 2003 2004 2005 2006 2007 Year P er c en tage of jour nal s ( % )
1st region 2nd region 3rd region
Figure 2. Yearly distributions of journal titles by region
Core journal titles satisfying one third of all download requests exhibited further interesting use patterns. Not only were their numbers quite stable (around 100) but also the same journal titles consistently appeared, to some extent, in the core journal lists over seven years. To put it somewhat differently, a core journal fulfilling high use in a given year tends to do so in the following years as well. Ranks of individual journal titles based on the number of downloads did not fluctuate much on a yearly basis. This is despite the fact that new journal titles are constantly being added to the SD journal list, thereby increasing both the total number of SD journal titles available for download and the probability of further fluctuation. The total number of SD journal titles available in 2001 is likely to be greater than that in 2007. Yet, the stability of the ranks of individual journals is especially noteworthy. Nonetheless, it should be noted that the ranks of some journals might get affected due to the increase in the total number of available SD journal titles over the years.
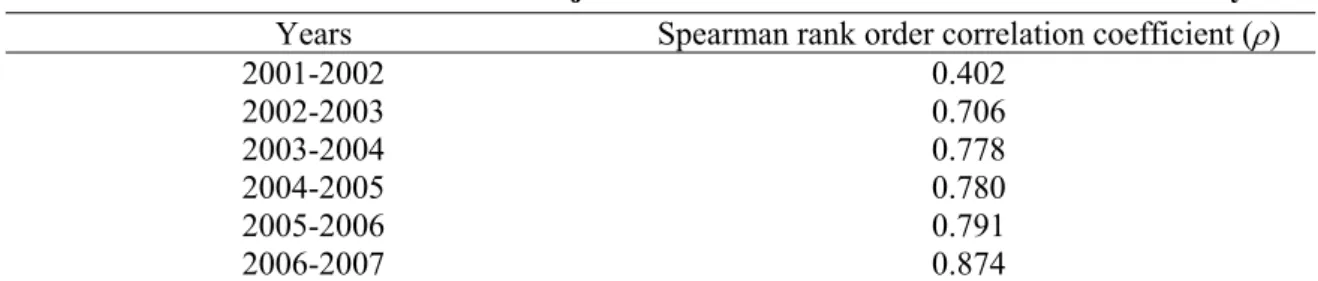
Spearman rank order correlation coefficients (ρ) for core journal titles for two consecutive years ranged between 0.402 (2001/2002) and 0.874 (2006/2007) (Table 2). As the number of downloaded articles increased over the years, so did the correlation between the annual ranks of core journal titles.
Table 2. Correlation coefficients for the core journal titles that were common in two consecutive years
Years Spearman rank order correlation coefficient (ρ)
2001-2002 0.402 2002-2003 0.706 2003-2004 0.778 2004-2005 0.780 2005-2006 0.791 2006-2007 0.874
Note: The correlation coefficient for 2006-2007 does not reflect the use of journal titles within the last quarter of 2007. A total of 29 journals appeared in core journal lists of all seven years, roughly satisfying 3.3 million full-text articles (13.1% of the total number of downloads). More than 200,000 articles were downloaded from the most frequently used journal (Food Chemistry), satisfying 0.8% of all requests. The average number of articles downloaded from those 29 top journals over seven years was 113,793 (16,256 per year). This is about 10 times more than that of the average for all journal titles [49]. Spearman rank order correlation coefficients (ρ) for 29 core journal titles that were common to all seven years were even higher (minimum 0.472 in 2001, maximum 0.964 in 2005. In other words, Turkish academic users tend to use certain journal titles time and again to satisfy their information needs.
The most frequently used top 29 journals along with their rank orders based on the number of articles downloaded over all seven years and that on an annual basis are given in Table 3. It should be noted that journals listed are common to each and every core journal list of all seven years (satisfying one third of all requests) as well as that of the total use (2001/07). It was observed earlier that as the number of downloads increased, the ranks of core journals became more stable. This can be seen in the ranks of the top five journals for the years 2004 through 2007. None of these journals ranked lower than the 8th place (Journal of Food
Engineering). As we go down the list, the ranks of top journals start fluctuating. For instance, the journal Brain Resarch was at the top of the core journal list in 2002 whereas it moved down to the 70th place in 2006. Core journal lists need to be studied more closely in order to pinpoint possible use patterns.
Table 3. Top 29 journals common in the core journal lists of total use (2001/07) and individual years Rank order
Journal name 2001/07 2001 2002 2003 2004 2005 2006 2007
Food Chemistry 1 9 9 12 1 1 2 1
European Journal of Operational Research 2 5 5 4 2 2 3 2
Lancet, The 3 29 11 1 3 3 5 6
Journal of Materials Processing Technology 4 6 2 2 4 6 7 3
Journal of Food Engineering 5 26 24 21 6 8 4 5
Tetrahedron Letters 6 19 13 15 12 4 10 15
Journal of Chromatography A 7 13 10 11 10 11 9 14
Analytica Chimica Acta 10 7 12 6 18 17 12 13
Water Research 11 3 4 10 15 16 22 30
Cement and Concrete Research 12 27 6 5 19 5 30 52
Materials Science and Engineering A 13 15 23 19 16 20 17 8
Tetrahedron 15 32 27 23 25 7 14 17
Polymer 16 18 22 16 23 19 15 11
Biomaterials 17 49 19 20 14 15 20 26
Surface and Coatings Technology 18 24 16 36 26 18 18 10
Bioresource Technology 20 36 28 39 28 21 16 7
Chemosphere 24 50 38 32 29 22 26 22
Energy Conversion and Management 25 37 26 24 22 23 31 32
Aquaculture 26 10 29 38 9 24 52 63
International Journal of Production Economics 28 11 25 34 21 26 37 42
Thin Solid Films 29 34 59 70 47 28 25 12
Brain Research 30 66 1 22 50 48 70 73
Talanta 32 14 33 53 34 33 35 25
International Journal of Food Microbiology 33 17 15 25 27 39 43 54
International Journal of Heat and Mass Transfer 35 4 41 31 40 42 63 51
European Journal of Pharmacology 39 56 8 17 64 79 72 69
Renewable Energy 43 28 63 59 45 49 71 58
Journal of Membrane Science 70 57 49 80 95 67 67 86
Enzyme and Microbial Technology 80 58 56 78 96 92 80 83
Findings of a use study based on the download statistics of one Turkish university (Hacettepe) produced similar results with regards to the SD core journal titles [33]. The most frequently used 30 journal titles satisfied 20.4% of all use at Hacettepe University. The most frequently used 12 journal titles (within the first 30) at Hacettepe were also among the 29 journals used most heavily by all Turkish academics. Seven of those 12
Proceedings ELPUB2008 Conference on Electronic Publishing – Toronto, Canada – June 2008
titles were of medicine while the remaining 5 in food chemistry, food engineering, chromatography, polymer and biomaterials. The rank of journals differed as well. For instance, the journal Lancet was the most frequently used title in Hacettepe’s core journal list (Hacettepe University has a medical school) while it ranked third in the consortial core journal list.
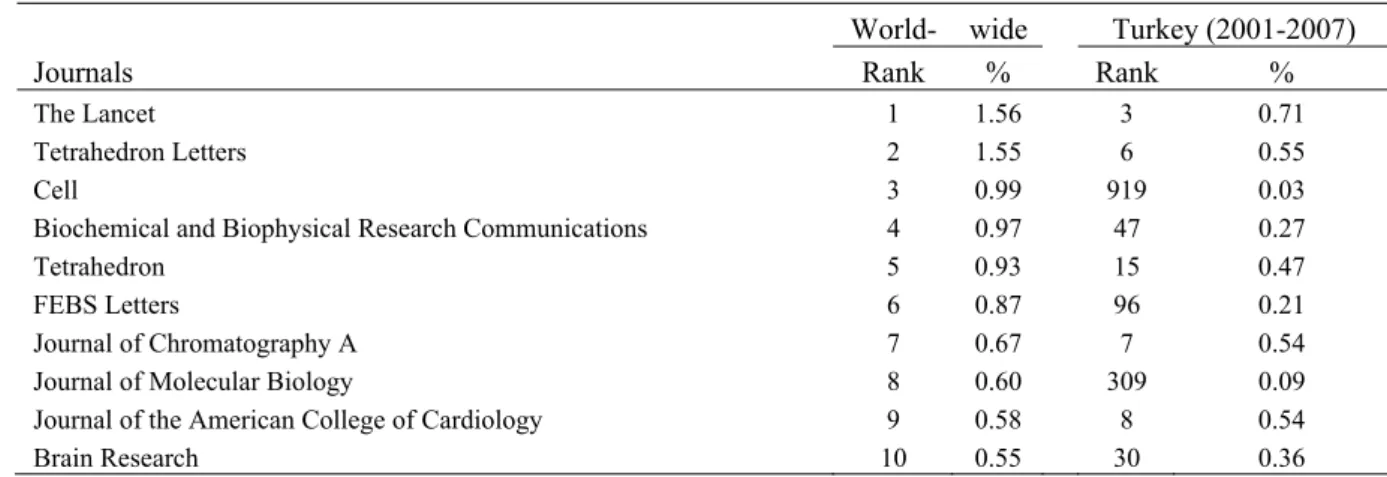
The use of SD journals by the Turkish academic community seem to be in parallel with the world-wide use of the same journals. By November 2006, more than one billion articles were downloaded world-wide from SD [50]. Table 4 lists the “hottest” 10 SD journals based on download statistics along with the percentages satisfying the world-wide demand. The weekly and fortnightly science journals such as the Lancet top the list. Table 4 also provides the equivalent percentages and ranks of those top journals on the basis of local download data. Four out of 10 “hottest” journals (The Lancet, Tetrahedron Letters, Journal of Chromatography A, and Journal of the American College of Cardiology) are also among the top 10 journals used most often by the Turkish academics. Percentages of use of four journals are also comparable. Some well-known journals such as Cell and the Journal of Molecular Biology, on the other hand, appear to have not been used heavily in Turkey [51].
Table 4. The most frequently used top 10 ScienceDirect journals
World- wide Turkey (2001-2007)
Journals Rank % Rank %
The Lancet 1 1.56 3 0.71
Tetrahedron Letters 2 1.55 6 0.55
Cell 3 0.99 919 0.03
Biochemical and Biophysical Research Communications 4 0.97 47 0.27
Tetrahedron 5 0.93 15 0.47
FEBS Letters 6 0.87 96 0.21
Journal of Chromatography A 7 0.67 7 0.54
Journal of Molecular Biology 8 0.60 309 0.09
Journal of the American College of Cardiology 9 0.58 8 0.54
Brain Research 10 0.55 30 0.36
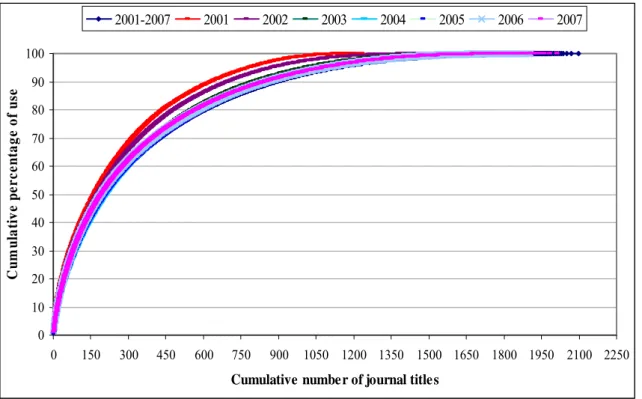
Source: Data in the first two columns come from http://www.info.sciencedirect.com/news/archive/2006/news_billionth.asp. Despite the fact that some 100 core journal titles satisfied one third, some 200 titles half, and some 500 titles 80% of all download requests, the distribution of downloaded articles did not conform to the Bradford’s Law of Scattering [52]. In separate studies, we found out that the distribution of the five-year (2002-2006) download data of Hacettepe University users representing over one million articles, and the distribution of both electronic document delivery and in-house journal use data of the National Academic Network and Information Center did not fit the Bradford Law, either [32, 33]. It was observed in the literature [53, 54] that homogenous bibliographies fit the Bradford Law better, whereas the article download data used in the present study come from over 2,000 journals representing all subject fields. It is also possible that the distributions that possess long tails (e.g., very few articles being downloaded from a large number of journal titles, as was the case in our study) may not fit the Bradford Law very well. This is an issue that deserves to be explored further in its own right [55].
Notwithstanding this disconformity, the stability of the number of relatively few journal titles satisfying the great majority of download requests can nonetheless be seen in Figure 3, which depicts the Bradford curves for the aggregated use of all SD journal titles by Turkish academic users. Figure 3 also shows that the number of SD journals used at least once increased over the years (2,013 in 2007 as opposed to 1,233 in 2001). Yet, it is interesting to note that 17 SD journal titles have not been used even once by more than two million (potential) users in Turkish universities during the seven-year period. Some 102 journal titles were used, on the average, just once per annum.
0 10 20 30 40 50 60 70 80 90 100 0 150 300 450 600 750 900 1050 1200 1350 1500 1650 1800 1950 2100 2250
Cumulative number of journal titles
Cu m u la ti ve p e r c e n tage of u se 2001-2007 2001 2002 2003 2004 2005 2006 2007
Figure 3. Bradford curves for the use of journal titles in SD (2001-2007 N = 2097, 2001 N =1233, 2002 N
=1600, 2003 N = 1654, 2004 N = 1783, 2005 N = 1875, 2006 N = 1907, 2007 N = 2013).
The download data did not quite fit the 80/20 rule, either [56]. In our case, 29% of all journals (or 602 titles) satisfied 80% of more than 25 million download requests. For individual years, the percentage of journals satisfying 80% of all requests ranged between 35% (2001) and 28% (2007), average being 31.6%. Nor did the distribution of download data fit the Price Law (i.e. the number of journals that is equal to the square root of all journal titles satisfying half the download demand) ([52], p. 362). In our study, half the downloads came from 208 journal titles instead of 46, as the Price Law suggests.
Again, the disconformity can perhaps be explained by the wide variety of uses of the collection for different purposes by different researchers. For instance, universities with medical schools may download medical articles more often whereas science and engineering schools may do the same for articles in their respective fields. Considering the fact that there are more than 100 universities with different concentration of subjects in Turkish universities, it is likely that the demand for articles dispersed more evenly than that predicted by the 80/20 rule. The four-year (2000-2003) download data of the Consortium of University Libraries of Catalonia (CBUC) did not fit the 80/20 rule, either: an average of 35% of the journal titles of four different publishers satisfied 80% of the demand [35]. It was suggested that the dispersal of use of journals fits the 80/20 rule better as the number of articles available for download in a collection increases. This does not seem to be the case, however. The SD electronic journals package used in this study has over 2,000 journal titles with more than 8 million articles available for download whereas, for instance, the Emerald Management Xtra (EMX) collection comprises about 190 electronic journal titles with 75,000 articles available for download. While 29% of the SD journal titles satisfied 80% of the download requests in our study, almost half the EMX journal titles satisfied 80% of the world-wide demand in 2004 representing more than 6 million article downloads [57]. We checked if there is any correlation between the journal impact factors (IFs) and the download statistics. IF values of 105 core journals along with the total number of citations to articles that were published therein were obtained from ISI’s Journal Citation Reports 2006. The number of downloads ranged between 206,537 (Food Chemistry) and 50,020 (European Polymer Journal) for core journals (average being 80,228 with SD=33,329). Journals’ IF values ranged between 25.8 (The Lancet) and 0.615 (Journal of Materials Processing Technology) (average being 2.340 with SD=2.624). There appears to be a low correlation between IFs of core journals and the number of downloads therefrom (Pearson’s r = 0.368). The correlation coefficient was even lower (0.291) for 29 journals that were common in all core journal lists between 2001 and 2007. This finding is in parallel with that obtained by other studies that we recently carried out [32, 42]. A low correlation also exists between the ranks of core journal titles based on the number of downloads and that of the total number of citations
Proceedings ELPUB2008 Conference on Electronic Publishing – Toronto, Canada – June 2008
(Spearman’s ρ = 0.253, N = 104). It appears that journals with high IFs tend to be used slightly more often by the Turkish academic community.
It can be argued that the journal IFs (and the total number of citations) are calculated on the basis of world-wide use whereas the number of downloads used in this study is based on local use. The concentration of research in Turkey may well differ from that in other countries (e.g., USA) and skew the downloads away from IF and total number of citations. Yet, there are several studies that show that the use based on citations (IFs) and that on downloads are either slightly correlated or not at all (See [32], p. 215; [36]; [40], p. 319; [41, 42]). As we have indicated earlier, Bollen and Van de Sompel [45] conducted a more careful study comparing the use based on citations (i.e., Journal IFs) and downloads (i.e., Usage Impact Factors) obtained from California State University (CSU). They reported a moderate negative correlation between the two, noting that “CSU usage data indicates significant, community-based deviations between local usage impact and global citation impact” and that “usage-based impact assessments are influenced by the demographic and scholarly characteristics of particular communities” (p. 146). It is also possible that use based on citations and that on downloads measure two different dimensions of usage [36]. The motives of users downloading articles may be quite different than those who cite articles and they may not overlap.
6. Conclusion
The preliminary findings of our analysis based on download statistics of all Turkish universities from Elsevier’s SD database show that some 100 core journals satisfied one third of the total number of 25 million full-text download requests. Lists of core journal titles seem to be quite persistent, for they do not change much on an annual basis. A large number of journal titles were rarely used while some were never used at all. Coupled with the pricing data, findings based on seven years’ worth of national usage statistics can be used by individual university libraries as well as by the consortium management to develop collection management plans and devise negotiation strategies that can be exercised with publishers. Based on national usage statistics, “an orderly retreat” for rarely used journal titles that are usually offered as part of the “big deals” can be negotiated with publishers on behalf of all consortium members [20].
7. Acknowledgments
This study was supported in part by a reserach grant of the Turkish Scientific and Technological Research Center (SOBAG-106K068). We thank Mr. Hatim El Faiz of Elsevier for providing download data used in this study, and Mr. Umut Al of Hacettepe University for providing feedback on an earlier draft of this paper.
8. Notes and References
[1] Statistics come from the web site of the Student Selection and Admission Center: ÖĞRENCİ SEÇME VE YERLEŞTİRME MERKEZİ. (n.d.). 2006-2007 öğretim yılı yükseköğretim istatistikleri (Higher Education Statistics of 2006-2007 Academic Year). Ankara: ÖSYM. Retrieved 26 March 2008, from http://www.osym.gov.tr/dosyagoster.aspx?DIL=1&BELGEANAH=19176&DOSYAISIM=1_Ogrenci_S ay.pdf.
[2] The statistics on the distribution of students by subject disciplines come from p.46, Table 4.2 of TÜRK YÜKSEKÖĞRETİMİNİN BUGÜNKÜ DURUMU (the state of the art of Turkish higher education). (November 2005). Ankara: Higher Education Council. Retrieved, 26 March 2008, from http://www.yok.gov.tr/egitim/raporlar/kasim_2005/kasim_2005.doc.
[3] Statistics come from the web site of the Student Selection and Admission Center: ÖĞRENCİ SEÇME VE YERLEŞTİRME MERKEZİ. (n.d.). 2006-2007 öğretim yılı yükseköğretim istatistikleri (Higher Education Statistics of 2006-2007 Academic Year). Ankara: ÖSYM. Retrieved, 26 March 2008, from http://www.osym.gov.tr/dosyagoster.aspx?DIL=1&BELGEANAH=19176&DOSYAISIM=2_Ogretim_ El_Say.pdf.
[4] TONTA, Y. (2001). Collection development of electronic information resources in Turkish university libraries. Library Collections, Acquisitions and Technical Services, 25(3): 291-298.
[5] LINDLEY, J.A., & ERDOĞAN, P.L. (2002). TRNSL: A model site license for ANKOS. (paper) Presented at the Symposium on Research in the Light of Electronic Developments, October 24-25, 2002, Bolu, Turkey. Retrieved, March 26, 2008, from http://www.library.yale.edu/~llicense/TRNSL-paper.doc
[6] LINDLEY, J.A. (2003). Turkish National Site License (TRNSL). Serials, 16(2): 187-190.
[7] ERDOĞAN, P.L., & KARASÖZEN, B. (2006). ANKOS and its dealings with vendors. The Journal of Academic Librarianship, 44(3-4): 69-83, p. 69.
[8] KARASÖZEN, B., & LINDLEY, J.A. (2004). The impact of ANKOS: Consortium development in Turkey. The Journal of Academic Librarianship, 30: 402-409.
[9] See the ANKOS web site for more information (http://www.ankos.gen.tr).
[10] TONTA, Y. (2007). Elektronik dergiler ve veri tabanlarında ulusal lisans sorunu (The national license issue in electronic journals and databases). (conference paper). Presented at the Akademik Bilişim ’07, 31 January – 2 February 2007, Kütahya, Turkey. (Online). Retrieved, May 12, 2008, from http://yunus.hacettepe.edu.tr/~tonta/yayinlar/tonta-ab07-bildirisi.pdf.
[11] For more information on EKUAL, see http://www.ulakbim.gov.tr/cabim/ekual/hakkinda.uhtml.
[12] In fact, ULAKBİM paid for the license fee of 2006 (last year of a three-year license agreement signed by Elsevier and ANKOS) on behalf of ANKOS members.
[13] For more information on databases offered through ULAKBİM’s EKUAL, see http://www.ulakbim.gov.tr/cabim/ekual/veritabani.uhtml.
[14] ÜNAK-OCLC KONSORSİYUMU (The ÜNAK-OCLC Consortium). (2008). Retrieved, 26 March 2008, from http://www.unak.org.tr/unakoclc/
[15] See http://e-gazete.anadolu.edu.tr/ayrinti.php?no=6501.
[16] FRAZIER, K. (2001). The librarians' dilemma: Contemplating the costs of the "big deal". D-Lib Magazine, 7(3). (Online). Retrieved, May 12, 2008, from http://www.dlib.org/dlib/march01/frazier/03frazier.html
[17] BALL, D. (2004). What’s the “big deal”, and why is it a bad deal for universities? Interlending & Document Supply, 32(2), 117-125.
[18] JOHNSON, R.K. (2004). Open access: Unclocking the value of scientific research. Journal of Library Administration, 42(2), 107-124.
[19] DURANCEAU, E.F. (2004). Cornell and the future of the big deal: An interview with Ross Atkinson. Serials Review, 30(2), 127-130, p. 127. See also Johnson (2004, p. 109) in Ref. 13.
[20] GATTEN, J.N., & SANVILLE, T. (2004). An orderly retreat from the big deal: is it possible for consortia? D-Lib Magazine, 10(10). (Online). Retrieved, May 12, 2008, from http://www.dlib.org/dlib/october04/gatten/10gatten.html.
[21] HAAR, J. (2000). Project PEAK: Vanderbilt’s experience with articles on demand. Serials Librarian, 38(1/2), 91-99.
[22] HUNTER, K. (2000). PEAK and Elsevier Science. PEAK Conference, Ann Arbor, 23 March 2000. (Online). Retrieved, May 12, 2008, from http://www.si.umich.edu/PEAK-2000/hunter.pdf
[23] DAVIS, P.M. (2002). Patterns in electronic journal usage: Challenging the composition of geographic consortia. College & Research Libraries, 63, 484-497.
[24] GALBRAITH, B. (2002). Journal retention decisions incorporating use-statistics as a measure of value. Collection Management, 27(1), 79-90.
[25] BATI, H. (2006). Elektronik bilgi kaynaklarında maliyet-yarar analizi: Orta Doğu Teknik Üniversitesi Kütüphanesi üzerinde bir değerlendirme. (Cost-benefit analysis in electronic information resources: An evaluation of the Middle East Technical University Library). Unpublished M.A. dissertation. Hacettepe University, Ankara.
[26] CHRZASTOWSKI, T.E. (2003). Making the transition from print to electronic serial collections: A new model for academic chemistry libraries? Journal of the American Society for Information Science and Technology, 54, 1141-1148.
[27] WILEY, L., & CHRZASTOWSKI, T.E. (2002). The Illinois Interlibrary Loan Assesment Project II: revisiting statewide article sharing and assessing the impact of electronic full-text journals. Library Collections, Acquisitions, & Technical Services, 26(1), 19-33.
[28] HAMAKER, C. (2003). Quantity, quality and the role of consortia. What’s the Big Deal? Journal purchasing – bulk buying or cherry picking? Strategic issues for librarians, publishers, agents and intermediaries. Association of Subscription Agents and Intermediaries (ASA) Conference (24-25 February 2003). (Online). Retrieved, 14 January 2007, from http://www.subscriptionagents.org/conference/200302/chuck.hamaker.pps.
Proceedings ELPUB2008 Conference on Electronic Publishing – Toronto, Canada – June 2008
[29] KE, H-R., KWAKKELAAR, R., TAI, Y-M., & CHEN, L-C. (2002). Exploring behavior of E-journal users in science and technology: Transaction log analysis of Elsevier’s ScienceDirect OnSite in Taiwan. Library & Information Science Research, 24, 265-291.
[30] RUSCH-FEJA, D., & SIEBKY, U. (1999). Evaluation of usage and acceptance of electronic journals: Results of an electronic survey of Max Planck society researchers including usage statistics from Elsevier, Springer and Academic Press (Full report). D-Lib Magazine, 5(10). (Online). Retrieved, May 12, 2008, from http://www.dlib.org/dlib/october99/rusch-feja/10rusch-feja-fullreport.html.
[31] VAUGHAN, K.T.L. (2003). Changing use patterns of print journals in the digital age: Impacts of electronic equivalents on print chemistry journal use. Journal of the American Society for Information Science and Technology, 54, 1149-1152.
[32] See also TONTA, Y., & ÜNAL, Y. (2007). Dergi kullanım verilerinin bibliyometrik analizi ve koleksiyon yönetiminde kullanımı (Bibliometric analysis of journal use data and its use in collection management). In Serap Kurbanoğlu, Yaşar Tonta & Umut Al (eds.). Değişen Dünyada Bilgi Yönetimi Sempozyumu 24-26 Ekim 2007, Ankara Bildiriler (pp. 193-200). Ankara: Hacettepe Üniversitesi Bilgi ve Belge Yönetimi Bölümü.
[33] AL, U., & TONTA, Y. (2007). Tam metin makale kullanım verilerinin bibliyometrik analizi (Bibliometric analysis of the full-text aricle use). In Serap Kurbanoğlu, Yaşar Tonta & Umut Al (eds.). Değişen Dünyada Bilgi Yönetimi Sempozyumu 24-26 Ekim 2007, Ankara Bildiriler (pp. 209-217). Ankara: Hacettepe Üniversitesi Bilgi ve Belge Yönetimi Bölümü.
[34] EVANS, P., & PETERS, J. (2005). Analysis of the dispersal of use for journals in Emerald Management Xtra (EMX). Interlending & Document Supply, 33(3): 155-157.
[35] URBANO, C., ANGLADA, L.M., BORREGO, A., CANTOS, C., COSCULLUELA, C., & COMELLAS, N. (2004). The use of consortially purchased electronic journals by the CBUC
(2000-2003). D-Lib Magazine, 10(6). (Online). Retrieved. May 10, 2008, from
http://www.dlib.org/dlib/june04/anglada/06anglada.html.
[36] COOPER, M.D., & MCGREGOR, G.F. (1994). Using article photocopydata in bibliographic models for journal collection management. Library Quarterly, 64, 386-413.
[37] MCDONALD, J.D. (2007). Understanding journal usage: A statistical analysis of citation and use. Journal of the AmericanSociety for Information Science and Technology, 58, 39-50.
[38] TSAY, M-Y. (1998a). Library journal use and citation half-life in medical science. Journal of the American Society for Information Science, 49, 1283-1292.
[39] TSAY, M-Y. (1998b). The relationship between journal use in a medical library and citation use. Bulletin of the Medical Library Association, 86, 31-39.
[40] WULFF, J.L., & NIXON, N.D. (2004). Quality markers and use ofelectronic journals in an academic health sciences library. Journal of the Medical Library Association, 92, 315-322.
[41] SCALES, P.A. (1976). Citation analyses as indicators of the use of serials: A comparison of ranked title lists produced by citation counting and from use data. Journal of Documentation, 32, 17-25.
[42] TONTA, Y., & ÜNAL, Y. (2005). Scatter of journals and literature obsolescence reflected in document delivery requests. Journal of the American Society for Information Science & Technology, 56(1): 84-94. [43] DARMONI, S.J., ROUSSEL, F., BENICHOU, J., THIRION, B., & PINHAS, N. (2002). Reading
factor: A new bibliometric criterion for managing digital libraries. Journal of the Medical Library Association, 90(3), 323–327.
[44] BOLLEN, J., VAN DE SOMPEL, H., SMITH, J., & LUCE, R. (2005). Toward alternative metrics of journal impact: A comparison of download and citation data. Information Processing & Management, 41(6), 1419–1440.
[45] BOLLEN, J., & VAN DE SOMPEL, H. (2008). Usage Impact Factor: the effects of sample characteristics on usage-based impact metrics. Journal of the American Society for Information Science and Technology, 59, 136-149.
[46] http://www.mesur.org/MESUR.html (bold in original) [47] http://www.info.sciencedirect.com/content/journals/titles/
[48] The figure reflects the data obtained from the publisher. It is slightly different from the total given in Fig. 1, as the download statistics for the last quarter of 2007 was estimated and added to the total. [49] The average number of articles downloaded per journal title over 7 years was 11,991 (1,713 per year)
(s.d. = 20,101, median: 4,784).
[51] Note that the Journal of the American College of Cardiology ranks 8th on the basis of total use (2001/07). It does not appear in Table 3 because the journal was not common in the core journal lists of all years.
[52] EGGHE, L., & ROUSSEAU, R. (1990). Introduction to informetrics: Quantitative methods in library, documentation and information science. Amsterdam: Elsevier Science Publishers. (Online) Retrieved. January 31, 2008 from http://hdl.handle.net/1942/587.
[53] COLEMAN, S.R. (1994). Disciplinary variables that affect the shape of Bradford’s bibliograph. Scientometrics, 29(1): 59-81.
[54] COLEMAN, S.R. (1993). Bradford distributions of social-science bibliographies varying in definitional homogeneity. Scientometrics, 27(1): 75-91.
[55] DROTT, M.C., & GRIFFITH, B.C. (1978). An examination of the Bradford’s Law and the scattering of scientific literature. Journal of the American Society for Information Science, 29, 238-246.
[56] TRUESWELL, R.L. (1969). Some behavioral patterns of library users: the 80/20 rule. Wilson Library Bulletin, 43: 458-461.
[57] See Ref. 34. Current statistics on the number of electronic journals and articles in the Emerald
Management Xtra (EMX) collection come from http://info.emeraldinsight.com/products/xtra/index.htm?PHPSESSID=en8jddl2iumvt3ask2h0a98at6&.