Contents lists available atScienceDirect
Brain Research
journal homepage:www.elsevier.com/locate/brainres
Research report
Simultaneous miRNA and mRNA transcriptome pro
filing of glioblastoma
samples reveals a novel set of OncomiR candidates and their target genes
Sukru Gulluoglu
a,b, Emre Can Tuysuz
a,b, Mesut Sahin
c, Aysegul Kuskucu
a, Cumhur Kaan Yaltirik
d,
Ugur Ture
d, Baris Kucukkaraduman
e, Muhammad Waqas Akbar
e, Ali Osmay Gure
e,
Omer Faruk Bayrak
a, Altay Burak Dalan
f,⁎aDepartment of Medical Genetics, Yeditepe University Medical School, Istanbul, Turkey bDepartment of Biotechnology, Institute of Science, Yeditepe University, Istanbul, Turkey
cDepartment of Nanoscience and Nanoengineering, Institute of Science Ataturk University, Erzurum, Turkey dDepartment of Neurosurgery, Yeditepe University Medical School, Yeditepe University, Istanbul, Turkey eDepartment of Molecular Biology and Genetics, Bilkent University, Ankara, Turkey
fDepartment of Biochemistry, Yeditepe University Medical School, Istanbul, Turkey
H I G H L I G H T S
•
miR-21 and miR-339 affect migration, invasion and apoptosis of GBM cells.•
TUSC3 and NEGR1 is correlated with young age at diagnosis in GBM.•
miR-21 expression level was correlated with older age at diagnosis in GBM.•
TUSC3 expression is associated with higher tumor volume in GBM patients.•
Low miR-92b, miR-182, NEFM and UNC13C is indicative of shorter overall survival. A R T I C L E I N F O Keywords: Glioblastoma Survival Microarray Mir-21-5p Mirna Prognosis A B S T R A C TAlthough glioblastomas are common, there remains a need to elucidate the underlying mechanisms behind their initiation and progression and identify molecular pathways for improving treatment. In this study, sixteen fresh-frozen glioblastoma samples and seven samples of healthy brain tissues were analyzed with miRNA and whole transcriptome microarray chips. Candidate miRNAs and mRNAs were selected to validate expression infifty patient samples in total with the criteria of abundance, relevance and prediction scores. miRNA and target mRNA relationships were assessed by inhibiting selected miRNAs in glioblastoma cells. Functional tests have been conducted in order to see the effects of miRNAs on invasion, migration and apoptosis of GBM cells. Analyses were carried out to determine correlations between selected molecules and clinicopathological fea-tures. 1332 genes and 319 miRNAs were found to be dysregulated by the microarrays. The results were com-bined and analyzed with Transcriptome Analysis Console 3 software and the DAVID online database. Primary differential pathways included Ras, HIF-1, MAPK signaling and cell adhesion. OncomiR candidates 21-5p, 92b-3p, 182-5p and 339-5p for glioblastoma negatively correlated with notable mRNA targets both in tissues and in in vitro experiments. miR-21-5p and miR-339-5p significantly affected migration, invasion and apoptosis of GBM cells in vitro. Significant correlations with overall survival, tumor volume, recurrence and age at diagnosis were discovered. In this article we present valuable integrated microarray analysis of glioblastoma samples regarding miRNA and gene-expression levels. Notable biomarkers and miRNA-mRNA interactions have been identified, some of which correlated with clinicopathological features in our cohort.
https://doi.org/10.1016/j.brainres.2018.08.035
Received 3 May 2018; Received in revised form 7 August 2018; Accepted 31 August 2018
Abbreviations: WHO, World health organization; miRNA, micro RNA; PCR, Polymerase Chain Reaction; ANOVA, Analysis of variance; RPKM, Reads per Kilobase Million; DAVID, Database for Annotation Visualization and Integrated Discovery
⁎Corresponding author at:İçerenköy Mahallesi Hastane Sokak No: 4, 4/1 Ataşehir, Istanbul, Turkey.
E-mail addresses:[email protected](A. Kuskucu),[email protected](B. Kucukkaraduman),
[email protected](M.W. Akbar),[email protected](A.O. Gure),[email protected](O.F. Bayrak),[email protected], [email protected](A.B. Dalan).
Available online 31 August 2018
0006-8993/ © 2018 Published by Elsevier B.V.
1. Introduction
Glioblastoma is the most frequently occurring primary brain tumor in adults, comprising half of all diffuse gliomas. It is a poorly differ-entiated astrocytic tumor, with high cell density, nuclear atypia, a high Ki-67 index, invasiveness and resistance to chemotherapy (Louis et al., 2007; Ricard et al., 2012). Despite new approaches to therapy, the prognosis of the disease is still poor with a median survival time of 12–15 months. Thus, new treatment strategies are needed (Vogelbaum and Aghi, 2015).
microRNAs (miRNAs) are small, non-coding RNA molecules that are about 22 nucleotides long. There is growing interest in the role of miRNAs in the initiation and progression of cancer. Several studies have been conducted to discover the signature miRNA expression patterns of glioblastoma, and functional experiments have been undertaken on a number of molecules and their downstream targets. One study de-termined that miR-26a regulates PTEN in high-grade gliomas and plays a role in tumorigenesis (Huse et al., 2009). In another study, miR-10b was upregulated in the disease and associated with a high grade and, potentially, invasion (Sasayama et al., 2009). In other studies, miR-21, miR-7, miR-34a and miR-101 were presented as key miRNAs for the disease (Chen et al., 2008; Kefas et al., 2008; Li et al., 2011; Smits et al., 2010).
Recently, the World Health Organization (WHO) announced a new classification of glioblastomas in which IDH-wildtype and IDH-mutant tumors were classified as different groups. IDH-wildtype is observed in 90% of glioblastoma cases with a vast majority in patients over the age of 55. The IDH-mutant type is observed in 10% of all cases, mostly in younger patients (Cloughesy et al., 2014; Louis et al., 2016; Ohgaki and Kleihues, 2013).
A better understanding of molecular mechanisms behind the in-itiation and progression of glioblastoma is needed. In this study, we sought to uncover data about miRNA and mRNA relationships in glio-blastomas by combining the mRNA and miRNA expression profiles of 16 glioblastoma samples, four of which were IDH mutants, seven healthy brain tissue samples, and two healthy cell lines. Here, we present an analysis of integrated data with respect to glioblastoma versus healthy and IDH-wildtype versus IDH-mutant subtypes. Notable miRNAs and mRNAs were individually observed for targeting, along with their correlation with clinicopathological features in our patient cohort.
2. Results
2.1. Differentially expressed miRNAs and mRNAs in our GBM cohort 16 glioblastoma samples, 7 samples of healthy brain tissue, and 2 healthy astrocyte cell lines were used to profile miRNA and gene ex-pression. For additional tests with patient samples 50 patient samples were used (Supp. Table 1). 1332 genes were found to be upregulated and 1149 were found to be downregulated as a result of whole tran-scriptome microarray (seeSupp. Fig. 1, which shows the array study report for the gene expression microarray). With the miRNA microarray 319 miRNAs were found to be upregulated and 214 were found to be downregulated (seeSupp. Fig. 2, which shows the array study report for the miRNA microarray). To increase confidence levels for the selection of candidate genes and miRNAs, a fold change (linear) of less than -4 or greater than 4 and an ANOVA p value (condition pair) of < 0.01 were chosen as cutoff value in both arrays. The results from both microarrays were combined and analyzed by using TAC software (Affymetrix) and DAVID online databases. Dysregulated mRNAs were analyzed for their collective effect on important molecular and cellular events (Table 1). Additionally, further comparisons of microarray profiles were con-ducted by comparing IDH-wildtype samples with IDH-mutant samples. Twelve IDH-wildtype and four IDH-mutant samples were compared. Between the two groups, 34 miRNAs and 641 mRNAs were
differentially regulated.Table 2lists the affected pathways and notable deregulated genes.
Candidate mRNAs and miRNAs were chosen according to pathways and networks relevant to glioblastoma, as well as well-matched ex-pression levels of miRNAs and their potential mRNA targets. In order to eliminate nonconforming miRNA- target gene pairs in terms of ex-pression, miRNAs and their relevant predicted and validated targets have been compiled from databases andfiltered according to consistent expression in miRNA- target gene pairs. miRNA- target gene pairs which had nonconforming expression levels, were left out and, only pairs with high miRNA expression and low target gene expression were selected in order to ensure the targeting is phenotypical in our current cohort. Next, web-based databases: mirdb.org/miRDB/, mirtarbase. mbc.nctu.edu.tw, http://targetscan.org/, pictar.mdc-berlin.de, http:// www.microrna.org have been used to evaluate which of the genes-miRNA pairs are relevant to GBM and cancer in general. Predicted targets were further selectedto balance prediction-match scores, ex-pression level and the relevancy and novelty of the genes in glio-blastoma research literature. The target prediction scores from the above mentioned databases were taken into consideration in order in-crease the reliability of the selection (Supp. Table 2). The data discussed in this publication have been deposited into the NCBI's Gene Expression Omnibus (Edgar et al., 2002) and are accessible through GEO Series accession number GSE90604 (https://www.ncbi.nlm.nih.gov/geo/ query/acc.cgi?acc=GSE90604).
2.2. Microarray data was confirmed with real-time PCR in a greater number of patient samples
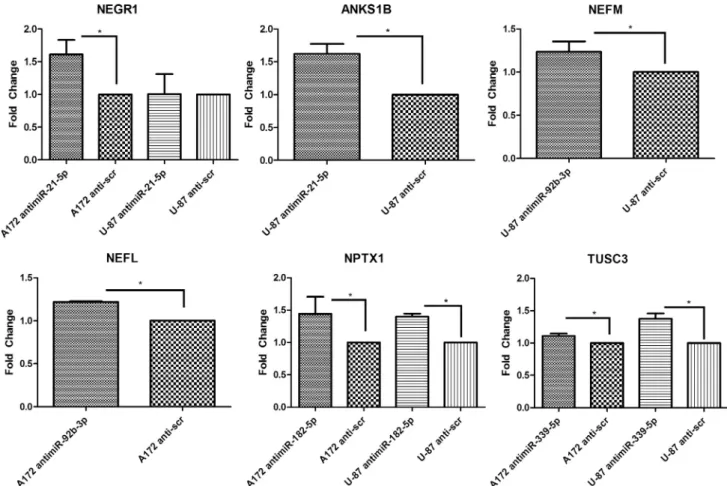
The levels of selected mRNAs and miRNAs in patient samples were verified through real-time PCR. The levels of miR-21-5p, miR-92b-3p, miR-182-5p, and miR-339-5p were in synchrony with the microarray data as their levels were significantly higher in tumor samples than in healthy samples (Fig. 1). NEGR1, ANKS1B, NEFM, NEFL, UNC13C, NPTX1 and TUSC3 levels were also confirmed to be coherent with the microarray data. All results were statistically significant (Fig. 1). 2.3. Anti-miR mimics were successfully transfected into GBM cells
The transfection capability of the X-tremeGENE siRNA Transfection Reagent, and the ability of the anti-miR mimics to suppress their target miRNAs in two glioblastoma cell lines were assessed. Cy3-labeled anti-miR mimics were visualized after transfection. Fluorescence micro-scopy showed that the Cy3-labeled miRNA constructs were successfully transfected into cells (Supp. Fig. 3A). Nofluorescence was detected in the control groups. Upon transfection of anti-miR mimics, corre-sponding miRNA levels significantly decreased in the glioblastoma cell lines after 48 h (Supp. Fig. 3B).
2.4. Correlation between miRNAs and corresponding targets in glioblastoma cells
We checked whether miRNAs and their target mRNAs are nega-tively correlated in glioblastoma samples 48 h after transfection of anti-miRs into cell lines by directly measuring the miRNA levels and the levels of their corresponding mRNA targets. In cell lines, UNC13C levels could not be detected. The remaining anti-miRs successfully increased the corresponding target mRNA level in at least one of the cell lines (Fig. 2).
To evaluate the potential regulation of mRNA targets by selected miRNAs, we checked, if there was a correlation between their levels in patient samples. miR-21-5p expression was negatively correlated with NEGR1 and ANKS1B expression, and miR-92b-3p expression was ne-gatively correlated with NEFL expression, whereas miR-339-5p ex-pression was negatively correlated with TUSC3 exex-pression (Fig. 3).
2.5. miR-21 and miR-339 inhibition decreases migration and invasion in GBM cell lines
Downregulation of miR-21-5p and miR-339-5p significantly de-creased invasion and migration capacity of A172 and U-87 cells. antimiR-182-5p transfection decreased invasion and migration capacity of A172, but it had no effect on invasion and migration in U-87. miR-92b had no observable effect on migration and invasion of GBM cell lines (Fig. 4A,B).
2.6. miR-21 and miR-339 might play a role in apoptosis evasion of GBM cells
Reduction of miR-21-5p and miR-339-5p levels stimulates apoptosis in GBM. antimiR-21-5p transfection increased Annexin V + 7AAD- cell population, namely the early apoptotic cells after 48 h by %12 in A172 and %32 in A172. antimiR-339-5p transfection also increased apoptosis by %21 and %62 in A172 and U87, respectively. AntimiR-92b-3p had no effect on apoptosis in U-87, whereas, it induced apoptosis by %52 in A172 when compared with anti-scr control (Fig. 4C).
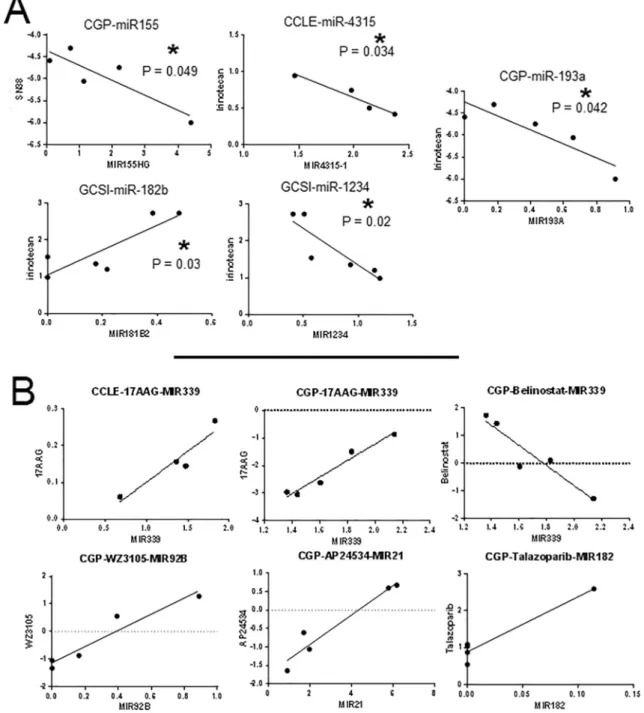
2.7. A Number of miRNAs in the dataset correlated with drug sensitivity in RNA-Seq data obtained for GBM
5 miRNAs (MIR155HG, MIR4325, MIR181B2, MIR1234, MIR193A) were identified. 4 of these miRNAs showed a positive and one showed a
negative correlation with irinotecan IC50 values (Fig. 5A). As the result of the second test, we found that increased MIR339 expression corre-lated with decreased sensitivity to 17AAG (HSP90 inhibitor) in both CCLE and CGP. MIR339 level was also found to be inversely correlated with Belinostat resistance (HDAC inhibitor) in CGP. Increased MIR92B level was related to resistance to WZ3105 (multi kinase inhibitor, in-cluding SRC, ROCK2, NTRK2, FLT3, IRAK1, others). miR-21 level was correlated withponatinib, and miR-182 level was correlated with Ta-lazoparib resistance (PARP inhibitor) in CGP (Fig. 5B).
2.8. Correlation between the level of dysregulated miRNAs and mRNAs with clinicopathological features of glioblastoma patients
We evaluated the relationships between miRNA and mRNA levels and the clinicopathological features of glioblastoma patients, including age at diagnosis, WHO grade, age at diagnosis, tumor volume, p53, p16, MGMT, Ki-67, Olig-2 and survival. For the chi-square tests, patient samples were separated into two groups of low and high levels of the corresponding miRNA or mRNA level by using the median value in each group.
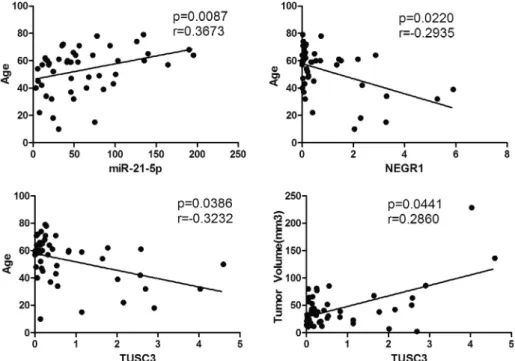
Among the clinical characteristics evaluated, TUSC3 and NEGR1 expressions were correlated with young age at diagnosis while miR-21-5p expression level was correlated with older age at diagnosis. TUSC3 was also associated with higher tumor volume (Fig. 6). As a result of chi-square tests, TUSC3 was found to be inversely correlated with Olig-2 staining. miR-Olig-21-5p was inversely correlated with MGMT status. Table 1
Kyoto Encyclopedia of Genes and Genomes (KEGG) pathways, functions and notable molecules of glioblastoma versus healthy samples.
Functional Analysis
Gene Count % p-value Benjamini Cell Junction 52 15.0 6.2E−21 9.8E−19 Cell Adhesion 25 7.2 8.7E−7 1.4E−5 EGF-like domain 15 4.3 3.1E−5 4.0E−4
cAMP 5 1.4 2.3E−3 1.9E−2
Kinase 21 6.1 1.5E−2 9.6E−2
Inflammatory response 7 2.0 3.5E−2 1.8E−1 Notch signaling 4 1.2 4.8E−2 2.3E−1 KEGG PATHWAY Analysis
Cell adhesion molecules 12 3.5 1.4E−4 3.1E−3 Ras signaling 13 3.8 2.1E−3 2.5E−2 HIF-1 signaling 7 2.0 1.5E−2 1.2E−1 MAPK signaling 10 2.9 7.6E−2 3.6E−1 Notable Molecules
Symbol Exp Fold Change
Location Molecule Type Biomarker Application Drug(s) CD68 4.14 Plasma Membrane other diagnosis, efficacy
CDKN2A 4.16 Nucleus transcription regulator diagnosis, disease progression, efficacy, prognosis
RNASE2 4.25 Cytoplasm enzyme diagnosis
VIM 4.61 Cytoplasm other diagnosis, efficacy, prognosis JAG1 4.7 Extracellular Space growth factor efficacy
HILPDA 5.07 Cytoplasm other diagnosis
NAMPT 5.49 Extracellular Space cytokine diagnosis, prognosis KPT-9274
EZH2 6.29 Nucleus transcription regulator diagnosis, disease progression, efficacy EPZ-6438, GSK2816126, CPI-1205 IL6R 6.48 Plasma Membrane transmembrane receptor efficacy tocilizumab
MMP14 8.08 Extracellular Space peptidase diagnosis, prognosis rebimastat, marimastat, prinomastat TIMP4 8.09 Extracellular Space other diagnosis, prognosis
WFS1 8.26 Cytoplasm enzyme diagnosis
ANGPT2 9.87 Extracellular Space growth factor diagnosis, efficacy, prognosis trebananib, CVX-060 ABCC3 12.16 Plasma Membrane transporter diagnosis, prognosis
TOP2A 13.38 Nucleus enzyme diagnosis, efficacy, prognosis, response to therapy
etoposide, cytarabine CD44 13.53 Plasma Membrane enzyme diagnosis, disease progression, prognosis
CHI3L1 22.38 Extracellular Space enzyme diagnosis, efficacy, prognosis
For the GBM vs. healthy sample comparison in our cohort, number of genes, percentage of genes in the function or pathway in comparison to the total number of filtered genes for analysis, p-value and Benjamini-Hochberg value for false discovery rates are listed. Additionally relevant molecules are listed with fold change, location, type of molecule, their present role as a biomarker and drugs that act against them.
Additionally low NEGR1 level was associated with recurrence in our samples. Finally, NEGR1 was positively correlated with p16 (Table 3). As a result of Kaplan-Meier survival analysis low levels of miR-92b-3p, miR-182-5p, NEFM and UNC13C were associated with shorter overall survival (Fig. 7). Bioinformatics survival analysis showed that expres-sion of miR-182, NEFM and UNC13C were positively correlated with increased overall survival time in GBM. Although miR-92b expression was associated with good prognosis in our patient cohort, we could not detect any significance for miR-92b on survival in survival analysis with The Cancer Genome Atlas (TCGA) data (Supp. Fig. 4).
3. Discussion
Glioblastoma is the most aggressive primary malignant tumor of the brain that can arise in the cerebral cortex, cerebellum, brain stem or spinal cord. These tumors appear most commonly after the seventh decade of life. Glioblastomas are poorly differentiated astrocytomas that exhibit low apoptosis, high mitosis and rich neo-angiogenesis. Although the origins and genetic features of this tumor are highly heterogeneous, common amplifications of EGFR and PDGFRA, and
losses of NF1, PTEN and CDKN2A/B, have been observed (Brennan et al., 2013; Patel et al., 2012; Ramkissoon et al., 2015). Recently, WHO defined a criterion of IDH mutation to determine the glioblastoma grade. Mutations in IDH1 were detected in an integrated genomic analysis study (Parsons et al., 2008) and tumors with an IDH-mutated genotype are associated with double the overall median survival rate compared with those having an IDH-wildtype genotype (Molenaar et al., 2014). With only a median survival of 14 months under combined therapy, glioblastoma continues to be one of the most devastating tu-mors of the central nervous system despite extensive studies to de-termine molecular markers and new surgical and treatment methods (Shirazi et al., 2011; Veliz et al., 2015). Therefore, efforts to identify biomarkers that are related to tumor grade, survival and clin-icopathological features are crucial to improve treatment options for patients with the disease. In this study, we present a combined miRNA-mRNA analysis of a glioblastoma cohort with the latest versions of two microarrays using the same set of patient samples for both. Although there is a considerable number of studies about miRNA and gene ex-pression profiles in GBM tissues, combining the data from miRNA and mRNA profiles of the same patients in our study provides novel and Table 2
Kyoto Encyclopedia of Genes and Genomes (KEGG) pathways, functions and notable molecules of IDH-wildtype versus IDH-mutant glioblastoma samples.
IDH- vs IDH + Functional Analysis
Gene Count % p-value Benjamini Cell Adhesion 33 6.4 3.4E−9 3.7E−7 Cell Junction 31 6.0 3.5E−5 1.3E−3 EGF-like Domain 13 2.5 3.3E−3 4.6E−2 KEGG PATHWAY
Analysis
Focal adhesion 17 3.3 8.8E−6 1.7E−3 Proteoglycans in cancer 16 3.1 2.6E−5 2.4E−3 MAPK signaling 15 2.9 1.2E−3 5.7E−2 PI3K-Akt signaling 17 3.3 3.2E−3 9.6E−2 Ras signaling 11 2.1 2.5E−2 2.9E−1 cAMP signaling 9 1.8 6.6E−2 4.8E−1 Notable Molecules
Symbol Exp Fold Change
Location Molecule Type Biomarker Application Drug(s) PCSK2 −8.33 Extracellular Space peptidase diagnosis
CD38 −4.7 Plasma Membrane enzyme efficacy, prognosis, Daratumumab
ERBB3 −4.2 Plasma Membrane kinase efficacy, prognosis, safety afatinib, sapitinib, cetuximab ERBB4 −3.84 Plasma Membrane kinase efficacy, safety afatinib, osimertinib, pirotinib PLAT 3.48 Extracellular Space peptidase diagnosis, efficacy, prognosis, safety 6-aminocaproic acid
MMP14 3.57 Extracellular Space peptidase diagnosis, prognosis rebimastat, marimastat, prinomastat PDPN 3.68 Plasma Membrane other diagnosis, disease progression, prognosis
FLNC 3.81 Cytoplasm other diagnosis
MMP9 3.91 Extracellular Space peptidase diagnosis, disease progression, efficacy, prognosis
MMP2 MMP9 inhibitor, GS-5745, rebimastat, marimastat, prinomastat, glucosamine MMP2 2.69 Extracellular Space peptidase diagnosis, disease progression,efficacy,
prognosis, response to therapy
MMP2 MMP9 inhibitor, rebimastat, marimastat, prinomastat SOCS3 4.04 Cytoplasm phosphatase diagnosis
EMP3 4.23 Plasma Membrane other diagnosis
TIMP1 4.34 Extracellular Space cytokine diagnosis, disease progression, efficacy, prognosis
TNC 4.62 Extracellular Space other diagnosis, response to therapy TNFAIP6 4.78 Extracellular Space Inflammation
ADAM12 5.28 Plasma Membrane peptidase diagnosis ADM 5.37 Extracellular Space other prognosis mir-21 5.51 Cytoplasm microRNA diagnosis
ADAMTS9 7.46 Extracellular Space peptidase diagnosis, disease progression SERPINE1 8.9 Extracellular Space other diagnosis, disease progression, efficacy,
prognosis
drotrecogin alfa IGFBP2 9.04 Extracellular Space other diagnosis, efficacy, prognosis
VEGFA 9.19 Extracellular Space growth factor diagnosis, efficacy, prognosis, safety, unspecified application
Dalteparin, bevacizumab, ranibizumab IBSP 16.29 Extracellular Space other efficacy
ABCC3 21.58 Plasma Membrane transporter diagnosis, prognosis
For the comparison of IDH wild-type and IDH mutant samples in our cohort, number of genes, percentage of genes in the function or pathway in comparison to the total number offiltered genes for analysis, p-value and Benjamini-Hochberg value for false discovery rates are listed. Additionally relevant molecules are listed with fold change, location, type of molecule, their present role as a biomarker and drugs that act against them.
valuable information about glioblastoma pathways and gene networks, since this is the most reliable approach to observe how the level of a miRNAs can influence the level of its target genes in the cell.
In both glioblastoma versus healthy and wildtype versus IDH-mutated groups, we observed activation of similar pathways and functions as a result of analysis using the DAVID database. In the IDH-wildtype group, the major tumor-driving pathways in glioblastoma, such as MAPK, Ras and cAMP signaling, were more active than in the IDH-mutated group. Furthermore, ITGB3, ITGB5, MMP2, MMP9 and PLAUR, which have been associated with glioma invasiveness, were upregulated in the GBM vs healthy comparison. This pattern might be one of the driving factors of a worse prognosis (Zheng et al., 2014). We also observed that, in the IDH-wildtype versus IDH-mutated compar-ison, PI3K-Akt signaling was active which is in synchrony with previous studies (Birner et al., 2014; Wakimoto et al., 2014). This relation was absent in the tumor-versus-healthy comparison. Such differences can be put to use to elucidate the different mechanisms behind tumorigenesis in IDH-wildtype and IDH-mutated tumors. Additionally, as a result of in silico drug sensitivity correlation study, we have presented further miRNAs; miR-155, miR-4325, miR-182b, miR-1234 and miR-192a as potentially important genes for GBM as they significantly correlate with resistance to irinotecan which is a cytotoxic drug. Moreover, as a result of a linear correlation analysis between miRNA RPKM values and IC50 data RNA-Seq analysis, using E-MTAB-2706 data, miR-339, miR-92b, miR-21 and miR-182 were found to be correlated with resistance to 17AAG, WZ3105, AP24534 and Talazoparib respectively.
In this study, miRNAs 339-5p, 21-5p, 92b-3p, and 182-5p were found to be significantly upregulated in glioblastoma samples. The potential oncogenic role of miR-339 in glioblastomas and its relation-ship with ICAM-1 has been mentioned previously, in which down-regulation of the miRNA, increases ICAM-1 expression and promotes
CTL-mediated cytolysis (Ueda et al., 2009). Previous studies have pointed out the overexpression of miR-21 in glioblastoma and other cancers as a predictive marker for overall survival (Yang et al., 2014). In glioblastomas, overexpressed miR-92b-3p is associated with inva-sion, migration and apoptotic evasion (Song et al., 2016). Additionally, miR-182-5p has been reported to be upregulated by STAT3 and to promote glioma tumorigenesis (Xue et al., 2016). In this study, miR-21-5p is associated with decreased MGMT expression. It has been reported that low expression of MGMT is associated with longer overall survival and response to radiotherapy and chemotherapy in glioblastoma (Hegi et al., 2005; Rivera et al., 2010). In the current study, low miR-92b-3p and miR-182-5p levels were correlated with a shorter overall survival. miR-182-5p downregulation was also found to be significantly corre-lated with overall survival in the TCGA analysis. Additionally, miR-21-5p and miR-339-miR-21-5p were both associated with migration, invasion and apoptosis in both GBM cell lines used in this study. Upregulation of miR-21 has been associated with increased invasion and migration capability in U-87 and A-172 previously (Luo et al., 2017). Our study confirms these results, as downregulation of the miRNA has decreased these abilities. Our results also confirm the anti-apoptotic role of miR-21 in gliomas that has been reported previously (Chai et al., 2018). Taken together, these three miRNAs can be driving factors of the rapid proliferation, and invasive character of glioblastoma cells.
After transfecting glioblastoma cell lines with the corresponding anti-miR molecules, we have observed that NEGR1, ANKS1B, NEFM, NEFL, NPTX1 and TUSC3 levels significantly increased in at least one of the glioblastoma cell lines. NEGR1 is a newly identified tumor sup-pressor that has been shown to be downregulated in colon, liver, lung, ovary, stomach and pancreatic cancers. Additionally, downregulation of the gene caused an increase in cell migration and invasion in these cells (Kim et al., 2014). We discovered that this gene is also Fig. 1. The relative expression levels of selected miRNAs and mRNAs in patient samples as determined by real-time PCR analysis. Each point represents a patient sample or healthy control cell line.‘*’ indicates p < 0.05, ‘**’ indicates p < 0.01 and ‘***’ indicates p < 0.001.
downregulated in glioblastoma samples. Additionally, NEGR1 expres-sion is positively correlated with the p16 level in our cohort. Several studies have reported that p16 dominantly suppresses glioblastoma growth and is a well-known tumor suppressor for the disease (Hung
et al., 2000; Simon et al., 2002). Thesefindings suggest that NEGR1 might be executing a tumor suppressor role in GBM.
NEFM and NEFL cooperate to form neurofilaments in mature neu-rons. DNA methylation-associated silencing of neurofilament genes, Fig. 2. mRNA expression levels after targeting with corresponding anti-miRNA molecules. Anti-miR-21-5p, Anti-miR-92-3p, Anti-miR-182-5p, and Anti-miR-339-5p were administered to A-172 and U-87 cells, and target mRNA levels were determined after 48 h. No UNL13C level could be detected in the cell lines; therefore, they were excluded from the results.‘*’ indicates p < 0.05.
including NEFM and NEFL, promotes an aggressive phenotype in breast, pancreatic, gastric and colon cancers. Restoring neurofilament production through this gene network reduces cell proliferation and growth of breast cancer cells (Calmon et al., 2015). Here, we show that these two genes are also downregulated in glioblastoma, and regulated with miR-92b-3p. Moreover, low level NEFM is associated with a shorter overall survival in our samples as well as the TCGA database
analysis. Furthermore, lower NEFL levels are associated with a higher risk of recurrence in our cohort. In one study, an abundance of neu-rofilament-protein expression was associated with a distinct clinical and anatomical behavior as well as higher overall survival and progression-free survival in patients with glioblastoma (Pallud et al., 2012). Taken together, neurofilament-related genes and regulators such as miR-92b-3p, NEFM and NEFL might be decisive biomarkers for glioblastoma Fig. 4. Functional effects of selected miRNAs on GBM cell lines. A) Columns indicating relative migration capability after anti-miR transfection of A172 and U-87 cell lines. B) Columns indicating relative invasion capability after anti-miR transfection of A172 and U-87 cell lines. C, D) Representative images of the transwell chambers under light microscope. E) Columns indicate percent increase in relative number of apoptotic cells after anti-miRNA transfection of A172 and U-87 cell lines in comparison to anti-miRNA mimic controls.‘*’ indicates p < 0.05.
progression.
UNC13C was identified as one of the most frequently mutated genes in gingivo-buccal oral squamous cell carcinoma (India Project Team of the International Cancer Genome, 2013). Both in the current study and the TCGA, this gene was correlated with overall survival which is an-other hint that it might be an important cancer-associated gene. TUSC3 is a potential tumor suppressor in cancers, and in ovarian cancer it is associated with progression-free and overall survival (Pils et al., 2013). Our results reveal that this gene is also a potential tumor suppressor in glioblastomas as it is significantly downregulated in glioblastoma samples. In the current study TUSC3 is inversely correlated with Olig2 expression in patient samples, which is a specific GBM cancer stem cell marker (Trepant et al., 2015). Nevertheless, TUSC3 had a positive correlation with tumor size, which is a contradictory result.
4. Conclusions
Our study presents valuable integrated data about mRNA and miRNA expression in glioblastoma samples. Markers that can play a role in glioblastoma pathophysiology have been determined, and the results reveal a relationship between miRNAs and novel potential target molecules in glioblastoma. Further studies of these gene networks can produce translational information, leading to a better understanding of the initiation and progression of glioblastomas and perhaps introducing alternative treatment approaches for the disease.
Fig. 5. In silico drug sensitivity analysis of miRNAs. A) IC50 value of Irinotecan is positively correlated with with MIR155HG, MIR4325, MIR1234, MIR193A and negatively correlated MIR181B2. B) Selected miRNAs were also correlated with 17AAG (HSP90 inhibitor), Belinostat resistance (HDAC inhibitor), WZ3105 (multi kinase inhibitor), AP24534 resistance (multi-target inhibitor of Abl, PDGFRα, VEGFR2, FGFR1 and Src) and Talazoparib resistance (PARP inhibitor). ‘*’ indicates p < 0.05.
5. Experimental procedure 5.1. Ethics statement
This study was approved by the Institutional Review Board of Yeditepe University Hospital (No: 000274/2013), and written informed consent was obtained from all participants.
5.2. Sample collection
GBM tissue samples and healthy tissue samples were obtained from Department of Neurosurgery, Yeditepe University Medical School, Yeditepe University, Istanbul, Turkey from July 2013 to February 2015. Fifty GBM tissue samples and seven healthy tissue samples were used. Five of the seven healthy tissues were autologous tissues taken from corresponding patients in our tumor sample group. The other two were healthy brain tissues obtained from other brain surgery. Tissues were fresh frozen and preserved at −80 °C until RNA extraction. The
clinicopathological data was collected retrospectively. The follow-up time was calculated from the date of surgery to death or last check date (May 2016). GBM tissue samples that were pathologically defined as GBM and contained at least %50 tumor were included to the study. Samples lacking sufficient clinicopathological information or sufficient follow-up time were excluded from the study
Clinical information was collected for each sample, including de-mographic data, tumor location, and prognosis. (Supp. Table 1).
5.3. Cell cultures
A-172 and U-87 cell lines, available at ATCC: The Global Bioresource Center, were kindly provided by Koc University (Istanbul, Turkey). Cells were cultured in cultureflasks or well plates in DMEM and EMEM, respectively, containing 10% fetal bovine serum and 1% antibiotics. Normal Human Astrocytes were obtained from Lonza (Allendale, NJ) and grown with AGM BulletKit (Lonza). Human Fetal Astrocytes were obtained from ABM (Richmond, British Columbia, Canada), and grown in collagen-coated plates according to the manu-facturer’s protocol.
Cell lines were checked routinely for surface markers and molecular markers by using Sanger sequencing for short tandem repeats. Polymerase chain reaction-based mycoplasma kit was routinely used to screen for contamination.
5.4. Microarray analysis
Tissues were ground with liquid nitrogen, followed by the TRIzol (ThermoFisher Scientific) method, according to the manufacturer’s protocol, to obtain total RNA. Cell lines were harvested through the direct addition of TRIzol to proceed to total RNA isolation. Whole transcriptome expression profiling was done using Affymetrix Human Gene 2.1 ST Array Strip (Cat no: 902114, Affymetrix, Santa Clara, CA). miRNA microarray analysis was done with the Affymetrix miRNA 4.1 Array Strip (Cat no: 902404). The GeneAtlas system (Affymetrix) was used to hybridize, wash, stain and visualize the chips. The acquired data was analyzed with Transcriptome Analysis Console (TAC) 3 software (Affymetrix) and the DAVID online database.
Fig. 6. Spearman correlation between clinicopathological features and the level of selected miRNAs and genes: miR-25p with Age, NEGR1 with Age, TUSC3 with Age and TUSC3 with Tumor volume.‘p’ indicates significance and ‘r’ is the correlation coefficient.
Table 3
Correlation between the expression level of selected miRNAs and mRNAs with clinicopathological features.
Clinicopathological Features Molecule Name Low High Total p-Value
Olig2 TUSC3 Positive 25 21 0.0371 Negative 0 4 MGMT Status miR-21-5p Positive 23 12 35 0.0308 Negative 2 13 15 Recurrence NEFL Recurrence 6 1 7 0.0416 No Recurrence 19 24 43 P16 Status NEGR1 Positive 3 11 14 0.0117 Negative 22 14 36
Selected miRNAs and mRNAs were analyzed with the chi-square test for Gender, Olig2, MGMT status, Recurrence, WHO grade, p16 status. Significant results are shown here.
5.5. miRNA and mRNA expression levels
Levels of miRNAs of interest in glioblastoma tissues, control tissues, and cell lines were evaluated with real-time polymerase chain reaction (PCR) using miRNA primers obtained from Exiqon (Vedbæk, Denmark) after cDNA synthesis from total RNA samples, according to the manu-facturer’s protocol (Exiqon, Cat. No.: 203300). mRNA levels were measured with Taqman primers (ThermoFisher Scientific) after cDNA synthesis. Data was analyzed with the 2−ΔΔCtmethod. 5S RNA and GAPDH were used for normalization.
5.6. Anti-miRNA transfections
Cy3 Dye-Labeled anti-miR Negative Control #1 (Cat: AM17011, ThermoFisher Scientific) was used to test the ability of X-tremeGENE siRNA Transfection Reagent (Roche, Germany) to transfect glio-blastoma cell lines after 48 h. After validation, cells were transfected with anti-miRNA mimics (Ambion anti-miR miRNA Precursors PM: 114065) followed by total RNA isolation, miRNA reverse transcription and real-time PCR. The targeted miRNA levels were measured 48 h after transfection. Scrambled anti-miRNA molecules were used as the control group.
5.7. Apoptosis assay
BD Apoptosis Detection Kit (BD Pharmingen, San Diego, California) was used to detect early apoptotic cells (Annexin V + 7-AAD-) 48 h after transfection of antimiR-21-5p, antimiR-92b-3p, antimiR-182-5p and antimiR-339-5p according to the manufacturer’s protocol by using BD FACSAria III (BD Biosciences).
5.8. Trans-well invasion and migration assay
Transwell membrane inserts of 8.0 µm (Millipore, Burlington, Massachusetts) were used to evaluate changes in the invasion and mi-gration of transfected cells. Chambers were coated with 100 µl of 250 µg/ml Basement Membrane Matrigel (BD Biosciences) and
incubated overnight at 37 °C for the invasion assay. A172 and U-87 cells were transfected with antimiR-21-5p, antimiR-92b-3p, antimiR-182-5p and antimiR-339-5p. After 24 h of transfection, cells were de-attached with trypsin and 5x10⁴ cells were transferred into the upper chambers in 100 µl serum-free DMEM. The lower chambers filled with 1300 µl DMEM supplemented with %20 FBS and incubated for two days. After that, Inserts werefixed with %3.7 formaldehyde, permeabilized with methanol and stained with crystal violet. Inverted microscope was used to score.
5.9. In silico correlation analysis of miRNA expression and drug sensitivity To identify miRNAs whose expression correlates with drugs sensi-tivity, we utilized RNA-seq data obtained for glioblastoma cells lines from the E-MTAB-2706 (Klijn et al., 2015). Wefirst performed a linear correlation analysis between miRNA RPKM values and IC50 data gen-erated for irinotecan in 3 different cytotoxicity databases, CCLE (Barretina et al., 2012), CGP (Garnett et al., 2012) and gCSI (Haverty et al., 2016). miRNAs that showed a correlation (Pearson’s) of ei-ther greater than 0.6 or <−0.6 with IC50 values in all three databases, and which had a p value (Pearson’s) lower than 0.05 in at least one database were selected. We next tested whether miRNAs 21, 92B, 182 OR 339 expression in glioblastoma correlated with sensitivity to any of the drugs in the three databases mentioned above.
5.10. Statistical analysis
The one-way between-subjects ANOVA (unpaired) method was used to evaluate the microarray results. Real-time PCR data was analyzed by the 2−ΔΔCtmethod. Spearman’s two-tailed correlation test was used to determine correlations between tumor size and mRNA-miRNA levels, and miRNA and mRNA target levels. For other clinicopathological features, the two-tailed chi-square test was used. The calculation and interpretation of p values for functions and gene networks atTables 1 and 2was done with a right-tailed Fisher’s exact test. The overall sur-vival graphs were prepared by using Kaplan-Meier sursur-vival analysis with the Mantel-Cox test. All other statistical analyses were done using Fig. 7. Kaplan-Meier survival plots of our patient cohort. High and low miR-92-3p, miR-182-5p, NEFM and UNC13C groups were defined according to the relative expression levels, separated according to the median values.
student’s t-test. Differences with p values of < 0.05 were considered statistically significant. The high and low miRNA or mRNA expression groups of patients were separated according to the median expression level value. Significant outliers were detected and excluded from ana-lysis. For confirmation of survival analyses, miRNAs and mRNAs which are significantly associated with overall survival time in our cohort were also analyzed in online biomarker validation tools ( Aguirre-Gamboa et al., 2013; Aguirre-Aguirre-Gamboa and Trevino, 2014). Glio-blastoma data obtained from TCGA (The Cancer Genome Atlas) were analyzed using bioinformatics tools (TCGA data version: 2016_01_28). Acknowledgements
We would like to thank Julie Yamamoto for her editorial assistance. Funding
This work was supported by Yeditepe University Hospital, Istanbul. Availability of data and materials
The data discussed in this publication have been deposited in NCBI's Gene Expression Omnibus and are accessible through GEO Series ac-cession number GSE90604.
Authors’ Contributions
SG and MS carried out microarrays. Cell culturing andflow cyto-metry was done by ECT. Tumor samples and patient data were acquired by CKY and UT. SG and OFB performed the statistical analysis. SG, AK and ABD were involved in writing and editing the manuscript. BK, MWA and AOG performed In silico correlation analysis of miRNA ex-pression and drug sensitivity. SG, ABD and OFB and designed the study and providedfinancial support for this work. All authors read and ap-proved thefinal manuscript.
Competing interests
The authors declare that they have no competing interests. Appendix A. Supplementary data
Supplementary data associated with this article can be found, in the online version, athttps://doi.org/10.1016/j.brainres.2018.08.035. References
Aguirre-Gamboa, R., Gomez-Rueda, H., Martinez-Ledesma, E., Martinez-Torteya, A., Chacolla-Huaringa, R., Rodriguez-Barrientos, A., Tamez-Pena, J.G., Trevino, V., 2013. SurvExpress: an online biomarker validation tool and database for cancer gene expression data using survival analysis. PLoS One 8, e74250.
Aguirre-Gamboa, R., Trevino, V., 2014. SurvMicro: assessment of miRNA-based prog-nostic signatures for cancer clinical outcomes by multivariate survival analysis. Bioinformatics 30, 1630–1632.
Barretina, J., Caponigro, G., Stransky, N., Venkatesan, K., Margolin, A.A., Kim, S., Wilson, C.J., Lehar, J., Kryukov, G.V., Sonkin, D., Reddy, A., Liu, M., Murray, L., Berger, M.F., Monahan, J.E., Morais, P., Meltzer, J., Korejwa, A., Jane-Valbuena, J., Mapa, F.A., Thibault, J., Bric-Furlong, E., Raman, P., Shipway, A., Engels, I.H., Cheng, J., Yu, G.K., Yu, J., Aspesi Jr., P., de Silva, M., Jagtap, K., Jones, M.D., Wang, L., Hatton, C., Palescandolo, E., Gupta, S., Mahan, S., Sougnez, C., Onofrio, R.C., Liefeld, T., MacConaill, L., Winckler, W., Reich, M., Li, N., Mesirov, J.P., Gabriel, S.B., Getz, G., Ardlie, K., Chan, V., Myer, V.E., Weber, B.L., Porter, J., Warmuth, M., Finan, P., Harris, J.L., Meyerson, M., Golub, T.R., Morrissey, M.P., Sellers, W.R., Schlegel, R., Garraway, L.A., 2012. The Cancer Cell Line Encyclopedia enables predictive mod-elling of anticancer drug sensitivity. Nature 483, 603–607.
Birner, P., Pusch, S., Christov, C., Mihaylova, S., Toumangelova-Uzeir, K., Natchev, S., Schoppmann, S.F., Tchorbanov, A., Streubel, B., Tuettenberg, J., Guentchev, M., 2014. Mutant IDH1 inhibits PI3K/Akt signaling in human glioma. Cancer 120, 2440–2447.
Brennan, C.W., Verhaak, R.G., McKenna, A., Campos, B., Noushmehr, H., Salama, S.R., Zheng, S., Chakravarty, D., Sanborn, J.Z., Berman, S.H., Beroukhim, R., Bernard, B.,
Wu, C.J., Genovese, G., Shmulevich, I., Barnholtz-Sloan, J., Zou, L., Vegesna, R., Shukla, S.A., Ciriello, G., Yung, W.K., Zhang, W., Sougnez, C., Mikkelsen, T., Aldape, K., Bigner, D.D., Van Meir, E.G., Prados, M., Sloan, A., Black, K.L., Eschbacher, J., Finocchiaro, G., Friedman, W., Andrews, D.W., Guha, A., Iacocca, M., O'Neill, B.P., Foltz, G., Myers, J., Weisenberger, D.J., Penny, R., Kucherlapati, R., Perou, C.M., Hayes, D.N., Gibbs, R., Marra, M., Mills, G.B., Lander, E., Spellman, P., Wilson, R., Sander, C., Weinstein, J., Meyerson, M., Gabriel, S., Laird, P.W., Haussler, D., Getz, G., Chin, L., Network, T.R., 2013. The somatic genomic landscape of glioblastoma. Cell 155, 462–477.
Calmon, M.F., Jeschke, J., Zhang, W., Dhir, M., Siebenkas, C., Herrera, A., Tsai, H.C., O'Hagan, H.M., Pappou, E.P., Hooker, C.M., Fu, T., Schuebel, K.E., Gabrielson, E., Rahal, P., Herman, J.G., Baylin, S.B., Ahuja, N., 2015. Epigenetic silencing of neu-rofilament genes promotes an aggressive phenotype in breast cancer. Epigenetics 10, 622–632.
Chai, C., Song, L.J., Han, S.Y., Li, X.Q., Li, M., 2018. MicroRNA-21 promotes glioma cell proliferation and inhibits senescence and apoptosis by targeting SPRY1 via the PTEN/ PI3K/AKT signaling pathway. CNS Neurosci. Ther.
Chen, Y., Liu, W., Chao, T., Zhang, Y., Yan, X., Gong, Y., Qiang, B., Yuan, J., Sun, M., Peng, X., 2008. MicroRNA-21 down-regulates the expression of tumor suppressor PDCD4 in human glioblastoma cell T98G. Cancer Lett. 272, 197–205.
Cloughesy, T.F., Cavenee, W.K., Mischel, P.S., 2014. Glioblastoma: from molecular pa-thology to targeted treatment. Annu. Rev. Pathol. 9, 1–25.
Edgar, R., Domrachev, M., Lash, A.E., 2002. Gene Expression Omnibus: NCBI gene ex-pression and hybridization array data repository. Nucleic Acids Res. 30, 207–210. Garnett, M.J., Edelman, E.J., Heidorn, S.J., Greenman, C.D., Dastur, A., Lau, K.W.,
Greninger, P., Thompson, I.R., Luo, X., Soares, J., Liu, Q., Iorio, F., Surdez, D., Chen, L., Milano, R.J., Bignell, G.R., Tam, A.T., Davies, H., Stevenson, J.A., Barthorpe, S., Lutz, S.R., Kogera, F., Lawrence, K., McLaren-Douglas, A., Mitropoulos, X., Mironenko, T., Thi, H., Richardson, L., Zhou, W., Jewitt, F., Zhang, T., O'Brien, P., Boisvert, J.L., Price, S., Hur, W., Yang, W., Deng, X., Butler, A., Choi, H.G., Chang, J.W., Baselga, J., Stamenkovic, I., Engelman, J.A., Sharma, S.V., Delattre, O., Saez-Rodriguez, J., Gray, N.S., Settleman, J., Futreal, P.A., Haber, D.A., Stratton, M.R., Ramaswamy, S., McDermott, U., Benes, C.H., 2012. Systematic identification of genomic markers of drug sensitivity in cancer cells. Nature 483, 570–575. Haverty, P.M., Lin, E., Tan, J., Yu, Y., Lam, B., Lianoglou, S., Neve, R.M., Martin, S.,
Settleman, J., Yauch, R.L., Bourgon, R., 2016. Reproducible pharmacogenomic pro-filing of cancer cell line panels. Nature 533, 333–337.
Hegi, M.E., Diserens, A.C., Gorlia, T., Hamou, M.F., de Tribolet, N., Weller, M., Kros, J.M., Hainfellner, J.A., Mason, W., Mariani, L., Bromberg, J.E., Hau, P., Mirimanoff, R.O., Cairncross, J.G., Janzer, R.C., Stupp, R., 2005. MGMT gene silencing and benefit from temozolomide in glioblastoma. N. Engl. J. Med. 352, 997–1003.
Hung, K.S., Hong, C.Y., Lee, J., Lin, S.K., Huang, S.C., Wang, T.M., Tse, V., Sliverberg, G.D., Weng, S.C., Hsiao, M., 2000. Expression of p16(INK4A) induces dominant suppression of glioblastoma growth in situ through necrosis and cell cycle arrest. Biochem. Biophys. Res. Commun. 269, 718–725.
Huse, J.T., Brennan, C., Hambardzumyan, D., Wee, B., Pena, J., Rouhanifard, S.H., Sohn-Lee, C., le Sage, C., Agami, R., Tuschl, T., Holland, E.C., 2009. The PTEN-regulating microRNA miR-26a is amplified in high-grade glioma and facilitates gliomagenesis in vivo. Genes Dev. 23, 1327–1337.
India Project Team of the International Cancer Genome, C., 2013. Mutational landscape of gingivo-buccal oral squamous cell carcinoma reveals new recurrently-mutated genes and molecular subgroups. Nat. Commun. 4, 2873.
Kefas, B., Godlewski, J., Comeau, L., Li, Y., Abounader, R., Hawkinson, M., Lee, J., Fine, H., Chiocca, E.A., Lawler, S., Purow, B., 2008. microRNA-7 inhibits the epidermal growth factor receptor and the Akt pathway and is down-regulated in glioblastoma. Cancer Res. 68, 3566–3572.
Kim, H., Hwang, J.S., Lee, B., Hong, J., Lee, S., 2014. Newly identified cancer-associated role of human neuronal growth regulator 1 (NEGR1). J. Cancer. 5, 598–608. Klijn, C., Durinck, S., Stawiski, E.W., Haverty, P.M., Jiang, Z., Liu, H., Degenhardt, J.,
Mayba, O., Gnad, F., Liu, J., Pau, G., Reeder, J., Cao, Y., Mukhyala, K., Selvaraj, S.K., Yu, M., Zynda, G.J., Brauer, M.J., Wu, T.D., Gentleman, R.C., Manning, G., Yauch, R.L., Bourgon, R., Stokoe, D., Modrusan, Z., Neve, R.M., de Sauvage, F.J., Settleman, J., Seshagiri, S., Zhang, Z., 2015. A comprehensive transcriptional portrait of human cancer cell lines. Nat. Biotechnol. 33, 306–312.
Li, W.B., Ma, M.W., Dong, L.J., Wang, F., Chen, L.X., Li, X.R., 2011. MicroRNA-34a targets notch1 and inhibits cell proliferation in glioblastoma multiforme. Cancer Biol. Ther. 12, 477–483.
Louis, D.N., Ohgaki, H., Wiestler, O.D., Cavenee, W.K., Burger, P.C., Jouvet, A., Scheithauer, B.W., Kleihues, P., 2007. The 2007 WHO classification of tumours of the central nervous system. Acta Neuropathol. 114, 97–109.
Louis, D.N., Perry, A., Reifenberger, G., von Deimling, A., Figarella-Branger, D., Cavenee, W.K., Ohgaki, H., Wiestler, O.D., Kleihues, P., Ellison, D.W., 2016. The 2016 world health organization classification of tumors of the central nervous system: a sum-mary. Acta Neuropathol. 131, 803–820.
Luo, G., Luo, W., Sun, X., Lin, J., Wang, M., Zhang, Y., Luo, W., Zhang, Y., 2017. MicroRNA21 promotes migration and invasion of glioma cells via activation of Sox2 and betacatenin signaling. Mol. Med. Rep. 15, 187–193.
Molenaar, R.J., Verbaan, D., Lamba, S., Zanon, C., Jeuken, J.W., Boots-Sprenger, S.H., Wesseling, P., Hulsebos, T.J., Troost, D., van Tilborg, A.A., Leenstra, S., Vandertop, W.P., Bardelli, A., van Noorden, C.J., Bleeker, F.E., 2014. The combination of IDH1 mutations and MGMT methylation status predicts survival in glioblastoma better than either IDH1 or MGMT alone. Neuro Oncol. 16, 1263–1273.
Ohgaki, H., Kleihues, P., 2013. The definition of primary and secondary glioblastoma. Clin Cancer Res. 19, 764–772.
Pallud, J., Dezamis, E., Audureau, E., Devaux, B., Souillard-Scemama, R., Sanai, N., Page, P., Beuvon, F., Koziak, M., Oppenheim, C., Dhermain, F., Schlienger, M., Meder, J.F.,
Roux, F.X., Varlet, P., 2012. Neuronal immunoexpression and a distinct subtype of adult primary supratentorial glioblastoma with a better prognosis. J. Neurosurg. 117, 476–485.
Parsons, D.W., Jones, S., Zhang, X., Lin, J.C., Leary, R.J., Angenendt, P., Mankoo, P., Carter, H., Siu, I.M., Gallia, G.L., Olivi, A., McLendon, R., Rasheed, B.A., Keir, S., Nikolskaya, T., Nikolsky, Y., Busam, D.A., Tekleab, H., Diaz Jr., L.A., Hartigan, J., Smith, D.R., Strausberg, R.L., Marie, S.K., Shinjo, S.M., Yan, H., Riggins, G.J., Bigner, D.D., Karchin, R., Papadopoulos, N., Parmigiani, G., Vogelstein, B., Velculescu, V.E., Kinzler, K.W., 2008. An integrated genomic analysis of human glioblastoma multi-forme. Science 321, 1807–1812.
Patel, M., Vogelbaum, M.A., Barnett, G.H., Jalali, R., Ahluwalia, M.S., 2012. Molecular targeted therapy in recurrent glioblastoma: current challenges and future directions. Exp. Opin. Investig. Drugs 21, 1247–1266.
Pils, D., Horak, P., Vanhara, P., Anees, M., Petz, M., Alfanz, A., Gugerell, A., Wittinger, M., Gleiss, A., Auner, V., Tong, D., Zeillinger, R., Braicu, E.I., Sehouli, J., Krainer, M., 2013. Methylation status of TUSC3 is a prognostic factor in ovarian cancer. Cancer 119, 946–954.
Ramkissoon, S.H., Bi, W.L., Schumacher, S.E., Ramkissoon, L.A., Haidar, S., Knoff, D., Dubuc, A., Brown, L., Burns, M., Cryan, J.B., Abedalthagafi, M., Kang, Y.J., Schultz, N., Reardon, D.A., Lee, E.Q., Rinne, M.L., Norden, A.D., Nayak, L., Ruland, S., Doherty, L.M., LaFrankie, D.C., Horvath, M., Aizer, A.A., Russo, A., Arvold, N.D., Claus, E.B., Al-Mefty, O., Johnson, M.D., Golby, A.J., Dunn, I.F., Chiocca, E.A., Trippa, L., Santagata, S., Folkerth, R.D., Kantoff, P., Rollins, B.J., Lindeman, N.I., Wen, P.Y., Ligon, A.H., Beroukhim, R., Alexander, B.M., Ligon, K.L., 2015. Clinical implementation of integrated whole-genome copy number and mutation profiling for glioblastoma. Neuro Oncol 17, 1344–1355.
Ricard, D., Idbaih, A., Ducray, F., Lahutte, M., Hoang-Xuan, K., Delattre, J.Y., 2012. Primary brain tumours in adults. Lancet 379, 1984–1996.
Rivera, A.L., Pelloski, C.E., Gilbert, M.R., Colman, H., De La Cruz, C., Sulman, E.P., Bekele, B.N., Aldape, K.D., 2010. MGMT promoter methylation is predictive of re-sponse to radiotherapy and prognostic in the absence of adjuvant alkylating che-motherapy for glioblastoma. Neuro Oncol. 12, 116–121.
Sasayama, T., Nishihara, M., Kondoh, T., Hosoda, K., Kohmura, E., 2009. MicroRNA-10b is overexpressed in malignant glioma and associated with tumor invasive factors, uPAR and RhoC. Int. J. Cancer. 125, 1407–1413.
Shirazi, H.A., Grimm, S., Raizer, J., Mehta, M.P., 2011. Combined modality approaches in the management of adult glioblastoma. Front. Oncol. 1, 36.
Simon, M., Simon, C., Koster, G., Hans, V.H., Schramm, J., 2002. Conditional expression of the tumor suppressor p16 in a heterotopic glioblastoma model results in loss of
pRB expression. J. Neurooncol. 60, 1–12.
Smits, M., Nilsson, J., Mir, S.E., van der Stoop, P.M., Hulleman, E., Niers, J.M., de Witt Hamer, P.C., Marquez, V.E., Cloos, J., Krichevsky, A.M., Noske, D.P., Tannous, B.A., Wurdinger, T., 2010. miR-101 is down-regulated in glioblastoma resulting in EZH2-induced proliferation, migration, and angiogenesis. Oncotarget 1, 710–720. Song, H., Zhang, Y., Liu, N., Wan, C., Zhang, D., Zhao, S., Kong, Y., Yuan, L., 2016.
miR-92b regulates glioma cells proliferation, migration, invasion, and apoptosis via PTEN/Akt signaling pathway. J. Physiol. Biochem. 72, 201–211.
Trepant, A.L., Bouchart, C., Rorive, S., Sauvage, S., Decaestecker, C., Demetter, P., Salmon, I., 2015. Identification of OLIG2 as the most specific glioblastoma stem cell marker starting from comparative analysis of data from similar DNA chip microarray platforms. Tumour. Biol. 36, 1943–1953.
Ueda, R., Kohanbash, G., Sasaki, K., Fujita, M., Zhu, X., Kastenhuber, E.R., McDonald, H.A., Potter, D.M., Hamilton, R.L., Lotze, M.T., Khan, S.A., Sobol, R.W., Okada, H., 2009. Dicer-regulated microRNAs 222 and 339 promote resistance of cancer cells to cytotoxic T-lymphocytes by down-regulation of ICAM-1. Proc. Natl. Acad. Sci. U.S.A. 106, 10746–10751.
Veliz, I., Loo, Y., Castillo, O., Karachaliou, N., Nigro, O., Rosell, R., 2015. Advances and challenges in the molecular biology and treatment of glioblastoma-is there any hope for the future? Ann. Transl. Med. 3, 7.
Vogelbaum, M.A., Aghi, M.K., 2015. Convection-enhanced delivery for the treatment of glioblastoma. Neuro. Oncol. 172 (Suppl), ii3-ii8.
Wakimoto, H., Tanaka, S., Curry, W.T., Loebel, F., Zhao, D., Tateishi, K., Chen, J., Klofas, L.K., Lelic, N., Kim, J.C., Dias-Santagata, D., Ellisen, L.W., Borger, D.R., Fendt, S.M., Vander Heiden, M.G., Batchelor, T.T., Iafrate, A.J., Cahill, D.P., Chi, A.S., 2014. Targetable signaling pathway mutations are associated with malignant phenotype in IDH-mutant gliomas. Clin. Cancer Res. 20, 2898–2909.
Xue, J., Zhou, A., Wu, Y., Morris, S.A., Lin, K., Amin, S., Verhaak, R., Fuller, G., Xie, K., Heimberger, A.B., Huang, S., 2016. miR-182-5p Induced by STAT3 activation pro-motes glioma tumorigenesis. Cancer Res. 76, 4293–4304.
Yang, C.H., Yue, J., Pfeffer, S.R., Fan, M., Paulus, E., Hosni-Ahmed, A., Sims, M., Qayyum, S., Davidoff, A.M., Handorf, C.R., Pfeffer, L.M., 2014. MicroRNA-21 promotes glio-blastoma tumorigenesis by down-regulating insulin-like growth factor-binding pro-tein-3 (IGFBP3). J. Biol. Chem. 289, 25079–25087.
Zheng, Q., Han, L., Dong, Y., Tian, J., Huang, W., Liu, Z., Jia, X., Jiang, T., Zhang, J., Li, X., Kang, C., Ren, H., 2014. JAK2/STAT3 targeted therapy suppresses tumor invasion via disruption of the EGFRvIII/JAK2/STAT3 axis and associated focal adhesion in EGFRvIII-expressing glioblastoma. Neuro Oncol. 16, 1229–1243.