A. O. Ver. Fak. Derg. 36 (J): 21:-225, 1989
MEASCREMENT OF üREA KINETTCS WITH A SINGLE INJECTION OF ["C)-UREA CSIl'iG A TWO.-COMPARTMENT MODEL IN SHEEP'
Ahmet Öncüer]
Koyunlarda Üre kinetiğinin C" işaretli iirenin tck enjeksiyonu ve iki kompartman modeli kullanarak ölçiilmesi
Üzet: Bu çaltşJI1uda rumeli kanülii takTImış 4 dişi koyun kul/ml/Idı. Bütün hayvanlar tamamen mide içi ilıluzyon ile beslendiler. Ore kaybol-ma oral1/ ve üre kütle boyutu, [14C] - ürenin dakaybol-mar içi tek enjeksiyonu ile ve plazma üre spesifik aktivitesinden tahmin edildi. Üre parçalanması ile üre kaybolma oram arasmda yak m ilişki hulundu. Fakat plazma üre veya rumen amonyak konsantrasyonu ile ilişkisi saptanamadı. Ca!tşma-da normal beslenenlerin üre metaholizması arasmda fark olmadığı ve mide içi infüzyon metodunun konak hayvanlarııı üre metabolizmaS1/;-daki rol/erinin araştmlmasmda uygun bir yiintem olarak kulla1lllabile-ceği sonucuna vanldı.
Summary: Four fenıale sheep Hiith a rumen cannıtla were used in
this study. A LI animals ıı"ere nurislıed whol/y by iııtragastric in[usion of nutrients. Vrea irreversihle loss rate (iLR) and urea pool si;:e were esri-mated Fom the deC!ine ilı speciji'c"actil'iry of plasma ıırea a/ier a single intravenous it!jection of [14C
1 -
urea. Urea degradation lFas significall1ly related to iLR bllt was not related to plasma urea or rumen NH,ı coll-centration. It is conc!uded that there are no major d(flerences in the pro-cess of urea metabolism between norl1laly fed sheep and those nourished by intragastric infiısion. Sheep nourished by ilıfusion would appear to he suitable mode/~' for invesrigating the role of the host-animal in tire control of urea recyding.Introduction
Urea İs not only a sinıple waste product of nitrogen metabolisın but also an important precursor of protein biosynthesis (5). Ammo-i. This würk was carricd oul in the Rowett Research i'1slilutc.
21.1 AHMET öNeüER
nia can be absorbed from the digestive system where formed in exccs-sive quantities and enhance formatian of urea, or it can be derived
from urea of blood plasma when its formation from fecd sources is
smaIL. In this \Vay ruminants conserve nitrogen when dietary supplies are low by utilising endogenous urea via mierobial protein synthesis (7). A major problem in identifying the control mechanisl11s involved in urca recyeling in ruminants is that of separating those factors which deriye from the activity of rumen mieroorganisms and those which are specific attributes of host-animal metabalism. The system of total intragastric nutrition (I I) appeared to offer a method whereby urea ınetabolism could be examined under controlled, Steady-State condi-tions and without the complicacondi-tions which ensure from the presence
of an active rumen microbial population. The tracer method can be
used to investigate eertain properties of large populations of atoms or molecules (the tracee) by making observation of the behaviour of smaIl nunıbers of tracer atom s or molecııles. Jn principle and practicc both stable and radioactive ısotopes can be eqııally sensitive as tracers. However, to achieve high sensitivity with stable isotopes [15N] very expensive mass spectrometric eqııipment is required, whereas radioiso-topes can be measured with equal sensitivity in relatively cheap scintil-lation spectrometers and with analytieal methods also simpler than 15N. Urea metabolism can be measured in vivo using either a single iııjeetion of isotope or continuous infusion.
The objective of this study was to measurement of various para-meters of urea kİneties in sheep nourished by intragastric infusion. it was estimated from the decline in specific activity of plasma urea after a single injeetion of [ He] - urea into jııgular vein.
Before considering the method used for Studying the kinetics
of urea metabolism it is convenient to deseribe briefly the various terms used in vivo studies employing isotopic tracers. The faIlowing list
con-form to the recommendation made by Nolan et ai. (9).
Traeee: The defined substance whose movement and behaviour
in the system is under study.
Tracer: The defined substance, labelled (e.g. by use of isotopes) so that its movement and behaviour in the system can be studied.
Pool size: The total mass oftracee distributed through all compart-meııs \Vithin the biologieal system.
KOYUNLARDA ÜRE KİNET1GiNİN cı' KULLANILARAK ÖLÇÜLMESt ~J.;
Space: The apparent yolume of distribution of the tracee in the pool (i.e. in the biological system).
Total entry rate (Flux-rate): The ratc mass ıunit time at "...hich aIl tracee enters and leaves a compartment which is in steady state. This parameter may be divided into:
Irreversible loss rate (ILR): a fractionel f1ux-ralc which leaves the compartment and does not return to it during the experimental period.
Recycling rate: a fractional f1ux-rate which leaves the com part-ment and returns to it during the experiıııental period.
Urea degradation rate: Measured as the difference between ILR
anel total urea excretion in the urinc. This is taken to be the quantity of urea which is hyurolysed to eoc -1- NH, within the digestive tracL The above parameters can be described diagranıatically.
r
ı
Material and :\1ethods
Four female lanıbs were used in this experiment. They \\-ere
housed indoors in mdabolism cretes under conditions of continuoııs lighting and constant ambient temperature. AII sheep were prepared with rumen cannulas and abomasal infusion catheters. Af ter surgery recovery aıı lambs were nourished whoIly by intragastric infusion of volatile fatty acids, buffers, minerals and casein .( II) Feeding provided sufficient energy for maintenance anel total n itrogen intake were 6.71 g
Id.
The body urea pool \Vas labeIled with a single intravenous injec-tion of [ 14C] - urea to study changes in urea pool size, irreversible lass rate (ILR) and degradation rates.
?16 AHMET ÖNCÜER
All animals were weİghed and prepared with jugular catheter on the day before the experiment, and a syringe was prepared containing [14C] -- urea in LO ml isotonic sterile salİne (0.9
%
NaCl) to give a dose of 50 !Lcion the day of injection the fuJI syringe was weighed andpre-dose blood and urine sample were taken. The [14C] - urea \Vas
injected at the same time and approximately at the same speed to all animals. The syringe was then disconnected, the dose "washed in" with LO ml saline containİng 50 iu
ımı
heparin, and the empty syringe was the re-weiglıed to calculate the precise dose injected.A total of
ı
5 blood samples (8 ml) were taken from each anima! at frequent intervals over the first 2 hours and then decreasing interva!s up to 24 hours. Urine saınples were collected over 6, 6 an 12 hour in-tervals. On the same day rumen samples(40 nıl) were taken from eaclı animal at intervals for nıeasurement of pH, osmotic pressure, ureaseactivity and ammonia. Blood samples were centrifuged soon af ter
withdrawal and the plasma stOl'ed at 20
oc
until analysed for urea concentration and for specific activity (SA) of urea.The kinetics of urea metabolism in lambs were assumed to
con-form to a two-compartment model, consisting of a main pool and a
side pool (13).
This model, in which the plasına represents the primary pool,
is similar to that adopted by Bruckental et aL. (I) The observed values for plasma urea SA were first norl11alized by dividing each by the in-jected dose of radioactivity and the Maximum Likelihocd Programme of Ross (I 2) was used to establish the parameters of the double expo-nential curve which best fitted the decline in plasına SA with time.
Urea pool size and i LR from the plasma urea pool were estimated from the parameters of the exponentials using the relationships given by Nolan & Leng (10). it was assumed that the quantity of 14C
recyc-led to urea foIlowing urea degrada tion is negligible and that the iLR ofurea-C as estimated with İs alsa an estimate of total f1ux of urea out of the body urea pool. Urea degradation rate was taken to be the difference between urea 1LR and the rate of excretion of urea in urine. Urea space was calculated as urea pool size (mg) -:- plasma urea con-centratian (mg
I
L) and expressed as a percentage of bodyweight (L! kg): it represents the theoretical volunıe of distribution of the body urea po ol on the assumption that urea is an equlibrium throughoutKOYUNLARDA ÜRE KİNETiGiNiN Cil KULLANILARAK ÖLÇÜLMESi 217
Blood samples were obtained from each animal via jugular vein
catheter. On the day of [14C]-urea injection, blood sampJes (8 ml)
were withdrawn into tubes containing concentrated heparin solution.
Tubes centrifuged for LO min at 2000 g and 3 ml plasma removed
then StOl'ed at .20°C until they \vere used. coııected urine volun~e
was weighed, sampled and Stored at -20 oC until analysed. Rumen
Samples (IO ını) were taken routinely twice a dayand on the day of
injection, 6 sanıples (40) ml) were taken over 24 hours.
For urea in urine and plasma samples wcre determined by the
automated nıethods of Marsh et aL. (8) Ruınen ammonia was analysed
by the method described by Fawcett ..- Scott (4). Rumen f1uid urease
activity was measured by production of NH, from urea at 37°C (3).
Radioactivity in plasnıa was measured by liquid scintiııation counting
(Tri-Carb 460 C, Packart. instrunıent Company Ltd): i ml sampk
was mixed with iO ml of commercial Scintiııation cocktail (N E 265,
Nuclear Enterprises Ltd.,) and the count rate correeted for quenehing by use of automatic external stardard. Radioisotope was obtained from
Amersham International plc, and diluted with non-radioactive urea
in sterile isotonic saline to give a solution for injection which contained 5 [Lci/ ml and 8 [.Lci/ mg urea.
The various indices of urea metabolism measured in this
experi-ment were examined by regression analysis.
Results and Dİscussİolı
Nitrogen, Energy intakes, nımen ammonia concentration and
urease activity are given Tablc I. The parameters of urea metabolism (Urea irreversible lass rate, urea pool size, urinary urea excretion and
plasma urea and urea degradation) measured by isotope dilution using
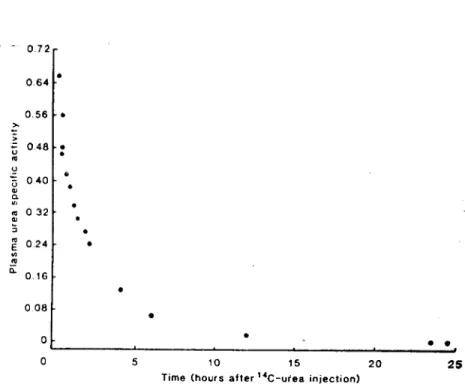
a single injection of [14C ]-- urea are given in Table 2 and typical
example of the decline in specific activity (SA) of plasma urea with
time, from which the varİous parameters of urea metabolism were
derived, is shown in Fig. I.
Urea iLR showed a mean overaıı value of 16.5 g / d (SE::: 0.97). Urea pool size was on 2.47 g urea equivalent to a theOl'etical mean urea "space" amounting to 57.8
%.
The various indices of urea metabolism mcasured in this
İnterrelatiollS-Table I. Nitrogen and Energy intake. rumen ammania concentraıian and rutncn urease activity of sheep (nıean value of 4 Shcep)
Rumen
i
Rumen ostomıc Rumcil ammonia RumenPH Pressure coııcentration activity
(mosmal! kgl (mg! 100 ml) (mmol! ml! min)
- ~;54
-1---
227----.--10.1;;---
-0-.2-2---
1 "Metabalic bodywcight. :o :> :ı::s:
1""1 -iTable 2. Various parameıcrs of urea kinetiı's 0f sl~e~p. (mcan value of 4 Sheep) Mean Liveweight (kg) :16.83 ~ Metabalic bodyweight Mean" Liveweight (kg' .•:,) 14.94 Plasma Urea Cüncentration (mgi100 ml) 11_77 Urine Urea excretion (g!d) 9.27 Urea degradation (g! d) 7.26 Urca poal size (g) 2.47 Urea spare (:;;, liveweig1ıı) 57.8 ,-... ,",' 'z !J c: m ;N
KOYUNLARDA ÜRE KiNFTj(jiNiN C" KULLANll.ARAK ÖLÇÜLMESi 219
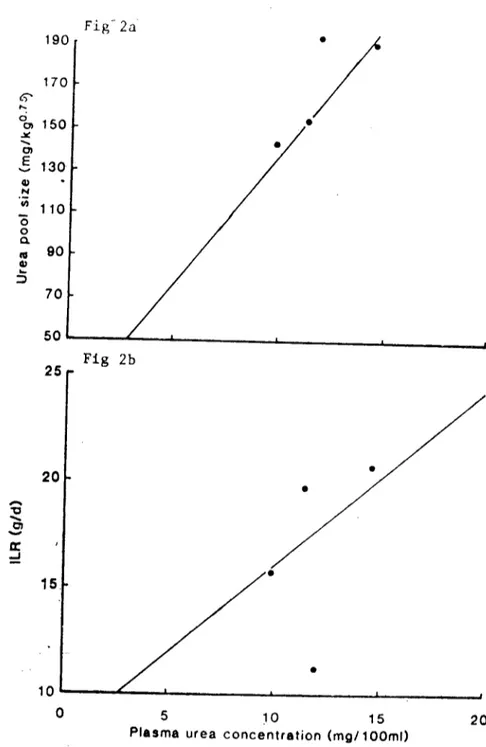
hips. Those variables showing signifieant regression relationship are
shown in Fig. 2.
A highly signifieant relatianship was deteeted between urea pool size (ıng/ kg o'/S) and plasına urea concentration (ıng/ 100 ını) (P< 0.001). Soıne of those variables showed significant relationships (Fig 2) with plasına urea concentration and sen'c to demonstrate the cent-ral role of plasma urea concentration as an index of urea metabolism. The question arises as to the usefulness of measuring urea
concentra-•
•
-072•
064 0.56•
>-> u 048 • ILI • ~ Q Ö 040•
ol cl. u, • ILI 032 ol :; • ILI 024•
E '" ~ a. 0.16•
008 O O 5 10 15 20Time (hours after 1.C-urea injeclion)
•
•
25
Fig. ı.Typical coınputer fiUcd curve of the dediııe in specificity of plasına urca with time afıcr "C-uı'ea injecıioıı. Specific acıivity is expresscd as iJ.ci> LO' j ıng urca divided by ıhe total dose injected (norınally 50 :J,ci). The fittcd dolıble-exponcl1ıial eqııation in this
exaınp-le was:
Fig-2a 190
/
170 c:;-": o 150•
ol .ıı: ... ol.5
130 Gl N CIL 110 Ö o a. LG 90 Gl...
::J 70 50 25 Fig 2b 5 10 15Plasma urea concentration (mg/ 1COml)
20
-..
~...•
cl-
a: ..J•
15. 10 O•
20Fig. 2. The regression rclaıionship between the variabies, with plasma urea concentration (ıng / 100 ını), rumcn ammonia (mg /100 ml), and irreversible loss rate (g / d) being the
independent variables (x) were:
Fig. 2a: y = 12.22 (:LL.95)x . 15.32 r - 0.89, RSO ~ 15.79 P<O.OOI 2b: y =0.82 (:1:0.351)x ,- 7.83 r =0.59, RSO =2.85 P<O 05
KOYUNLARDA ÜREKİNETi(';INiN C" KULLANILARAK ÖLÇÜLMESi 221 FIg C 15 •...•. .-0 ...• ciL •... c: o 10
-
CIL•..
(,) )( CIL ~ Q)•..
5 ::ı >-•... til c: •... ::> Fig ?d 15 c: o til '-c: •••... 10•
Cıl-t> E c o 00 t>~.,
... i ol•
z ~E 5 c CIL E ::ı cc O 5 10 15Plasma urea concentration (mg/1 DDml)
20
ITc:y = 0.294 (:!c0.123)x -i- 5.51 r =0.60, RSD =1.00 P<0.05 2d: y =0.595 C:,:0.250)x -- 4.08 r =0.59, RSD =2.09 P<0.05
222 AHMET ÖNCÜER Fig e 25 20 10 15 ILR (g/d) 5
o
5 10 15 20ıs
.•... "o •... ol """ ~ O 5 10 15 20 ltRumen NH, conce ntratio mg/IDD ml
"o til ~ ol Fig
2r
"
"o 20•
.,
•..
:> 15/
,,-10•
2e:y ~.0.850 L.0.282)x .,. 0.93 r - 0.69, RSO =2.311'<.0.05KOYUNLARDA ÜRE KiNETiCINiN C" KULLANILARAK ÖLÇÜLMESi 223
tion if plasma for the predietion of urea metabolism; Variable findings obtained from various studies of urea metabolism suqqest that thesc
values for predietive purposes may be limited (5).
The regression relationships whieh were observed in the. presenf experiment were similar to those observed by Whitelaw et al (unpub-lished) in a eomperative study of totally infused and eonventionally
fed sheep. .
Although we did not observe any relationship between plasma
urea eoneentration and degradation rate of urea, these two parameters ha ve previously been shown to be c10sely related in eonventionally fed rııminants.
Regression ha ve been, linear between amount of urea degrated İn the body and plasma urea eoneentration elevated by intravenous infLlsion (6).
Also, a high energy diet resulted in a deerease of urea
eoneent-ration in plasma and an inerease in urea degradation (5).
In the present experiment of urea degradation and irreversible loss rate of urca highly eorrelated and it seems likely that irreversible loss rate was a major determinant of the extent of urea degradation (r=0.94;
p <0.001) in animals nourished by infusion:
The implieation of these findings is that degradation rate in the animals increases with increasing flow of urea through the body pool and suggests that simple diffusion may aocount for a large proportion of urea transfer from the blood to the gastrointestinal tract.
A hypothesis that the rate of urea entery into the rumen across the rumen epithelium is deereased as a results of reduced expression of urease aetivity eaused by inereasing rumen ammonia coneentrati-ons at the epithelial-adherent mierobial interfaee hasbeen proposed by Cheng & Wallaee (2). Sinee urease exist only in the degestive tract, the rate of degradation represents the rate of movement of ureainto the areas of baeterial growth, and so is an indieator of the potential for ııtilisation forprea nitrogen for bacterİal synthesis. In the present
experiment extremely variable urease and absenee of relationship
bctween urea degradation rate and urease aetivity eould not support the theoriesof urease activity in the mechap.ism of urea transfer to the gastrointestinal traet.
224 AHMET ÖNCÜER
There is, however, the anomaly of significant relationship being observed between the urea degradation rate and runıen ammonia con-centration in the present experiment. This might indicate that rumen
ammonia concentration influences degradation by a mechanism which
does not involve urease activity. It nıight also be explained if degra-dation rather than rumen ammonia concentration was the independent variable, such that inereasing concentrations of ammonia simply ref-lect inereasing amounts of urea reaching the rumen by diffusion, as suggested above.
Acknowledgement
i am very grateful to professor James, Director of the Rowett Research Institute, for providing the facilities for this work. My thank to the IAEA for the financial support and the Turkish Atomic Energy Authority for giying mc the opportunity to complete this work.
Refer"•••ces
ı, Bruckental, I., Oldham J.O. and Sutton J.O. (J 980): Glucose aııd ıırea k illl'ıics' iııcoll'.I'
iıı early lacf{/tioıı. Br. J. Nutf. 44. 33.-45.
2. CliCIIll,K.J. and WaJlace, R.J. (1979): The lııedlani.l'lII of passage of eııdogl'lIolıS Iıl'ea ıhml/gh the mmeıı 1I'all and the role olııreol)'ıie epiıhelial haeıeria iıı ıhe Iıl'eo tlııx. Br.
J. Nutr. 42. 553~557.
3. Cook, R.R. (1976): Ureos'e aelirily in the milieli o/'lhe .I'heep aııd ıh(' isolarioıı o(aıeolyTie aCTMTy. J. Gen. Microbiol. 92. 32.. 48.
4. Fawcett, J.K. and Scott, J.E. (i960): A rapid and pıeci.l'e meThod/i)1' the deTerıııiııoriolı of ıırea. J. Clin. Path. 13, 156-159 .
.5, Herme,'er, J. and Martens, H.(1980): Aspect.l' of /LI'('amerabolisııı iıı ıhe ruıııinallTs ,•.iTh ıefereııce lo The goat. J. Dairy Sei. 63, 1707- ı728.
6. Houpt, T.R. and Houpt, K.A. (1968): Tramler of ııl'ea niTmg('// alTO.l'S The /'//11lelı lFa/l.
Am. J. Physiol. 214. 1296.
7. Kenned)', P.M. and Milligan, L.P. (1980): The degl'llda(i<J1I tIIıd
lIlili~a(i<J1Io/eııdogell<J-11.1' ıırea in the ga.l'troinresTiııal Tract iıı /'/ImiııallTs. Can. J. Anim. Sei.. 60. 205, ..221.
8 i\lursJı, W.H., Flngerhut.8. and MıJler H,. (1965): Dett'rminarioıı olurl'lı iıı /IrinI' and .I'e/'lllll. Clin. Chem. II. 624-.(,27.
9. Nolan, J. V., Norton, W.B. and Lcııg, R.A. (J 972): Dyııaıııic aSpl'CTS of nirrogeıı meTaba-/i!;m in sheep. In: Traeer studies on Non-protein nitrogen fOf Ruminants, pp. 13-24.
KOYUNLARDA ÜRE KINETİCİNİN Ci' KULLANILARAK ÖLÇÜLMESİ 223
LO. Nolan, J.V. and Leng,R.A. (1974): Symposiııııı 011tral'er tec!ıııiques iııııutr;t;oıı isotope tec!lIliqııes for stııdyiııg tlıe d)"fIO/Ilirsof ııitrogeıı /Ilf!labo/is/lliııI'lımiııal1ts. Proc. Nutr. Sac. 33, 1--8.
II. Orskoı', E.R., Grubb, D.A., Wenham, G. and Corrlgall, W. (1979): Tlıe susleııalll'e of grOll'ilıg aııd fat teııiııg mmiııal/fs by intragastril' iI,filsiolıai"o/atile fafty acidf 0ı1dpro-teiıı. Br. .I. Nutr. 41, 553 558,
12. Ross, G••J.S. (1980): Maximum Iikclilıood Progra/llıııe. Version 3.07. Lawes
Agricul-tural trust, Rothamstcd Expcrimcntal Station, England.
13. Shipley, R.A. and Clark, R.F:. (1972): Tracer Metlıodffor iii Viı'o Kiııeıirs. Academic Press, New York.