EUROPEAN ORGANIZATION FOR NUCLEAR RESEARCH (CERN)
CERN-EP-2018-277 2019/01/25
CMS-SUS-17-012
Search for supersymmetry in events with a photon, a
lepton, and missing transverse momentum in
proton-proton collisions at
√
s
=
13 TeV
The CMS Collaboration
∗Abstract
Results of a search for supersymmetry are presented using events with a photon, an electron or muon, and large missing transverse momentum. The analysis is based on a data sample corresponding to an integrated luminosity of 35.9 fb−1of proton-proton collisions at√s=13 TeV, produced by the LHC and collected with the CMS detector in 2016. Theoretical models with gauge-mediated supersymmetry breaking predict events with photons in the final state, as well as electroweak gauge bosons decay-ing to leptons. Searches for events with a photon, a lepton, and missdecay-ing transverse momentum are sensitive probes of these models. No excess of events is observed beyond expectations from standard model processes. The results of the search are interpreted in the context of simplified models inspired by gauge-mediated super-symmetry breaking. These models are used to derive upper limits on the production cross sections and set lower bounds on masses of supersymmetric particles. Gaugino masses below 930 GeV are excluded at the 95% confidence level in a simplified model with electroweak production of a neutralino and chargino. For simplified models of gluino and squark pair production, gluino masses up to 1.75 TeV and squark masses up to 1.43 TeV are excluded at the 95% confidence level.
Published in the Journal of High Energy Physics as doi:10.1007/JHEP01(2019)154.
c
2019 CERN for the benefit of the CMS Collaboration. CC-BY-4.0 license
∗See Appendix A for the list of collaboration members
1
1
Introduction
The search for supersymmetry (SUSY), a popular extension of the standard model (SM) of par-ticle physics, is a central piece of the physics program at the CERN LHC. Models utilizing a general gauge-mediated (GGM) SUSY mechanism [1–6], with the assumption that R parity [7] is conserved, often lead to final states containing photons and significant transverse momen-tum imbalance [8–15]. Final states with an additional lepton enhance the sensitivity to the elec-troweak (EW) production of SUSY particles, making signatures with both leptons and photons an important part of the SUSY search program at the LHC.
In GGM SUSY models, the lightest SUSY particle (LSP), taken to be the gravitino eG, is both stable and weakly interacting. It escapes detection, leading to missing momentum in the event. Except for direct LSP pair production, each produced SUSY particle initiates a decay chain that yields the next-to-lightest SUSY particle (NLSP) decaying to the LSP. The signature of the event depends sensitively on the nature of the NLSP. In most GGM models, the NLSP is taken to be a bino- or wino-like neutralino or a wino-like chargino, where the bino and wino are the superpartners of the SM U(1) and SU(2) gauge particles, respectively. Typically, a neutral NLSP χe
0 will decay to a photon or a Z boson, while a charged NLSP
e
χ± will produce a W
boson, where both vector bosons can decay leptonically.
In this paper, the results are presented of a search for SUSY in events with one photon γ, at least one lepton`(electron or muon), and large transverse momentum imbalance. This signa-ture suppresses many SM backgrounds, avoiding the need for additional requirements such as associated jet activity. This makes it possible to include events with low jet activity, increasing the sensitivity to SUSY scenarios with EW production, in which the absence of colored SUSY particles in the decay chain leads to lower final-state jet activity in these models.
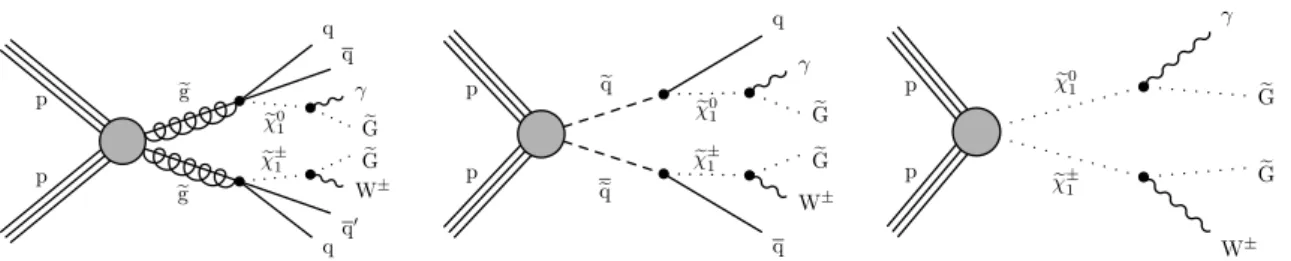
The data sample corresponds to an integrated luminosity of 35.9 fb−1 of proton-proton (pp) collision data at √s = 13 TeV, collected with the CMS detector at the LHC in 2016. Similar searches with a photon plus lepton signature were conducted by the ATLAS [16] and CMS [17, 18] experiments at √s = 7 and 8 TeV. Searches for SUSY in GGM scenarios have also been conducted in the single-photon [19, 20] and two-photon [21] channels at√s=13 TeV. None of these analyses observed any significant excess of events over their respective SM predictions. This paper improves the sensitivity of the previous CMS result obtained at√s=8 TeV [22]. The diagrams in figure 1 provide examples of the decays studied in this analysis. Simplified models [23] are used for the interpretation of the results. The three simplified models consid-ered are denoted as T5Wg, T6Wg, and TChiWg, where T5Wg assumes gluino (eg) pair produc-tion, T6Wg squark (eq) pair production, and TChiWg the direct EW production of a neutralino and chargino. For simplicity, we assume theχe
0and
e
χ±are mass-degenerate co-NLSPs and are
therefore produced at equal rates. The decay of the NLSP χe
± (
e
χ0) produces a gravitino LSP
with a W± (γ). We assume a 50% branching fraction to either theχe
0 or the e χ± in the decays e g → qqχe 0/ e χ±andeq → qχe 0/ e
χ±, and 100% branching fractions for the decaysχe
0 →
γ eG and
e
χ± →W±G.e
The paper is organized as follows. In section 2, we describe the CMS detector used to collect the data. The data samples and object definitions used in the analysis are described in section 3, and the details of the event selection are given in section 4. The methods for estimating the backgrounds in the analysis are discussed in section 5, the systematic uncertainties in section 6, and the results in section 7. Conclusions are summarized in section 8, including our exclusion limits in the simplified-model framework.
p p eg eg e χ01 e χ±1 qq ′ W± e G e G γ q q p p eq e q e χ01 e χ±1 q W± e G e G γ q p p χe01 e χ±1 W± e G e G γ
Figure 1: Diagrams showing the production and decay modes of the signal models T5Wg (left), T6Wg (center), and TChiWg (right) considered in this analysis.
2
The CMS detector
The central feature of the CMS apparatus is a superconducting solenoid with an internal diam-eter of 6 m, providing an axial magnetic field of 3.8 T. Within the solenoid volume are several subdetector systems, each composed of a cylindrical barrel closed by two endcaps. At the core is a silicon pixel and strip tracker, providing a precise measurement of the trajectories of charged particles. The energy of photons and electrons is measured by a lead tungstate crys-tal electromagnetic calorimeter (ECAL), covering the pseudorapidity range|η| < 1.479 in the
barrel and 1.479 < |η| < 3.0 in the endcap. Surrounding the ECAL is a brass and scintillator
sampling hadron calorimeter (HCAL) with|η| < 3.0 coverage. Forward calorimeters extend
the calorimeter coverage up to |η| = 5.0. Muons are measured in gas-ionization detectors
embedded in the steel flux-return yoke outside the solenoid.
In the barrel section of the ECAL, an energy resolution of about 1% is achieved for unconverted and late-converting photons with transverse momentum pT ≈ 10 GeV. The remaining barrel
photons have a resolution of about 1.3% up to|η| <1.0, rising to about 2.5% for|η| =1.4 [24].
The electron momentum is estimated by combining the energy measurement in the ECAL with the momentum measurement in the tracker. The momentum resolution for electrons with pT ≈
45 GeV from Z→e+e−decays ranges from 1.7 to 4.5%. It is generally better in the barrel region than in the endcaps, and also depends on the bremsstrahlung energy emitted by the electron as it traverses the material in front of the ECAL [25].
Muons are measured in the range|η| <2.4, with detector elements based on three technologies:
drift tubes, cathode strip chambers, and resistive plate chambers. Matching muons to tracks reconstructed in the silicon tracker results in a relative transverse momentum resolution, for muons with pT up to 100 GeV, of 1% in the barrel and 3% in the endcaps. The pT resolution in
the barrel is better than 7% for muons with pT up to 1 TeV [26].
A detailed description of the CMS detector, together with the definition of the coordinate sys-tem used and the relevant kinematic variables, can be found in Ref. [27].
3
Object reconstruction and simulated samples
Physics objects are defined using the particle-flow (PF) algorithm [28], which aims to recon-struct and identify each individual particle in an event via an optimized combination of in-formation from different elements of the CMS detector. The PF candidates are classified as photons, charged hadrons, neutral hadrons, electrons, or muons. The PF method also allows the identification and mitigation of particles from additional pp interactions in the same or adjacent beam crossings (pileup).
pho-3
ton candidates from electrons, photon objects are rejected if a matching pixel detector track segment from the silicon tracker is identified. Photon candidates used in this analysis are iden-tified with a set of loose quality criteria with an average selection efficiency of 90%. We require such photon candidates to be associated with an energy deposit in the HCAL having no more than 6% of the energy deposited in the ECAL, and a shower shape in the η direction consistent with that of a genuine photon. In addition, the photons are required to have more than 50% of their cluster energy deposited in the 3×3 array of crystals centered on the most energetic crystal.
To further suppress the misidentification of hadrons as photons, a PF-based isolation require-ment is imposed. The isolation variable is calculated by summing the magnitude of the trans-verse momentum of all PF charged hadrons, neutral hadrons, and other photons within a cone of ∆R ≡ √(∆η)2+ (∆φ)2 = 0.3, where φ is the azimuthal angle in radians, around the
can-didate photon direction. We required this variable not to exceed fixed values that are set to achieve a desirable balance between identification efficiency and misidentification rate. The photon object that is being identified is not included in the isolation sums, and charged hadrons are included only if they are associated with the primary pp interaction vertex. The recon-structed vertex with the largest value of summed physics-object p2Tis taken to be the primary pp vertex. The physics objects are the jets, clustered using the jet-finding algorithm [29, 30] with the tracks assigned to the vertex as inputs, and the associated missing transverse momentum, taken as the negative vector pTsum of those jets.
Electrons are found by associating tracks reconstructed in the silicon tracker with ECAL clus-ters. The electron candidates are required to be within the fiducial region of |η| < 2.5, where
the tracker coverage ends. Identification of electrons is based on the shower shape of the ECAL cluster, the HCAL-to-ECAL energy ratio, the geometric matching between the cluster and the track, the quality of the track reconstruction, and the isolation variable. To enhance the identi-fication efficiency, the isolation variable is calculated from the transverse momenta of photons, charged hadrons, and neutral hadrons within a∆R cone whose radius is variable depending on the electron pT[31], and which is also corrected for the effects of pileup [32].
The reconstruction of muons is based on associating tracks from the silicon tracker with those in the muon system. A set of muon identification criteria, based on the goodness of the track fit and the quality of muon reconstruction, is applied to select the muon candidates, having an efficiency greater than 98% for genuine muons [26]. Muons are also required to be isolated from other objects in the event using a similar isolation variable [26] as in the electron identification. Jets are reconstructed starting with all PF candidates that are clustered using the anti-kT
algo-rithm [29, 30] with a distance parameter that determines the nominal jet radius of R=0.4. The jet energies are corrected for detector response, as well as an offset energy from pileup inter-actions [32]. Jet candidates considered in this analysis are required to have pT > 30 GeV and
be within the|η| <2.5 region. Tracks associated with the jet are required to be consistent with
originating from the primary vertex. The missing transverse momentum vector~pTmiss is given by the negative vector pT sum of all PF objects, with jet energy corrections [32, 33] applied.
The magnitude of~pmiss
T is referred to as the missing transverse momentum pmissT . The near
hermiticity of the CMS detector allows for accurate measurements of pmissT . Dedicated filters are applied to remove events with pmissT induced by beam halo, noise in the detector, or poorly reconstructed muons [34].
Monte Carlo (MC) simulated events are used to model the SM backgrounds, validate the back-ground estimation methods, and study the SUSY signal yields. In order to study the SM backgrounds, discussed more fully in section 5, samples of Wγ events are generated with
MADGRAPH5 aMC@NLO2.3.3 [35] at leading order (LO), while the Zγ, Drell–Yan, WW(+γ),
WZ(+γ), and tt (+γ) background processes are generated at next-to-leading order (NLO). All
samples use the NNPDF 3.0 [36] parton distribution functions (PDFs). The generated events are interfaced withPYTHIA8.205 or 8.212 [37] with the CUETP8M1 underlying event tune [38] for
simulation of parton showering and hadronization. Renormalization and factorization scales and PDF uncertainties are derived with the use of the SysCalc package [39]. The Zγ, Drell–Yan, WW(+γ), WZ(+γ), and tt (+γ) samples are scaled to the integrated luminosity using the
the-oretical cross sections at NLO precision [35]. For the Wγ sample, a next-to-NLO (NNLO) scale factor of 1.34 [40] is applied to the LO cross section to account for higher-order corrections. The CMS detector response is simulated using a GEANT4-based [41] package. The effects of pileup are modeled in the simulation by overlaying simulated minimum-bias events on the corresponding hard-scattering event, and the distribution of the pileup vertices is reweighted to match that observed in data.
The signal events in the three simplified models introduced in section 1 are generated with MADGRAPH5 aMC@NLOat LO. The cross sections are calculated at NLO plus next-to-leading-logarithm (NLL) accuracy [42–46]. The generated events are processed with a fast simulation of the CMS detector response [47]. Scale factors are applied to compensate for any differences with respect to the full simulation.
To improve the MADGRAPH5 aMC@NLOmodeling of initial-state radiation (ISR), which affects the total transverse momentum of the event, the ISR transverse momentum (pISRT ) distributions of the MC Wγ and Zγ events are weighted to agree with those in data. This reweighting proce-dure is based on studies of the transverse momentum of Z boson events [48]. The reweighting factors range from 1.11 for pISRT ≈125 GeV to 0.64 for pISRT >300 GeV. We take the deviation of the reweighting factors from 1.0 as an estimate of the systematic uncertainty in the reweighting procedure.
4
Event selection
The analysis is performed in both the eγ and µγ channels. The eγ data sample is collected using a diphoton trigger [49] requiring at least two isolated electromagnetic objects with pT
thresholds of 30 and 18 GeV for the highest pT and second-highest-pT electromagnetic object,
respectively, that satisfy loose identification criteria and have an invariant mass Mγγ>90 GeV.
The trigger does not veto photon objects that can be matched to a track from the silicon tracker, allowing events with a photon and an electron to also pass the trigger selections. The µγ events are collected using a combination of two muon+photon triggers, one requiring the presence of an isolated photon with pT > 30 GeV and a muon with pT > 17 GeV, and the other using
symmetric pT thresholds of 38 GeV for both objects, with no photon isolation criteria. With
the selection criteria described below, the average trigger efficiency for the investigated SUSY signal models is found to be 96% for eγ and 94% for µγ.
Candidate signal events are required to contain at least one isolated photon with pγT >35 GeV
and |η| < 1.44 and at least one isolated electron (muon) with pT > 25 GeV and |η| < 2.5
(2.4). To ensure a high reconstruction efficiency, electrons in the barrel-endcap transition region 1.44< |η| <1.56 are rejected. If more than one electron (muon) satisfies the selection criteria,
the highest pTcandidate is selected. To suppress events with photons from final-state radiation,
photon candidates are vetoed if they are within ∆R < 0.3 of any reconstructed electron or muon. In addition, the highest pTphoton is required to be separated from the highest pTlepton
by∆R>0.8. In the eγ channel, the eγ invariant mass must be at least 10 GeV greater than the world-average Z boson mass [50] to reduce the contribution of Z→e+e−events, where one of
5
the electrons is misidentified as a photon.
For each event we compute the transverse mass mT of the lepton plus pmissT system to help
discriminate between the SUSY signal and SM backgrounds. The quantity mT is defined as
mT =
√
2pT`pmissT [1−cos(∆φ(`,~pTmiss))], where p`T is the magnitude of the lepton transverse momentum and ∆φ is the difference in azimuthal angle between the direction of the lepton and~pTmiss. The signal region is defined as pmissT > 120 GeV and mT > 100 GeV. Models with
strongly produced SUSY particles lead to final states with significant hadronic activity in the form of jets. To provide additional sensitivity to these models, we define the variable HT as
the scalar sum of the transverse momenta of all jets that are separated from both the candidate photon and candidate lepton by∆R>0.4. The signal region is later divided into search regions as a function of pmissT , pγT, and HT.
5
Background estimation
The SM backgrounds of events with one lepton, one photon, and substantial pmissT in the final state mainly arise from three sources. The first consists of events without a directly produced (prompt) photon. This includes events with a photon that does not originate from the hard-scattering event vertex, but from a nearby pileup vertex, as well as events with an object such as an electron or an electromagnetically rich jet that is misidentified as a photon. The second source of background consists of events that do not contain a prompt lepton. These typically result from the misidentification of a jet as a lepton, or from a jet caused by the hadronization of a heavy-flavor quark, which produces a lepton via the semileptonic decay of the correspond-ing heavy-flavor meson or baryon. The final contribution to the background comes from EW processes, primarily Wγ and Zγ production. This category also includes rarer processes such as WWγ, WZγ, and ttγ, referred to in this paper as the “rare EW” background.
The contribution from EW processes is estimated via simulation, while the backgrounds due to misidentified photons and leptons are estimated from data, as described below.
5.1 Backgrounds from misidentified photons
Photon candidates are considered misidentified if they are not produced directly in the hard-scattering process, or if they result from a misidentified object. The latter constitute the majority of misidentified photons and can occur in two cases: when a large fraction of the energy of a jet is carried by a neutral pion decaying into two almost collinear photons, or when an electron fails to register hits in the pixel tracker. In both cases, a misidentified photon is reconstructed. Signal candidate events with misidentified photons from jets can arise from the process W(→ `ν)+ jets, where a π0 or η meson in the jet decays to photons. Signal candidate events with
misidentified photons from electrons can arise from Drell–Yan dielectron production (qq →
γ∗→e+e−), as well as tt events with an electron in the final state.
The misidentified-photon background is estimated from collision data by determining the mis-identification rate from a control sample of electron-like objects and applying it to events in a control region. First, the control sample is formed by replacing the photon candidate with a photon-like object, which is obtained by inverting some of the photon identification criteria, while keeping the other selection requirements identical to those for signal candidates. Second, the misidentification rate is defined as the ratio of the number of misidentified photons to the total number of photon-like objects in the control sample. The misidentification rate is applied in a control region, defined by pmissT <70 GeV, to estimate the number of misidentified photons in the control region. This estimate is then extrapolated to the signal region.
Electron control samples are constructed by requiring a candidate photon to either be asso-ciated with a seed track in the pixel detector or be geometrically matched to a reconstructed electron within∆R < 0.03. The misidentification rate is estimated using the “tag-and-probe” method [51] on a sample of Z → e+e− events in data. The rate is derived in bins of three
variables: the pT and |η| of the probe objects, and the number of vertices in the event Nvtx.
Parameterized functions are used to model the dependence of the misidentification rate on pT
and Nvtx, and binned values are used for the |η| dependence. The measured
misidentifica-tion rate varies from 2.3% for pT = 35 GeV to 1.2% for pT > 180 GeV. These misidentification
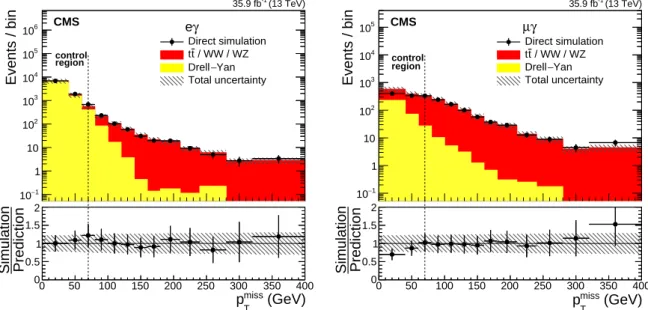
rates are then applied on an event-by-event basis in the control region when estimating the misidentified-lepton backgrounds later in the signal region. To verify the correctness of this background estimation method, it is tested on simulated Drell–Yan and tt/WW/WZ events. As shown in figure 2, good agreement is achieved in the pmiss
T distribution of these simulated
background events found using the control sample e-to-γ misidentification estimation method and that found directly from the generator-level truth information.
To estimate the jet-to-photon misidentification background, a hadronic control sample is con-structed by inverting one of the variables characterizing the ECAL cluster shape (σηηin Ref. [25])
and the isolation variable requirement. The misidentification rate for the hadronic control sam-ple is determined through an assessment of the fraction of events with jet-to-photon misiden-tification among the photon candidates. This fraction is denoted as the “hadron fraction”. The measurement is performed in the control region pmiss
T <70 GeV from a fit to the isolation
vari-able distribution based on two templates, one representing pure photons obtained from γ+jet simulated MC events and one modeling the events with jet-to-photon misidentification, where the template for those events is obtained by inverting the σηηrequirement on the signal-photon
(GeV) miss T p Events / bin 1 − 10 1 10 2 10 3 10 4 10 5 10 6 10 Direct simulation / WW / WZ t t Yan − Drell Total uncertainty γ e control region (13 TeV) -1 35.9 fb CMS (GeV) miss T p 0 50 100 150 200 250 300 350 400 Prediction Simulation 0 0.5 1 1.5 2 (GeV) miss T p Events / bin 1 − 10 1 10 2 10 3 10 4 10 5 10 Direct simulation / WW / WZ t t Yan − Drell Total uncertainty γ µ control region (13 TeV) -1 35.9 fb CMS (GeV) miss T p 0 50 100 150 200 250 300 350 400 Prediction Simulation 0 0.5 1 1.5 2
Figure 2: Verification of the e-to-γ misidentification estimation method using simulated data. The pmissT distribution for events with misidentified photons in the eγ (left) and µγ (right) chan-nels from prediction using the control sample estimation method (histograms) and direct sim-ulation (points), as obtained from the generator-level information of the simulated data. The vertical bars on the points show the statistical uncertainty in the simulation, while the horizon-tal bars give the bin widths. The dashed vertical line shows the boundary between the control and signal regions. The lower panels show the ratio of the predictions from direct simulation to those estimated with control samples. The hatched areas give the quadrature sum of the statistical and systematic uncertainties in the simulated background.
5.2 Electroweak and misidentified-lepton backgrounds 7
candidates. The fit to the isolation distribution is performed in bins of pγ
T. The resulting hadron
fraction varies from 47 to 4% for the eγ channel and 18 to 4% for the µγ channel as pγ
Tincreases.
The pTdistribution of the jet-to-photon background in the control region is obtained by
multi-plying the pT distribution of the photon candidates by the hadron fraction. To extrapolate the
result to high-pTphotons, the pT shape of the jet-to-photon backgrounds and the control
sam-ples are modeled with the sum of two exponential functions, and the ratio between these two functions is used to assign event-by-event misidentification rates in the signal region. In the eγ channel, the misidentification rate varies from 28% at pT =35 GeV to 12% at pT =200 GeV. In
the µγ channel, it drops from 22 to 10% as pTgoes from 35 to 200 GeV.
5.2 Electroweak and misidentified-lepton backgrounds
A lepton is considered to be misidentified if it doesn’t originate from a prompt W or Z boson decay. This includes leptons from heavy- and light-flavor hadron decays, misidentified jets, and electrons from photon conversions. Similar to the misidentified-photon background, the shapes of the misidentified-lepton backgrounds are modeled by control samples, which are formed by inverting the isolation requirement of the lepton while keeping other requirements unchanged. For electrons, the cluster shape and the quality of the cluster-to-track matching are also inverted to include more hadronic objects.
The SM backgrounds in final states with a lepton, a photon, and large pmissT are dominated by the production of W and Z bosons in association with a photon, denoted as Vγ production. In particular, neutrinos from the W boson leptonic decay escape the detector, producing signifi-cant pmissT . The shape of the pmissT distribution from the Vγ background is modeled by simu-lation, and the normalization factors are determined together with those of the misidentified-lepton backgrounds, as described in the next paragraph.
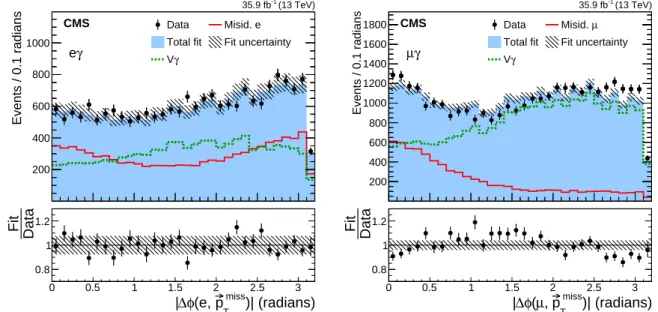
The normalization of the Vγ and misidentified-lepton backgrounds is determined by a two-component signal-plus-background template fit to the distribution of |∆φ(`,~pTmiss)|, the az-imuthal angular difference between the direction of the lepton and ~pTmiss in the transverse plane. This fit is performed in the control region 40< pmiss
T <70 GeV, where the lower bound
of 40 GeV is applied to reduce the contribution of Zγ events. Expected contributions from the misidentified-photon and rare EW backgrounds such as WW(+γ), WZ(+γ), and tt(+γ)
pro-cesses are subtracted before the fit. The distribution of|∆φ(`,~pTmiss)|is shown in figure 3 with the fit results overlaid. The resulting scale factors (SFs) for the Vγ and misidentified-lepton backgrounds in the eγ channel are SFVγ =1.17±0.08 and SFe−misid =0.24±0.02, respectively,
while the SFs for the µγ channel are SFVγ =1.33±0.02 and SFµ−misid =0.62±0.02, where the
uncertainties are statistical only.
6
Systematic uncertainties
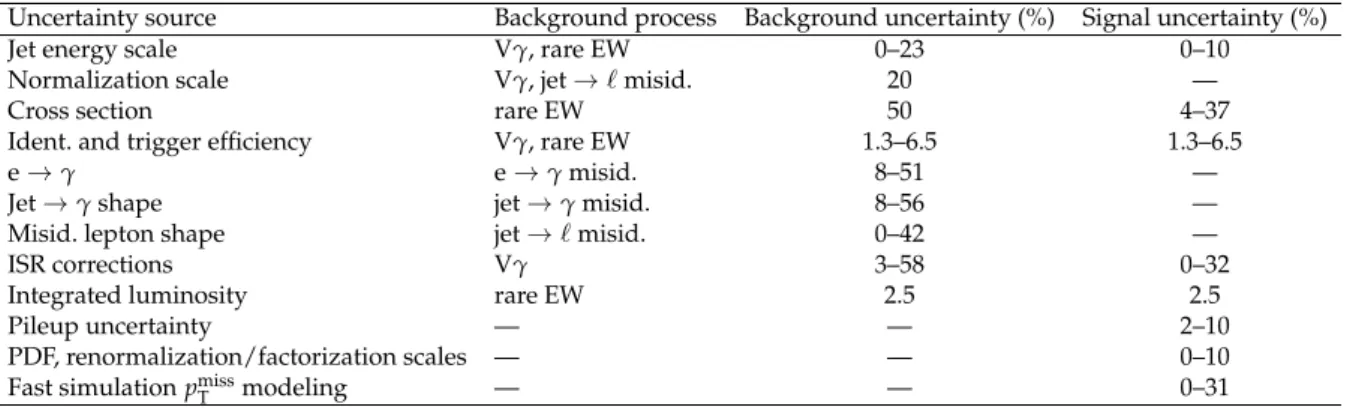
Table 1 summarizes the relative systematic uncertainties in the background estimation and sig-nal expectation. If the relative uncertainties differ considerably in different kinematic regions because of the limited number of events available for the evaluation of the systematic tainties, the range of the relative uncertainty is shown. The main sources of systematic uncer-tainties are the SFs derived from the |∆φ(`,~pTmiss)|template fit to the Vγ and misidentified-lepton backgrounds, and the cross sections used to normalize the rare EW simulated samples. The systematic uncertainty coming from the shape of the Vγ distribution is obtained by al-lowing each bin of the template to vary independently according to a Gaussian distribution. Systematic uncertainties in the magnitude of the normalization are determined by allowing the number of subtracted events from the estimated backgrounds to vary within their
uncer-0 0.5 1 1.5 2 2.5 3 Events / 0.1 radians 200 400 600 800 1000 Data Misid. e
Total fit Fit uncertainty
γ V (13 TeV) -1 35.9 fb CMS γ e )| (radians) miss T p (e, φ ∆ | 0 0.5 1 1.5 2 2.5 3 Data Fit 0.8 1 1.2 0 0.5 1 1.5 2 2.5 3 Events / 0.1 radians 200 400 600 800 1000 1200 1400 1600 1800 Data Misid. µ
Total fit Fit uncertainty
γ V (13 TeV) -1 35.9 fb CMS γ µ )| (radians) miss T p , µ ( φ ∆ | 0 0.5 1 1.5 2 2.5 3 Data Fit 0.8 1 1.2
Figure 3: The|∆φ(`,~pmiss
T )|distributions for the data in the 40< pmissT <70 GeV control region
(points) and the estimated Vγ (dashed line) and misidentified-lepton (solid line) backgrounds for the eγ (left) and µγ (right) channels. The filled histogram shows the result of the overall fit and the hatched area indicates the fit uncertainty. The vertical bars on the points represent the statistical uncertainty in the data. The lower panels show the ratio of the fit result to the data. tainties, as well as the PDF and renormalization and factorization scales of the Vγ template to vary by one standard deviation around their nominal values. For the rare EW backgrounds, a 50% uncertainty is assigned to the cross sections to cover the difference between the calculated cross sections and the latest CMS measurements [52, 53].
The subdominant systematic uncertainties come from the modeling of the misidentified pho-tons. Different choices of control samples and parameterized functions are studied to evaluate the size of these systematic effects. The uncertainties in the number of misidentified photons with pT < 200 GeV are less than 20%. A larger uncertainty, up to 56%, is caused by the
lim-ited number of events in the control sample and applies only to the high-pT bins, where the
misidentified photons contribute less than 10% of the total background, resulting in a small effect on the total background prediction. For the backgrounds obtained from simulation, sys-tematic uncertainties from the jet energy scale are evaluated by varying the corresponding scale by one standard deviation around its nominal value [54]. Uncertainties in the signal cross sec-tions used in the simulation due to the PDFs and the renormalization and factorization scales are taken from Refs. [44–46]. The additional shape uncertainty in the signal sample due to the choice of the renormalization and factorization scales is estimated by varying the scales upward and downward by a factor of two with respect to their nominal values. Finally, the uncertainty in the integrated luminosity of the data sample is 2.5% [55].
7
Results
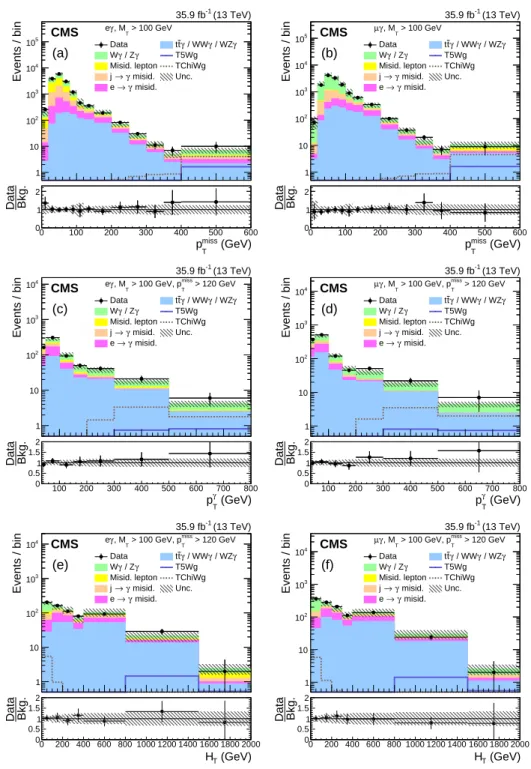
Figure 4 shows the pmissT , pγ
T, and HT distributions of the observed data and predicted
back-ground, together with the systematic uncertainties in the background prediction. The pmiss T
distribution includes all events with mT > 100 GeV, while the pγT and HT distributions only
include events in the signal region. Two simulated signal distributions, one from the TChiWg simplified model with an NLSP mass of 800 GeV, and the other from the T5Wg model with an NLSP mass of 1000 GeV and a gluino mass of 1700 GeV, are also overlaid. The data are
9
Table 1: The relative systematic uncertainties in the SM background processes (third column) and the expected SUSY signal (fourth column). The ranges refer to the uncertainties over the different kinematic regions.
Uncertainty source Background process Background uncertainty (%) Signal uncertainty (%)
Jet energy scale Vγ, rare EW 0–23 0–10
Normalization scale Vγ, jet → ` misid. 20 —
Cross section rare EW 50 4–37
Ident. and trigger efficiency Vγ, rare EW 1.3–6.5 1.3–6.5
e → γ e → γ misid. 8–51 —
Jet → γ shape jet → γ misid. 8–56 —
Misid. lepton shape jet → ` misid. 0–42 —
ISR corrections Vγ 3–58 0–32
Integrated luminosity rare EW 2.5 2.5
Pileup uncertainty — — 2–10
PDF, renormalization/factorization scales — — 0–10
Fast simulation pmiss
T modeling — — 0–31
compatible with the estimated SM backgrounds within the uncertainties.
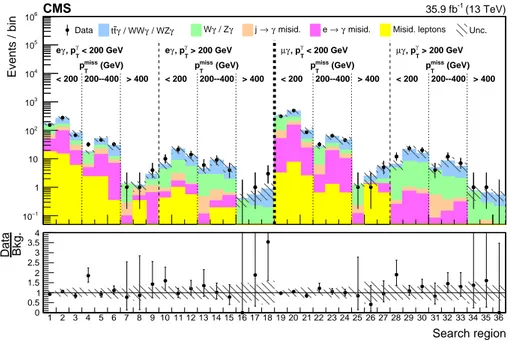
To improve the sensitivity for different SUSY scenarios, the signal region for each lepton chan-nel is further divided into 18 search regions: three bins of pmissT (120–200, 200–400, and>400 GeV) in each of three HT ranges (0–100, 100–400, and>400 GeV), and two ranges of photon pT(35–
200 and >200 GeV). The misidentified-photon and misidentified-lepton control samples are also divided into respective search regions. Figure 5 gives the event yields from data and the estimated total background in each of the search regions for the eγ (left part) and µγ (right part) channels. The observed data are consistent with the background predictions in all the search regions. The largest difference is in the fourth bin of the eγ channel, which has an ex-cess over the background prediction of 2.3 standard deviations. In the corresponding search regions of the µγ channel, the data are compatible with the SM background predictions. Thus, we conclude that no significant excess of events beyond the SM expectation is observed.
8
Interpretation
The results are interpreted in the context of upper limits on the cross sections of the three simplified SUSY models introduced in section 1. For each mass point of the signal models, a 95% confidence level (CL) upper limit on the signal production cross section is obtained by calculating CLslimits [56–58] using the profile likelihood as a test statistic and asymptotic
for-mulas [59]. The SM background prediction, signal expectation, and observed number of events in each signal search region of the eγ and µγ channels defined above are combined into one statistical interpretation, and studied as a multichannel counting experiment.
Figure 6 shows the observed and expected 95% CL upper limits on the cross section for the TChiWg model as a function of the NLSP mass, together with the theoretical cross section for
e
χ0χe
± pair production. The TChiWg model is based on the direct production of
e
χ± andχe
0, in
which their decays are restricted to W±G and γ ee G, respectively. The gravitino eG is modeled as nearly massless. Assuming a 100% branching fraction forχe
0→
γ eG, this search excludes NLSP
masses up to 930 GeV at the 95% CL.
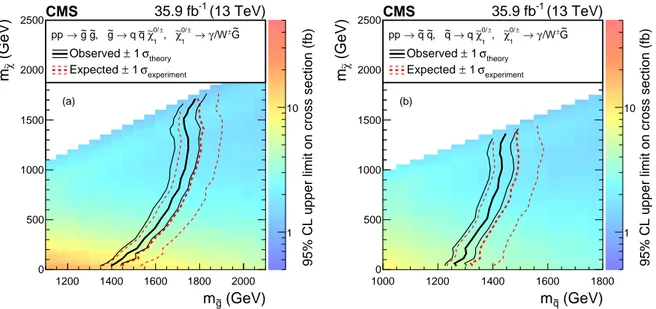
In figure 7, we present the cross section 95% CL upper limits and mass exclusion contours for the T5Wg and T6Wg simplified models. The production cross section of the T5Wg (T6Wg) model is determined solely by meg(meq). Nevertheless, the meg/eq−mχemass difference affects the
(GeV) miss T p 0 100 200 300 400 500 600 Events / bin 1 10 2 10 3 10 4 10 5 10 (a) DataWγ / Zγ tT5Wgtγ / WWγ / WZγ Misid. lepton TChiWg
misid. γ → j Unc. misid. γ → e (13 TeV) -1 35.9 fb CMS > 100 GeV T , M γ e (GeV) miss T p 0 100 200 300 400 500 600 Bkg. Data 0 1 2 (GeV) miss T p 0 100 200 300 400 500 600 Events / bin 1 10 2 10 3 10 4 10 5 10 (b) DataWγ / Zγ tT5Wgtγ / WWγ / WZγ Misid. lepton TChiWg
misid. γ → j Unc. misid. γ → e (13 TeV) -1 35.9 fb CMS > 100 GeV T , M γ µ (GeV) miss T p 0 100 200 300 400 500 600 Bkg. Data 0 1 2 (GeV) γ T p 100 200 300 400 500 600 700 800 Events / bin 1 10 2 10 3 10 4 10 (c) > 120 GeV miss T > 100 GeV, p T , M γ e Data ttγ / WWγ / WZγ γ / Z γ W T5Wg Misid. lepton TChiWg
misid. γ → j Unc. misid. γ → e (13 TeV) -1 35.9 fb CMS (GeV) γ T p 100 200 300 400 500 600 700 800 Bkg. Data 0 0.5 1 1.5 2 (GeV) γ T p 100 200 300 400 500 600 700 800 Events / bin 1 10 2 10 3 10 4 10 (d) > 120 GeV miss T > 100 GeV, p T , M γ µ Data ttγ / WWγ / WZγ γ / Z γ W T5Wg Misid. lepton TChiWg
misid. γ → j Unc. misid. γ → e (13 TeV) -1 35.9 fb CMS (GeV) γ T p 100 200 300 400 500 600 700 800 Bkg. Data 0 0.5 1 1.5 2 (GeV) T H 0 200 400 600 800 1000 1200 1400 1600 1800 2000 Events / bin 1 10 2 10 3 10 4 10 (e) DataWγ / Zγ tT5Wgtγ / WWγ / WZγ Misid. lepton TChiWg
misid. γ → j Unc. misid. γ → e (13 TeV) -1 35.9 fb CMS > 120 GeV miss T > 100 GeV, p T , M γ e (GeV) T H 0 200 400 600 800 1000 1200 1400 1600 1800 2000 Bkg. Data 0 0.5 1 1.5 2 (GeV) T H 0 200 400 600 800 1000 1200 1400 1600 1800 2000 Events / bin 1 10 2 10 3 10 4 10 (f) DataWγ / Zγ tT5Wgtγ / WWγ / WZγ Misid. lepton TChiWg
misid. γ → j Unc. misid. γ → e (13 TeV) -1 35.9 fb CMS > 120 GeV miss T > 100 GeV, p T , M γ µ (GeV) T H 0 200 400 600 800 1000 1200 1400 1600 1800 2000 Bkg. Data 0 0.5 1 1.5 2
Figure 4: Distributions of pmissT (a, b), pγ
T (c, d), and HT (e, f) from data (points) and estimated
SM predictions (stacked histograms) for the eγ (left) and µγ (right) channels. Simulated signal distributions from the TChiWg model (dotted) with m
e
χ0/χe± = 800 GeV and the T5Wg model
(solid) with meg = 1700 GeV are overlaid. The pmissT distribution includes all events with mT >
100 GeV, while the pγTand HTdistributions only include events with mT >100 GeV and pmissT >
120 GeV. The vertical bars on the points give the statistical uncertainty in the data and the horizontal bars show the bin widths. The hatched area represents the quadratic sum of the statistical and systematic uncertainties in the simulated background. The lower panels display the ratio of the data to the total background prediction.
11 0 5 10 15 20 25 30 35 Events / bin 1 − 10 1 10 2 10 3 10 4 10 5 10 6 10
Data ttγ / WWγ / WZγ Wγ / Zγ j →γ misid. e →γ misid. Misid. leptons Unc.
< 200 GeV γ T , p γ e γ > 200 GeV T , p γ e γ < 200 GeV T , p γ µ γ > 200 GeV T , p γ µ (GeV) T miss p (GeV) T miss p (GeV) T miss p (GeV) T miss p < 200 200--400 > 400 < 200 200--400 > 400 < 200 200--400 > 400 < 200 200--400 > 400 (13 TeV) -1 35.9 fb CMS Search region 1 2 3 4 5 6 7 8 9 10 11 12 13 14 15 16 17 18 19 20 21 22 23 24 25 26 27 28 29 30 31 32 33 34 35 36 Bkg. Data 0 0.5 1 1.5 2 2.5 3 3.5 4
Figure 5: The number of data events (points) and predicted background events (shaded his-tograms) for the 18 search regions in pmissT , HT, and pγT (separated by dashed vertical lines) in
the eγ (regions 1–18) and the µγ (regions 19–36) channels. For each pmissT range, the first, sec-ond, and last bins correspond to the HT regions 0–100, 100–400, and> 400 GeV, respectively.
The lower panel displays the ratio of the data to the background predictions. The vertical bars on the points show the statistical uncertainty in the data, and the hatched areas give the quadrature sum of the statistical and systematic uncertainties in the simulated background. plane. The branching fractions foreg→qqχe
0/
e
χ±andeq→qχe
0/
e
χ±are assumed to be 50%. For
largeχe
0/
e
χ±masses, gluino (squark) masses are excluded at 95% CL up to 1.75 (1.43) TeV in the
T5Wg (T6Wg) scenarios.
9
Summary
A search for supersymmetry with general gauge mediation in events with a photon, an elec-tron or muon, and large missing transverse momentum has been presented. This analysis is based on a sample of proton-proton collisions at√s = 13 TeV, corresponding to an integrated luminosity of 35.9 fb−1recorded by the CMS experiment in 2016. The data are examined in bins of the photon transverse energy, the magnitude of the missing transverse momentum, and the scalar sum of jet energies. The standard model background is evaluated primarily using control samples in the data, with simulation used to evaluate backgrounds from electroweak processes. The data are found to agree with the standard model expectation, without significant excess in the search region. The results of the search are interpreted as 95% confidence level upper limits on the production cross sections of supersymmetric particles in the context of simplified mod-els [23] motivated by gauge-mediated supersymmetry breaking. For strong production modmod-els, such as the T5Wg simplified model of gluino pair production and the T6Wg model of squark pair production, this search excludes gluinos (squarks) with masses up to 1.75 (1.43) TeV in the T5Wg (T6Wg) scenarios. The TChiWg simplified model, based on direct electroweak pro-duction of a neutralino and chargino, is excluded for next-to-lightest supersymmetric particle masses below 930 GeV, extending the current best limit by about 150 GeV [19].
(GeV)
NLSPm
400 600 800 1000 1200Cross section (fb)
1 − 10 1 10 2 10 3 10 4 10 CMS 35.9 fb-1 (13 TeV) G~ γ → 0 χ∼ , G~ ± W → ± χ∼ , 0 χ∼ ± χ∼ → pp σ 1 ± Expected σ 2 ± Expected Observed theory σ 1 ± NLOFigure 6: The observed (solid line) and expected (dashed line) 95% CL upper limits on the production cross sections for the TChiWg simplified model, together with the NLO theoretical cross sections as a function of the NLSP mass. The inner (darker) band and outer (lighter) band around the expected upper limits indicate the regions containing 68 and 95%, respectively, of the distribution of limits expected under the background-only hypothesis. The dotted lines around the theoretical cross section gives the ±1 standard deviation uncertainty in the cross section. (GeV) g ~ m 1200 1400 1600 1800 2000 (GeV)χ∼ m 0 500 1000 1500 2000 2500 1 10 (13 TeV) -1 35.9 fb CMS G~ ± /W γ → 1 ± 0/ χ∼ , 1 ± 0/ χ∼ q q → g ~ , g ~ g ~ → pp (a) theory σ 1 ± Observed experiment σ 1 ± Expected
95% CL upper limit on cross section (fb)
(GeV) q ~ m 1000 1200 1400 1600 1800 (GeV)χ∼ m 0 500 1000 1500 2000 2500 1 10 (13 TeV) -1 35.9 fb CMS G~ ± /W γ → 1 ± 0/ χ∼ , 1 ± 0/ χ∼ q → q ~ , q ~ q ~ → pp (b) theory σ 1 ± Observed experiment σ 1 ± Expected
95% CL upper limit on cross section (fb)
Figure 7: The observed (solid line) and expected (dashed line) 95% CL exclusion contours for (a) megversus mχeand (b) meqversus mχe(regions to the left of the curves are excluded), and the
95% CL upper limits on the pair production cross sections for (a)egeg in the T5Wg and (b)qeeq in the T6Wg simplified models (use the scales to the right of the plots). The upper limits on the cross sections assume a 50% branching fraction foreg→qqχe
0/ e χ±andeq→qχe 0/ e χ±. The bands
around the observed and expected exclusion contours indicate the±1 standard deviation range when including the experimental and theoretical uncertainties, respectively.
References 13
Acknowledgments
We congratulate our colleagues in the CERN accelerator departments for the excellent perfor-mance of the LHC and thank the technical and administrative staffs at CERN and at other CMS institutes for their contributions to the success of the CMS effort. In addition, we grate-fully acknowledge the computing centers and personnel of the Worldwide LHC Computing Grid for delivering so effectively the computing infrastructure essential to our analyses. Fi-nally, we acknowledge the enduring support for the construction and operation of the LHC and the CMS detector provided by the following funding agencies: BMWFW and FWF (Aus-tria); FNRS and FWO (Belgium); CNPq, CAPES, FAPERJ, and FAPESP (Brazil); MES (Bulgaria); CERN; CAS, MoST, and NSFC (China); COLCIENCIAS (Colombia); MSES and CSF (Croatia); RPF (Cyprus); SENESCYT (Ecuador); MoER, ERC IUT, and ERDF (Estonia); Academy of Fin-land, MEC, and HIP (Finland); CEA and CNRS/IN2P3 (France); BMBF, DFG, and HGF (Ger-many); GSRT (Greece); OTKA and NIH (Hungary); DAE and DST (India); IPM (Iran); SFI (Ireland); INFN (Italy); MSIP and NRF (Republic of Korea); LAS (Lithuania); MOE and UM (Malaysia); BUAP, CINVESTAV, CONACYT, LNS, SEP, and UASLP-FAI (Mexico); MBIE (New Zealand); PAEC (Pakistan); MSHE and NSC (Poland); FCT (Portugal); JINR (Dubna); MON, RosAtom, RAS, RFBR and RAEP (Russia); MESTD (Serbia); SEIDI, CPAN, PCTI and FEDER (Spain); Swiss Funding Agencies (Switzerland); MST (Taipei); ThEPCenter, IPST, STAR, and NSTDA (Thailand); TUBITAK and TAEK (Turkey); NASU and SFFR (Ukraine); STFC (United Kingdom); DOE and NSF (USA).
Individuals have received support from the Marie-Curie program and the European Research Council and Horizon 2020 Grant, contract No. 675440 (European Union); the Leventis Foun-dation; the A. P. Sloan FounFoun-dation; the Alexander von Humboldt FounFoun-dation; the Belgian Fed-eral Science Policy Office; the Fonds pour la Formation `a la Recherche dans l’Industrie et dans l’Agriculture (FRIA-Belgium); the Agentschap voor Innovatie door Wetenschap en Technologie (IWTBelgium); the F.R.S.FNRS and FWO (Belgium) under the “Excellence of Science EOS” -be.h project n. 30820817; the Ministry of Education, Youth and Sports (MEYS) of the Czech Re-public; the Lend ¨ulet (“Momentum”) Program and the J´anos Bolyai Research Scholarship of the Hungarian Academy of Sciences, the New National Excellence Program ´UNKP, the NKFIA re-search grants 123842, 123959, 124845, 124850 and 125105 (Hungary); the Council of Science and Industrial Research, India; the HOMING PLUS program of the Foundation for Polish Science, cofinanced from European Union, Regional Development Fund, the Mobility Plus program of the Ministry of Science and Higher Education, the National Science Center (Poland), contracts Harmonia 2014/14/M/ST2/00428, Opus 2014/13/B/ST2/02543, 2014/15/B/ST2/03998, and 2015/19/B/ST2/02861, Sonata-bis 2012/07/E/ST2/01406; the National Priorities Research Program by Qatar National Research Fund; the Programa Estatal de Fomento de la Investi-gaci ´on Cient´ıfica y T´ecnica de Excelencia Mar´ıa de Maeztu, grant MDM-2015-0509 and the Pro-grama Severo Ochoa del Principado de Asturias; the Thalis and Aristeia programs cofinanced by EU-ESF and the Greek NSRF; the Rachadapisek Sompot Fund for Postdoctoral Fellowship, Chulalongkorn University and the Chulalongkorn Academic into Its 2nd Century Project Ad-vancement Project (Thailand); the Welch Foundation, contract C-1845; and the Weston Havens Foundation (USA).
References
[1] M. Dine and W. Fischler, “A phenomenological model of particle physics based on supersymmetry”, Phys. Lett. B 110 (1982) 227,
[2] L. Alvarez-Gaume, M. Claudson, and M. B. Wise, “Low-energy supersymmetry”, Nucl. Phys. B 207 (1982) 96, doi:10.1016/0550-3213(82)90138-9.
[3] C. R. Nappi and B. A. Ovrut, “Supersymmetric extension of the SU(3)xSU(2)xU(1) model”, Phys. Lett. B 113 (1982) 175, doi:10.1016/0370-2693(82)90418-X. [4] M. Dine and A. E. Nelson, “Dynamical supersymmetry breaking at low energies”, Phys.
Rev. D 48 (1993) 1277, doi:10.1103/PhysRevD.48.1277, arXiv:hep-ph/9303230. [5] M. Dine, A. E. Nelson, and Y. Shirman, “Low energy dynamical supersymmetry breaking
simplified”, Phys. Rev. D 51 (1995) 1362, doi:10.1103/PhysRevD.51.1362, arXiv:hep-ph/9408384.
[6] M. Dine, A. E. Nelson, Y. Nir, and Y. Shirman, “New tools for low-energy dynamical supersymmetry breaking”, Phys. Rev. D 53 (1996) 2658,
doi:10.1103/PhysRevD.53.2658, arXiv:hep-ph/9507378.
[7] G. R. Farrar and P. Fayet, “Phenomenology of the production, decay, and detection of new hadronic states associated with supersymmetry”, Phys. Lett. B 76 (1978) 575, doi:10.1016/0370-2693(78)90858-4.
[8] S. Dimopoulos, G. F. Giudice, and A. Pomarol, “Dark matter in theories of gauge mediated supersymmetry breaking”, Phys. Lett. B 389 (1996) 37,
doi:10.1016/S0370-2693(96)01241-5, arXiv:hep-ph/9607225.
[9] S. P. Martin, “Generalized messengers of supersymmetry breaking and the sparticle mass spectrum”, Phys. Rev. D 55 (1997) 3177, doi:10.1103/PhysRevD.55.3177,
arXiv:hep-ph/9608224.
[10] E. Poppitz and S. P. Trivedi, “Some remarks on gauge mediated supersymmetry breaking”, Phys. Lett. B 401 (1997) 38, doi:10.1016/S0370-2693(97)00367-5, arXiv:hep-ph/9703246.
[11] P. Meade, N. Seiberg, and D. Shih, “General gauge mediation”, Prog. Theor. Phys. Suppl.
177(2009) 143, doi:10.1143/PTPS.177.143, arXiv:0801.3278.
[12] M. Buican, P. Meade, N. Seiberg, and D. Shih, “Exploring general gauge mediation”, JHEP 03 (2009) 016, doi:10.1088/1126-6708/2009/03/016, arXiv:0812.3668. [13] S. Abel, M. J. Dolan, J. Jaeckel, and V. V. Khoze, “Phenomenology of pure general gauge
mediation”, JHEP 12 (2009) 001, doi:10.1088/1126-6708/2009/12/001, arXiv:0910.2674.
[14] L. M. Carpenter, M. Dine, G. Festuccia, and J. D. Mason, “Implementing general gauge mediation”, Phys. Rev. D 79 (2009) 035002, doi:10.1103/PhysRevD.79.035002, arXiv:0805.2944.
[15] T. T. Dumitrescu, Z. Komargodski, N. Seiberg, and D. Shih, “General messenger gauge mediation”, JHEP 05 (2010) 096, doi:10.1007/JHEP05(2010)096,
arXiv:1003.2661.
[16] ATLAS Collaboration, “Search for photonic signatures of gauge-mediated
supersymmetry in 8 TeV pp collisions with the ATLAS detector”, Phys. Rev. D 92 (2015) 072001, doi:10.1103/PhysRevD.92.072001, arXiv:1507.05493.
References 15
[17] CMS Collaboration, “Search for supersymmetry in events with a lepton, a photon, and large missing transverse energy in pp collisions at√s=7 TeV”, JHEP 06 (2011) 093, doi:10.1007/JHEP06(2011)093, arXiv:1105.3152.
[18] CMS Collaboration, “Search for supersymmetry with photons in pp collisions at√s=8 TeV”, Phys. Rev. D 92 (2015) 072006, doi:10.1103/PhysRevD.92.072006,
arXiv:1507.02898.
[19] CMS Collaboration, “Search for gauge-mediated supersymmetry in events with at least one photon and missing transverse momentum in pp collisions at√s =13 TeV”, Phys. Lett. B 780 (2018) 118, doi:10.1016/j.physletb.2018.02.045,
arXiv:1711.08008.
[20] CMS Collaboration, “Search for supersymmetry in events with at least one photon, missing transverse momentum, and large transverse event activity in proton-proton collisions at√s=13 TeV”, JHEP 12 (2017) 142, doi:10.1007/JHEP12(2017)142, arXiv:1707.06193.
[21] ATLAS Collaboration, “Search for photonic signatures of gauge-mediated
supersymmetry in 13 TeV pp collisions with the ATLAS detector”, Phys. Rev. D 97 (2018) 092006, doi:10.1103/PhysRevD.97.092006, arXiv:1802.03158.
[22] CMS Collaboration, “Search for supersymmetry in events with a photon, a lepton, and missing transverse momentum in pp collisions at√s=8 TeV”, Phys. Lett. B 757 (2016) 6, doi:10.1016/j.physletb.2016.03.039, arXiv:1508.01218.
[23] CMS Collaboration, “Interpretation of searches for supersymmetry with simplified models”, Phys. Rev. D 88 (2013) 052017, doi:10.1103/PhysRevD.88.052017, arXiv:1301.2175.
[24] CMS Collaboration, “Performance of photon reconstruction and identification with the CMS detector in proton-proton collisions at√s=8 TeV”, JINST 10 (2015) P08010, doi:10.1088/1748-0221/10/08/P08010, arXiv:1502.02702.
[25] CMS Collaboration, “Performance of electron reconstruction and selection with the CMS detector in proton-proton collisions at√s=8 TeV”, JINST 10 (2015) P06005,
doi:10.1088/1748-0221/10/06/P06005, arXiv:1502.02701.
[26] CMS Collaboration, “Performance of the CMS muon detector and muon reconstruction with proton-proton collisions at√s=13 TeV”, JINST 13 (2018) P06015,
doi:10.1088/1748-0221/13/06/P06015, arXiv:1804.04528.
[27] CMS Collaboration, “The CMS experiment at the CERN LHC”, JINST 3 (2008) S08004, doi:10.1088/1748-0221/3/08/S08004.
[28] CMS Collaboration, “Particle-flow reconstruction and global event description with the CMS detector”, JINST 12 (2017) P10003, doi:10.1088/1748-0221/12/10/P10003, arXiv:1706.04965.
[29] M. Cacciari, G. P. Salam, and G. Soyez, “The anti-kTjet clustering algorithm”, JHEP 04
(2008) 063, doi:10.1088/1126-6708/2008/04/063, arXiv:0802.1189.
[30] M. Cacciari, G. P. Salam, and G. Soyez, “FastJet user manual”, Eur. Phys. J. C 72 (2012) 1896, doi:10.1140/epjc/s10052-012-1896-2, arXiv:1111.6097.
[31] K. Rehermann and B. Tweedie, “Efficient identification of boosted semileptonic top quarks at the LHC”, JHEP 03 (2011) 059, doi:10.1007/JHEP03(2011)059.
[32] M. Cacciari and G. P. Salam, “Pileup subtraction using jet areas”, Phys. Lett. B 659 (2008) 119, doi:10.1016/j.physletb.2007.09.077, arXiv:0707.1378.
[33] CMS Collaboration, “Determination of jet energy calibration and transverse momentum resolution in CMS”, JINST 6 (2011) P11002,
doi:10.1088/1748-0221/6/11/P11002, arXiv:1107.4277.
[34] CMS Collaboration, “Performance of the CMS missing transverse momentum reconstruction in pp data at√s=8 TeV”, JINST 10 (2015) P02006,
doi:10.1088/1748-0221/10/02/P02006, arXiv:1411.0511.
[35] J. Alwall et al., “The automated computation of tree-level and next-to-leading order differential cross sections, and their matching to parton shower simulations”, JHEP 07 (2014) 079, doi:10.1007/JHEP07(2014)079, arXiv:1405.0301.
[36] R. D. Ball et al., “Parton distributions for the LHC run II”, JHEP 04 (2015) 040, doi:10.1007/JHEP04(2015)040, arXiv:1410.8849.
[37] T. Sj ¨ostrand et al., “An introduction to PYTHIA 8.2”, Comput. Phys. Commun. 191 (2015) 159, doi:10.1016/j.cpc.2015.01.024, arXiv:1410.3012.
[38] CMS Collaboration, “Event generator tunes obtained from underlying event and multiparton scattering measurements”, Eur. Phys. J. C 76 (2016) 155,
doi:10.1140/epjc/s10052-016-3988-x, arXiv:1512.00815.
[39] A. Kalogeropoulos and J. Alwall, “The SysCalc code: A tool to derive theoretical systematic uncertainties”, (2018). arXiv:1801.08401.
[40] G. Bozzi et al., “Production of Drell–Yan lepton pairs in hadron collisions:
Transverse-momentum resummation at next-to-next-to-leading logarithmic accuracy”, Phys. Lett. B 696 (2011) 207, doi:10.1016/j.physletb.2010.12.024,
arXiv:1007.2351.
[41] GEANT4 Collaboration, “GEANT4—a simulation toolkit”, Nucl. Instrum. Meth. A 506 (2003) 250, doi:10.1016/S0168-9002(03)01368-8.
[42] W. Beenakker, R. H ¨opker, M. Spira, and P. M. Zerwas, “Squark and gluino production at hadron colliders”, Nucl. Phys. B 492 (1997) 51,
doi:10.1016/S0550-3213(97)80027-2, arXiv:hep-ph/9610490.
[43] W. Beenakker et al., “The production of charginos/neutralinos and sleptons at hadron colliders”, Phys. Rev. Lett. 83 (1999) 3780, doi:10.1103/PhysRevLett.83.3780, arXiv:hep-ph/9906298. [Erratum: doi:10.1103/PhysRevLett.100.029901]. [44] B. Fuks, M. Klasen, D. R. Lamprea, and M. Rothering, “Gaugino production in
proton-proton collisions at a center-of-mass energy of 8 TeV”, JHEP 10 (2012) 081, doi:10.1007/JHEP10(2012)081, arXiv:1207.2159.
[45] B. Fuks, M. Klasen, D. R. Lamprea, and M. Rothering, “Precision predictions for
electroweak superpartner production at hadron colliders withRESUMMINO”, Eur. Phys. J. C 73 (2013) 2480, doi:10.1140/epjc/s10052-013-2480-0, arXiv:1304.0790.
References 17
[46] C. Borschensky et al., “Squark and gluino production cross sections in pp collisions at√s = 13, 14, 33 and 100 TeV”, Eur. Phys. J C 74 (2014) 3174,
doi:10.1140/epjc/s10052-014-3174-y, arXiv:1407.5066.
[47] S. Abdullin et al., “The fast simulation of the CMS detector at LHC”, J. Phys.: Conf. Ser.
331(2011) 032049, doi:10.1088/1742-6596/331/3/032049.
[48] CMS Collaboration, “Search for top-squark pair production in the single-lepton final state in pp collisions at√s =8 TeV”, Eur. Phys. J. C 73 (2013) 2677,
doi:10.1140/epjc/s10052-013-2677-2, arXiv:1308.1586. [49] CMS Collaboration, “The CMS trigger system”, JINST 12 (2017) P01020,
doi:10.1088/1748-0221/12/01/P01020, arXiv:1609.02366.
[50] Particle Data Group, C. Patrignani et al., “Review of particle physics”, Chin. Phys. C 40 (2016) 100001, doi:10.1088/1674-1137/40/10/100001.
[51] CMS Collaboration, “Measurement of the inclusive W and Z production cross sections in pp collisions at√s =7 TeV”, JHEP 10 (2011) 132, doi:10.1007/JHEP10(2011)132, arXiv:1107.4789.
[52] CMS Collaboration, “Measurement of the semileptonic tt+γ production cross section in pp collisions at√s =8 TeV”, JHEP 10 (2017) 006, doi:10.1007/JHEP10(2017)006, arXiv:1706.08128.
[53] CMS Collaboration, “Measurement of the tt production cross section using events in the eµ final state in pp collisions at√s=13 TeV”, Eur. Phys. J. C 77 (2017) 172,
doi:10.1140/epjc/s10052-017-4718-8, arXiv:1611.04040.
[54] CMS Collaboration, “Jet energy scale and resolution in the CMS experiment in pp collisions at 8 TeV”, JINST 12 (2017) P02014,
doi:10.1088/1748-0221/12/02/P02014, arXiv:1607.03663.
[55] CMS Collaboration, “CMS luminosity measurements for the 2016 data taking period”, CMS Physics Analysis Summary CMS-PAS-LUM-17-001, 2017.
[56] T. Junk, “Confidence level computation for combining searches with small statistics”, Nucl. Instrum. Meth. A 434 (1999) 435, doi:10.1016/S0168-9002(99)00498-2, arXiv:hep-ex/9902006.
[57] A. L. Read, “Presentation of search results: The CLstechnique”, J. Phys. G 28 (2002) 2693,
doi:10.1088/0954-3899/28/10/313.
[58] The ATLAS Collaboration, The CMS Collaboration, The LHC Higgs Combination Group, “Procedure for the LHC Higgs boson search combination in Summer 2011”, Technical Report CMS-NOTE-2011-005, ATL-PHYS-PUB-2011-11, 2011.
[59] G. Cowan, K. Cranmer, E. Gross, and O. Vitells, “Asymptotic formulae for likelihood-based tests of new physics”, Eur. Phys. J. C 71 (2011) 1554,
doi:10.1140/epjc/s10052-011-1554-0, arXiv:1007.1727. [Erratum: doi:10.1140/epjc/s10052-013-2501-z].
19
A
The CMS Collaboration
Yerevan Physics Institute, Yerevan, Armenia
A.M. Sirunyan, A. Tumasyan
Institut f ¨ur Hochenergiephysik, Wien, Austria
W. Adam, F. Ambrogi, E. Asilar, T. Bergauer, J. Brandstetter, M. Dragicevic, J. Er ¨o, A. Escalante Del Valle, M. Flechl, R. Fr ¨uhwirth1, V.M. Ghete, J. Hrubec, M. Jeitler1, N. Krammer, I. Kr¨atschmer, D. Liko, T. Madlener, I. Mikulec, N. Rad, H. Rohringer, J. Schieck1, R. Sch ¨ofbeck,
M. Spanring, D. Spitzbart, A. Taurok, W. Waltenberger, J. Wittmann, C.-E. Wulz1, M. Zarucki
Institute for Nuclear Problems, Minsk, Belarus
V. Chekhovsky, V. Mossolov, J. Suarez Gonzalez
Universiteit Antwerpen, Antwerpen, Belgium
E.A. De Wolf, D. Di Croce, X. Janssen, J. Lauwers, M. Pieters, H. Van Haevermaet, P. Van Mechelen, N. Van Remortel
Vrije Universiteit Brussel, Brussel, Belgium
S. Abu Zeid, F. Blekman, J. D’Hondt, J. De Clercq, K. Deroover, G. Flouris, D. Lontkovskyi, S. Lowette, I. Marchesini, S. Moortgat, L. Moreels, Q. Python, K. Skovpen, S. Tavernier, W. Van Doninck, P. Van Mulders, I. Van Parijs
Universit´e Libre de Bruxelles, Bruxelles, Belgium
D. Beghin, B. Bilin, H. Brun, B. Clerbaux, G. De Lentdecker, H. Delannoy, B. Dorney, G. Fasanella, L. Favart, R. Goldouzian, A. Grebenyuk, A.K. Kalsi, T. Lenzi, J. Luetic, N. Postiau, E. Starling, L. Thomas, C. Vander Velde, P. Vanlaer, D. Vannerom, Q. Wang
Ghent University, Ghent, Belgium
T. Cornelis, D. Dobur, A. Fagot, M. Gul, I. Khvastunov2, D. Poyraz, C. Roskas, D. Trocino, M. Tytgat, W. Verbeke, B. Vermassen, M. Vit, N. Zaganidis
Universit´e Catholique de Louvain, Louvain-la-Neuve, Belgium
H. Bakhshiansohi, O. Bondu, S. Brochet, G. Bruno, C. Caputo, P. David, C. Delaere, M. Delcourt, A. Giammanco, G. Krintiras, V. Lemaitre, A. Magitteri, A. Mertens, K. Piotrzkowski, A. Saggio, M. Vidal Marono, S. Wertz, J. Zobec
Centro Brasileiro de Pesquisas Fisicas, Rio de Janeiro, Brazil
F.L. Alves, G.A. Alves, M. Correa Martins Junior, G. Correia Silva, C. Hensel, A. Moraes, M.E. Pol, P. Rebello Teles
Universidade do Estado do Rio de Janeiro, Rio de Janeiro, Brazil
E. Belchior Batista Das Chagas, W. Carvalho, J. Chinellato3, E. Coelho, E.M. Da Costa, G.G. Da Silveira4, D. De Jesus Damiao, C. De Oliveira Martins, S. Fonseca De Souza, H. Malbouisson, D. Matos Figueiredo, M. Melo De Almeida, C. Mora Herrera, L. Mundim, H. Nogima, W.L. Prado Da Silva, L.J. Sanchez Rosas, A. Santoro, A. Sznajder, M. Thiel, E.J. Tonelli Manganote3, F. Torres Da Silva De Araujo, A. Vilela Pereira
Universidade Estadual Paulistaa, Universidade Federal do ABCb, S˜ao Paulo, Brazil
S. Ahujaa, C.A. Bernardesa, L. Calligarisa, T.R. Fernandez Perez Tomeia, E.M. Gregoresb, P.G. Mercadanteb, S.F. Novaesa, SandraS. Padulaa
Bulgaria
A. Aleksandrov, R. Hadjiiska, P. Iaydjiev, A. Marinov, M. Misheva, M. Rodozov, M. Shopova, G. Sultanov
University of Sofia, Sofia, Bulgaria
A. Dimitrov, L. Litov, B. Pavlov, P. Petkov
Beihang University, Beijing, China
W. Fang5, X. Gao5, L. Yuan
Institute of High Energy Physics, Beijing, China
M. Ahmad, J.G. Bian, G.M. Chen, H.S. Chen, M. Chen, Y. Chen, C.H. Jiang, D. Leggat, H. Liao, Z. Liu, F. Romeo, S.M. Shaheen6, A. Spiezia, J. Tao, Z. Wang, E. Yazgan, H. Zhang, S. Zhang6, J. Zhao
State Key Laboratory of Nuclear Physics and Technology, Peking University, Beijing, China
Y. Ban, G. Chen, A. Levin, J. Li, L. Li, Q. Li, Y. Mao, S.J. Qian, D. Wang, Z. Xu
Tsinghua University, Beijing, China
Y. Wang
Universidad de Los Andes, Bogota, Colombia
C. Avila, A. Cabrera, C.A. Carrillo Montoya, L.F. Chaparro Sierra, C. Florez, C.F. Gonz´alez Hern´andez, M.A. Segura Delgado
University of Split, Faculty of Electrical Engineering, Mechanical Engineering and Naval Architecture, Split, Croatia
B. Courbon, N. Godinovic, D. Lelas, I. Puljak, T. Sculac
University of Split, Faculty of Science, Split, Croatia
Z. Antunovic, M. Kovac
Institute Rudjer Boskovic, Zagreb, Croatia
V. Brigljevic, D. Ferencek, K. Kadija, B. Mesic, A. Starodumov7, T. Susa
University of Cyprus, Nicosia, Cyprus
M.W. Ather, A. Attikis, M. Kolosova, G. Mavromanolakis, J. Mousa, C. Nicolaou, F. Ptochos, P.A. Razis, H. Rykaczewski
Charles University, Prague, Czech Republic
M. Finger8, M. Finger Jr.8
Escuela Politecnica Nacional, Quito, Ecuador
E. Ayala
Universidad San Francisco de Quito, Quito, Ecuador
E. Carrera Jarrin
Academy of Scientific Research and Technology of the Arab Republic of Egypt, Egyptian Network of High Energy Physics, Cairo, Egypt
A. Ellithi Kamel9, S. Khalil10, E. Salama11,12
National Institute of Chemical Physics and Biophysics, Tallinn, Estonia
S. Bhowmik, A. Carvalho Antunes De Oliveira, R.K. Dewanjee, K. Ehataht, M. Kadastik, M. Raidal, C. Veelken
21
Department of Physics, University of Helsinki, Helsinki, Finland
P. Eerola, H. Kirschenmann, J. Pekkanen, M. Voutilainen
Helsinki Institute of Physics, Helsinki, Finland
J. Havukainen, J.K. Heikkil¨a, T. J¨arvinen, V. Karim¨aki, R. Kinnunen, T. Lamp´en, K. Lassila-Perini, S. Laurila, S. Lehti, T. Lind´en, P. Luukka, T. M¨aenp¨a¨a, H. Siikonen, E. Tuominen, J. Tuominiemi
Lappeenranta University of Technology, Lappeenranta, Finland
T. Tuuva
IRFU, CEA, Universit´e Paris-Saclay, Gif-sur-Yvette, France
M. Besancon, F. Couderc, M. Dejardin, D. Denegri, J.L. Faure, F. Ferri, S. Ganjour, A. Givernaud, P. Gras, G. Hamel de Monchenault, P. Jarry, C. Leloup, E. Locci, J. Malcles, G. Negro, J. Rander, A. Rosowsky, M. ¨O. Sahin, M. Titov
Laboratoire Leprince-Ringuet, Ecole polytechnique, CNRS/IN2P3, Universit´e Paris-Saclay, Palaiseau, France
A. Abdulsalam13, C. Amendola, I. Antropov, F. Beaudette, P. Busson, C. Charlot,
R. Granier de Cassagnac, I. Kucher, A. Lobanov, J. Martin Blanco, C. Martin Perez, M. Nguyen, C. Ochando, G. Ortona, P. Paganini, P. Pigard, J. Rembser, R. Salerno, J.B. Sauvan, Y. Sirois, A.G. Stahl Leiton, A. Zabi, A. Zghiche
Universit´e de Strasbourg, CNRS, IPHC UMR 7178, Strasbourg, France
J.-L. Agram14, J. Andrea, D. Bloch, J.-M. Brom, E.C. Chabert, V. Cherepanov, C. Collard, E. Conte14, J.-C. Fontaine14, D. Gel´e, U. Goerlach, M. Jansov´a, A.-C. Le Bihan, N. Tonon, P. Van Hove
Centre de Calcul de l’Institut National de Physique Nucleaire et de Physique des Particules, CNRS/IN2P3, Villeurbanne, France
S. Gadrat
Universit´e de Lyon, Universit´e Claude Bernard Lyon 1, CNRS-IN2P3, Institut de Physique Nucl´eaire de Lyon, Villeurbanne, France
S. Beauceron, C. Bernet, G. Boudoul, N. Chanon, R. Chierici, D. Contardo, P. Depasse, H. El Mamouni, J. Fay, L. Finco, S. Gascon, M. Gouzevitch, G. Grenier, B. Ille, F. Lagarde, I.B. Laktineh, H. Lattaud, M. Lethuillier, L. Mirabito, S. Perries, A. Popov15, V. Sordini, G. Touquet, M. Vander Donckt, S. Viret
Georgian Technical University, Tbilisi, Georgia
A. Khvedelidze8
Tbilisi State University, Tbilisi, Georgia
Z. Tsamalaidze8
RWTH Aachen University, I. Physikalisches Institut, Aachen, Germany
C. Autermann, L. Feld, M.K. Kiesel, K. Klein, M. Lipinski, M. Preuten, M.P. Rauch, C. Schomakers, J. Schulz, M. Teroerde, B. Wittmer
RWTH Aachen University, III. Physikalisches Institut A, Aachen, Germany
A. Albert, D. Duchardt, M. Erdmann, S. Erdweg, T. Esch, R. Fischer, S. Ghosh, A. G ¨uth, T. Hebbeker, C. Heidemann, K. Hoepfner, H. Keller, L. Mastrolorenzo, M. Merschmeyer, A. Meyer, P. Millet, S. Mukherjee, T. Pook, M. Radziej, H. Reithler, M. Rieger, A. Schmidt, D. Teyssier, S. Th ¨uer
RWTH Aachen University, III. Physikalisches Institut B, Aachen, Germany
G. Fl ¨ugge, O. Hlushchenko, T. Kress, A. K ¨unsken, T. M ¨uller, A. Nehrkorn, A. Nowack, C. Pistone, O. Pooth, D. Roy, H. Sert, A. Stahl16
Deutsches Elektronen-Synchrotron, Hamburg, Germany
M. Aldaya Martin, T. Arndt, C. Asawatangtrakuldee, I. Babounikau, K. Beernaert, O. Behnke, U. Behrens, A. Berm ´udez Mart´ınez, D. Bertsche, A.A. Bin Anuar, K. Borras17, V. Botta, A. Campbell, P. Connor, C. Contreras-Campana, V. Danilov, A. De Wit, M.M. Defranchis, C. Diez Pardos, D. Dom´ınguez Damiani, G. Eckerlin, T. Eichhorn, A. Elwood, E. Eren, E. Gallo18, A. Geiser, J.M. Grados Luyando, A. Grohsjean, M. Guthoff, M. Haranko, A. Harb, J. Hauk, H. Jung, M. Kasemann, J. Keaveney, C. Kleinwort, J. Knolle, D. Kr ¨ucker, W. Lange, A. Lelek, T. Lenz, J. Leonard, K. Lipka, W. Lohmann19, R. Mankel, I.-A. Melzer-Pellmann,
A.B. Meyer, M. Meyer, M. Missiroli, G. Mittag, J. Mnich, V. Myronenko, S.K. Pflitsch, D. Pitzl, A. Raspereza, M. Savitskyi, P. Saxena, P. Sch ¨utze, C. Schwanenberger, R. Shevchenko, A. Singh, H. Tholen, O. Turkot, A. Vagnerini, G.P. Van Onsem, R. Walsh, Y. Wen, K. Wichmann, C. Wissing, O. Zenaiev
University of Hamburg, Hamburg, Germany
R. Aggleton, S. Bein, L. Benato, A. Benecke, V. Blobel, T. Dreyer, A. Ebrahimi, E. Garutti, D. Gonzalez, P. Gunnellini, J. Haller, A. Hinzmann, A. Karavdina, G. Kasieczka, R. Klanner, R. Kogler, N. Kovalchuk, S. Kurz, V. Kutzner, J. Lange, D. Marconi, J. Multhaup, M. Niedziela, C.E.N. Niemeyer, D. Nowatschin, A. Perieanu, A. Reimers, O. Rieger, C. Scharf, P. Schleper, S. Schumann, J. Schwandt, J. Sonneveld, H. Stadie, G. Steinbr ¨uck, F.M. Stober, M. St ¨over, A. Vanhoefer, B. Vormwald, I. Zoi
Karlsruher Institut fuer Technologie, Karlsruhe, Germany
M. Akbiyik, C. Barth, M. Baselga, S. Baur, E. Butz, R. Caspart, T. Chwalek, F. Colombo, W. De Boer, A. Dierlamm, K. El Morabit, N. Faltermann, B. Freund, M. Giffels, M.A. Harrendorf, F. Hartmann16, S.M. Heindl, U. Husemann, I. Katkov15, S. Kudella, S. Mitra, M.U. Mozer, Th. M ¨uller, M. Musich, M. Plagge, G. Quast, K. Rabbertz, M. Schr ¨oder, I. Shvetsov, H.J. Simonis, R. Ulrich, S. Wayand, M. Weber, T. Weiler, C. W ¨ohrmann, R. Wolf
Institute of Nuclear and Particle Physics (INPP), NCSR Demokritos, Aghia Paraskevi, Greece
G. Anagnostou, G. Daskalakis, T. Geralis, A. Kyriakis, D. Loukas, G. Paspalaki, I. Topsis-Giotis
National and Kapodistrian University of Athens, Athens, Greece
G. Karathanasis, S. Kesisoglou, P. Kontaxakis, A. Panagiotou, I. Papavergou, N. Saoulidou, E. Tziaferi, K. Vellidis
National Technical University of Athens, Athens, Greece
K. Kousouris, I. Papakrivopoulos, G. Tsipolitis
University of Io´annina, Io´annina, Greece
I. Evangelou, C. Foudas, P. Gianneios, P. Katsoulis, P. Kokkas, S. Mallios, N. Manthos, I. Papadopoulos, E. Paradas, J. Strologas, F.A. Triantis, D. Tsitsonis
MTA-ELTE Lend ¨ulet CMS Particle and Nuclear Physics Group, E ¨otv ¨os Lor´and University, Budapest, Hungary
M. Bart ´ok20, M. Csanad, N. Filipovic, P. Major, M.I. Nagy, G. Pasztor, O. Sur´anyi, G.I. Veres
Wigner Research Centre for Physics, Budapest, Hungary
G. Bencze, C. Hajdu, D. Horvath21, ´A. Hunyadi, F. Sikler, T. ´A. V´ami, V. Veszpremi, G. Vesztergombi†