EUROPEAN ORGANIZATION FOR NUCLEAR RESEARCH (CERN)
CERN-EP-2018-126 2018/09/06
CMS-SMP-16-007
Measurement of the weak mixing angle using the
forward-backward asymmetry of Drell–Yan events in pp
collisions at 8 TeV
The CMS Collaboration
∗Abstract
A measurement is presented of the effective leptonic weak mixing angle ( sin2θ`eff)
using the forward-backward asymmetry of Drell–Yan lepton pairs (µµ and ee) pro-duced in proton-proton collisions at√s = 8 TeV at the CMS experiment of the LHC. The data correspond to integrated luminosities of 18.8 and 19.6 fb−1 in the dimuon and dielectron channels, respectively, containing 8.2 million dimuon and 4.9 million dielectron events. With more events and new analysis techniques, including con-straints obtained on the parton distribution functions from the measured forward-backward asymmetry, the statistical and systematic uncertainties are significantly re-duced relative to previous CMS measurements. The extracted value of sin2θeff` from
the combined dilepton data is sin2θeff` = 0.23101±0.00036 (stat)±0.00018 (syst)±
0.00016 (theo)±0.00031 (parton distributions in proton)=0.23101±0.00053.
Published in the European Physical Journal C as doi:10.1140/epjc/s10052-018-6148-7.
c
2018 CERN for the benefit of the CMS Collaboration. CC-BY-4.0 license
∗See Appendix A for the list of collaboration members
1
1
Introduction
We report a measurement of the effective leptonic weak mixing angle (sin2θeff` ) using the
forward-backward asymmetry (AFB) in Drell–Yan qq → `+`− events, where `stands for muon (µ) or
electron (e). The analysis is based on data from the CMS experiment at the CERN LHC. At leading order (LO), lepton pairs are produced through the annihilation of a quark with its an-tiquark into a Z boson or a virtual photon: qq →Z/γ → `+`−. For a given dilepton invariant
mass m``, the differential cross section at LO can be expressed at the parton level as
dσ
d(cos θ∗) ∝ 1+cos
2
θ∗+A4cos θ∗, (1)
where the(1+cos2θ∗)term arises from the spin-1 of the exchanged boson, and the cos θ∗term
originates from interference between vector and axial-vector contributions. The definition of AFB is based on the angle θ∗ of the negative lepton (`−) in the Collins–Soper [1] frame of the
dilepton system: AFB= 3 8A4 = σF−σB σF+σB , (2)
where σFand σB are, respectively, the cross sections in the forward (cos θ∗ >0) and backward
(cos θ∗ <0) hemispheres. In this frame, θ∗is the angle of the`−relative to the axis that bisects the angle between the direction of the quark and the reversed direction of the antiquark. In proton-proton (pp) collisions, the direction of the quark is more likely to be in the direction of the Lorentz boost of the dilepton. Therefore, cos θ∗ can be calculated using the following variables in the laboratory frame:
cos θ∗ = 2(P + 1 P − 2 −P1−P + 2 ) q m2 ``(m2``+p2T,``) pz,`` |pz,``| , (3)
where m``, pT,``, and pz,`` are the mass, transverse momentum, and longitudinal momentum,
respectively, of the dilepton system, and the Pi± are defined in terms of the energies (Ei) and
longitudinal momenta (pz,i), of the negatively and positively charged leptons as Pi± = (Ei±
pz,i)/
√
2 [1].
A non-zero AFBvalue in dilepton events arises from the vector and axial-vector couplings of
electroweak bosons to fermions. At LO, these respective couplings of Z bosons to fermions (f) can be expressed as:
vf=T3f−2Qfsin2θW, (4)
af=T3f, (5)
where Qf and T3f are the charge and the third component of the weak isospin of the fermion, respectively, and sin2θW refers to the weak mixing angle, which is related to the masses of
the W and Z bosons through the relation sin2θW = 1−m2W/m2Z. Electroweak (EW) radiative
corrections affect these LO relations. In the improved Born approximation [2, 3], some of the higher-order corrections are absorbed into an effective mixing angle. The effective weak mixing angle is based on the relation vf/af = 1−4|Qf|sin2θfeff, with sin2θefff = κfsin2θW, where the
flavor-dependent κf is determined through EW corrections. The AFB for dilepton events is
sensitive primarily to sin2θ`eff.
We measure sin2θ`effby fitting the mass and rapidity (y``)dependence of the observed AFBin
dilepton events to standard model (SM) predictions as a function of sin2θeff` . The most
pre-cise previous measurements of sin2θeff` were performed by the combined LEP and SLD
the two most precise values. Other measurements of sin2θeff` have also been reported by the
Tevatron and LHC experiments [5–15].
Using the LO expressions for the Z boson, virtual photon exchange, and their interference, the “true” AFB(i.e., using the quark direction in the definition of cos θ∗) can be evaluated as
AtrueFB (m``) =
6a`aq(8v`vq−QqKDm)
16(v2
`+a2`)(v2q+a2q) −8v`vqQqKDm+Q2qK2(D2m+Γ2Z/m2Z)
, (6)
where the subscript q refers to the participating quark, K =8√2πα/GFm2Z, Dm =1−m2Z/m2``, αis the electromagnetic coupling, GFis the Fermi constant, andΓZis the full decay width of
the Z boson. A strong dependence of AFBon m``originates from axial and vector interference.
The AFBis negative at small m`` and positive at large values, crossing AFB = 0 slightly below
the Z boson peak.
In collisions of hadrons, AFB is sensitive to parton distribution functions (PDFs) for two
rea-sons. First, the different couplings of u- and d-type quarks to EW bosons generate different AFBvalues in the corresponding production channels, which means that the average depends
on the relative contributions of u- and d-type quarks to the total cross section. Second, the definition of AFB in pp collisions is based on the sign of y``, which relies on the fact that on
average the dilepton pairs are Lorentz-boosted in the quark direction. Therefore, a non-zero average AFBoriginates only from valence-quark production channels and is diluted by events
where the antiquark carries a larger momentum than the quark. A dependence of the “true” and diluted AFBon dilepton mass for different qq production channels and their sum is shown
in Fig. 1. (GeV) ll m 60 70 80 90 100 110 120 true FB A 0.8 − 0.6 − 0.4 − 0.2 − 0 0.2 0.4 0.6 0.8 d d uu s s cc b b qq PYTHIA 8 LO NNPDF3.0 (GeV) ll m 60 70 80 90 100 110 120 FB A 0.8 − 0.6 − 0.4 − 0.2 − 0 0.2 0.4 0.6 0.8 d d uu s s cc b b qq PYTHIA 8 LO NNPDF3.0 (GeV) ll m 60 70 80 90 100 110 120 FB A 0.8 − 0.6 − 0.4 − 0.2 − 0 0.2 0.4 0.6 0.8 PYTHIA 8 LO NNPDF3.0 | < 0.4 ll y 0.0 < | | < 0.8 ll y 0.4 < | | < 1.2 ll y 0.8 < | | < 1.6 ll y 1.2 < | | < 2.0 ll y 1.6 < | | < 2.4 ll y 2.0 < |
Figure 1: The dependence of AFBon m``in dimuon events generated usingPYTHIA 8.212 [16]
and the LO NNPDF3.0 [17] PDFs for dimuon rapidities of |y``| < 2.4. The distributions for
the total production (qq) and the different channels are given on the left, overlaid with results based on Eq. (6), using the definition of AtrueFB (m``)for the known quark direction. The middle
panel gives the diluted AFB using instead the direction of the dilepton boost, and the right
panel shows the diluted AFBin|y``|bins of 0.4 for all channels.
The dilution of AFBdepends strongly on y``, as shown in Fig. 1. At zero rapidity, the quark and
antiquark carry equal momenta, and the dilution is maximal, resulting in AFB = 0. The AFBis
measured in 12 bins of dilepton mass, covering the range 60< m``< 120 GeV, and 6|y``|bins
of equal size for|y``| < 2.4. The boundaries in the dilepton mass are at: 60, 70, 78, 84, 87, 89,
91, 93, 95, 98, 104, 112, and 120 GeV. The mass bins are chosen such that near mZthe bin widths
are larger than the mass resolution in any of the ranges of y``. Smaller and larger mass bins are
3
measurement. The weak dependence of AFB on pT,`` is included in the SM predictions. The
uncertainty originating from modeling of pT,`` is very small and included in the theoretical
estimates.
2
The CMS detector
The central feature of the CMS apparatus is a superconducting solenoid of 6 m internal diame-ter, providing a magnetic field of 3.8 T. A silicon pixel and strip tracker, a lead tungstate crystal electromagnetic calorimeter (ECAL), and a brass and scintillator hadron calorimeter (HCAL), each composed of a barrel and two endcap sections reside within the solenoid volume. For-ward calorimeters extend the pseudorapidity η coverage provided by the barrel and endcap detectors. Muons are measured in gas-ionization detectors embedded in the steel flux-return yoke outside the solenoid. A more detailed description of the CMS detector can be found in Ref. [18].
Muons are measured in the range |η| < 2.4, using detection planes based on the drift-tube,
cathode-strip chamber, or resistive-plate chamber technologies. Matching muons to tracks measured in the silicon tracker provides a relative transverse momentum resolution for muons with 20 < pT < 100 GeV of 1.3–2.0% in the barrel, and less than 6% in the endcaps. The pT
resolution in the barrel is smaller than 10% for muons with pTup to 1 TeV [19].
The electromagnetic calorimeter consists of 75 848 lead tungstate crystals that provide a cov-erage of |η| < 1.48 in the barrel region and 1.48 < |η| < 3.00 in the two endcap regions.
Preshower detectors consisting of two planes of silicon sensors, interleaved with a total of 3 ra-diation lengths of lead, are located in front of each endcap detector. The electron momentum is obtained by combining the energy measurement in the ECAL with that in the tracker. The momentum resolution for electrons with pT ≈ 45 GeV from Z →ee decays, ranges from 1.7%
for nonshowering electrons in the barrel region, to 4.5% for showering electrons in the end-caps [20].
Events of interest are selected using a two-tiered trigger system [21]. The first level, consisting of custom hardware processors, uses information from the calorimeters and muon detectors to select events at a rate of about 100 kHz within a time interval of less than 4 µs. The second level, known as the high-level trigger, consists of a farm of processors running a version of the full event reconstruction software optimized for fast processing, that reduces the event rate to about 1 kHz before data storage.
3
Data and simulated events
The measurement is based on pp collisions at √s = 8 TeV recorded by the CMS Experiment in 2012, corresponding to integrated luminosities of 18.8 and 19.6 fb−1 for muon and electron channels, respectively.
Candidates for the dimuon channel are collected using an isolated single-muon trigger with a pT threshold of 24 GeV and|η| < 2.4. At the beginning of data taking, the muon trigger was
restricted to|η| <2.1. We do not use these events, and the integrated luminosity in the dimuon
analysis is therefore somewhat smaller than for dielectrons. Background contamination is re-duced by applying identification and isolation criteria to the reconstructed muons. First, muon tracks are required to be reconstructed independently in the inner tracker and in the outer muon detectors. A global fit to the momentum, including both tracker and muon detector hits, must have a fitted χ2/dof < 10, where dof stands for the degrees of freedom. Muon tracks
are required to pass within a transverse distance of 0.2 cm from the primary vertex, defined as the pp vertex with the largest∑ p2Tof its associated tracks. Muon candidates are rejected if the scalar-pT sum of all tracks within a cone of∆R =
√
(∆η)2+ (∆φ)2 =0.3 around the muon is larger than 10% of the pT of the muon (this is referred to as track isolation, with φ being
the azimuth in radians). The track isolation requirement is insensitive to contributions from additional soft pp interactions (pileup). An event is selected when there are at least two iso-lated muons, with the leading muon (i.e., the one with largest pT) having pT >25 GeV, and the
next-to-leading muon having pT >15 GeV. At least one muon with pT >25 GeV is required to
trigger the event. For the Drell–Yan signal, the two leptons are required to have opposite sign (OS).
Dielectron candidates are collected using a single-electron trigger with a pTthreshold of 27 GeV
and|η| < 2.5. Variables pertaining to the energy distribution in electromagnetic showers and
to impact parameters of inner tracks are used to separate prompt electrons from electrons orig-inating from photon conversions in detector material. The jet background from SM events produced through quantum chromodynamics (QCD) is referred to as multijet production. A particle-flow (PF) event reconstruction algorithm is used to identify different particle types (photons, electrons, muons, and charged and neutral hadrons [22]). The scalar-pTsum of all PF
particles in a cone of∆R< 0.3 around the electron direction is required to be less than 15% of the electron pT, which reduces the background from hadrons in multijet events that are
recon-structed incorrectly as electrons. This sum is corrected for contributions from pileup [20]. The electron momentum is evaluated by combining the energy in the ECAL with the momentum in the tracker. To ensure good reconstruction, the coverage is restricted to|η| < 2.4, excluding
the transition region of 1.44 < |η| < 1.57 between the ECAL barrel and endcap detectors, as
electron reconstruction in this region is not optimal. Dielectron candidates are selected when at least two OS electrons pass all quality requirements. The leading and next-to-leading electrons must have respectively pT >30 and>20 GeV, with the triggering electron always required to
have pT >30 GeV.
A total of about 8.2 million dimuon and 4.9 million dielectron candidate events are selected for further analysis. The number of dielectron events is smaller because of the higher pTthresholds
and more stringent selection criteria implemented in electron selections. The Z/γ → µ+µ−
and Z/γ → e+e− data include small (<1%) background contaminations that originate from
Z/γ → τ+τ−, tt, single top quark, and diboson (WW, WZ, and ZZ) events, as well as
mul-tijet and W+jets events. Contributions from these backgrounds are subtracted from data as described below. Contamination from photon-induced background near the Z boson peak is negligible [23].
Monte Carlo (MC) simulation is used to model signal and background processes. The sig-nal as well as the single-boson and top quark backgrounds are based on next-to-leading or-der (NLO) matrix elements implemented in thePOWHEGv1 event generator [24–27] using the CT10 [28] PDFs. The generator is interfaced toPYTHIA6.426 [29] using the Z2* [30, 31] underly-ing event tune, which generates the parton showerunderly-ing, the hadronization, and the electromag-netic final-state radiation (FSR). The background events from τ lepton decays are simulated
with TAUOLA 2.7 [32]. Diboson and multijet background events are generated with PYTHIA
6 using the CTEQ6L1 PDFs [33]. Simulated minimum-bias events are superimposed on the hard-interaction events to model the effects from pileup. The detector response to all particles is simulated through GEANT4 [34], and all final-state objects are reconstructed using the same
5
4
Corrections and backgrounds
The MC simulations are corrected to improve the modeling of the data. First, weight factors are applied to all simulated events to match the pileup distribution in data, which consists of roughly 20 interactions per crossing. These weights are based on the measured instantaneous luminosity and the total inelastic cross section that provides a good description of the average number of reconstructed vertices.
The total lepton-selection efficiency is factorized into the product of reconstruction, identifica-tion, isolaidentifica-tion, and trigger efficiencies, with each component measured in samples of Z/γ → `+`−events through a “tag-and-probe” method [19, 20], in bins of lepton p
T and η. A
charge-dependent efficiency in the muon triggering and reconstruction was observed in previous CMS measurements [35]. In the muon channel, all efficiencies are therefore determined separately for positively and negatively charged muons. The same procedures are used for data as for the simulated events, and scale factors are extracted to match the simulated event-selection efficiencies to those in the data.
The lepton momentum is calibrated using Z/γ → `+`−events [36]. The dominant sources of
the mismeasurement of muon momentum originate from the mismodeling of tracker alignment and of the magnetic field. The correction parameters are obtained in bins of muon η and φ. First, the average 1/pTvalues of the reconstructed muon curvature in data and simulation are
corrected to the corresponding values calculated for MC generated muons. Then, using MC simulation, the resolution in the reconstructed muon momentum is parametrized as a function of the muon pT in bins of muon|η|and the number of tracker hits used in the reconstruction.
Next, the correction parameters of the muon momentum scale are fine-tuned by matching the average dimuon mass in each bin of muon charge, η, and φ to their reference values. At this point, the “reference” distributions, which are based on the generated muons, are smeared by the reconstruction resolution derived in the previous step. Finally, the scale factors for the muon momentum resolution, in bins of muon |η|, are determined by fitting the “reference”
dimuon mass distribution to data.
A similar procedure is followed for electrons to reduce the small residual difference between the data and MC simulation. Unlike for muons, the measured electron energy is dominated by the calorimeter, and the corrections are extracted identically for electrons and positrons. The electron energy-scale parameters are fine-tuned by correcting the average dielectron mass in each bin of electron η and φ to the corresponding “reference” values. Here, the “reference” distributions are based on the generated electrons (post FSR), combined with the FSR photons in a cone, and smeared by the reconstructed energy resolution.
The EW and top quark backgrounds are estimated using MC simulations based on the cross sections calculated at next-to-the-next-to-leading order in QCD [37, 38] and normalized to the integrated luminosity. We use cross sections calculated at NLO for the diboson backgrounds. The multijet background in dimuon events, dominated by muons from heavy-flavor hadron decays, is evaluated using same-sign (SS) dimuon events. A small EW and top quark contami-nation is evaluated in an MC simulation and subtracted from the SS sample. The distributions are then scaled by roughly a factor of 2, estimated from simulated events, to obtain the multi-jet contamination in the signal OS dimuon sample. The multimulti-jet background in the dielectron analysis is evaluated using the SS sample in combination with the eµ events to subtract the contribution from the OS events caused by the misidentification of charge. The distributions used to estimate the background from jets misidentified as leptons (that include the multijet and W+jet events) are obtained from the SS eµ sample. These distributions are used to fit the dielectron mass distribution in the SS events in each y``bin to extract the normalization of this
background.
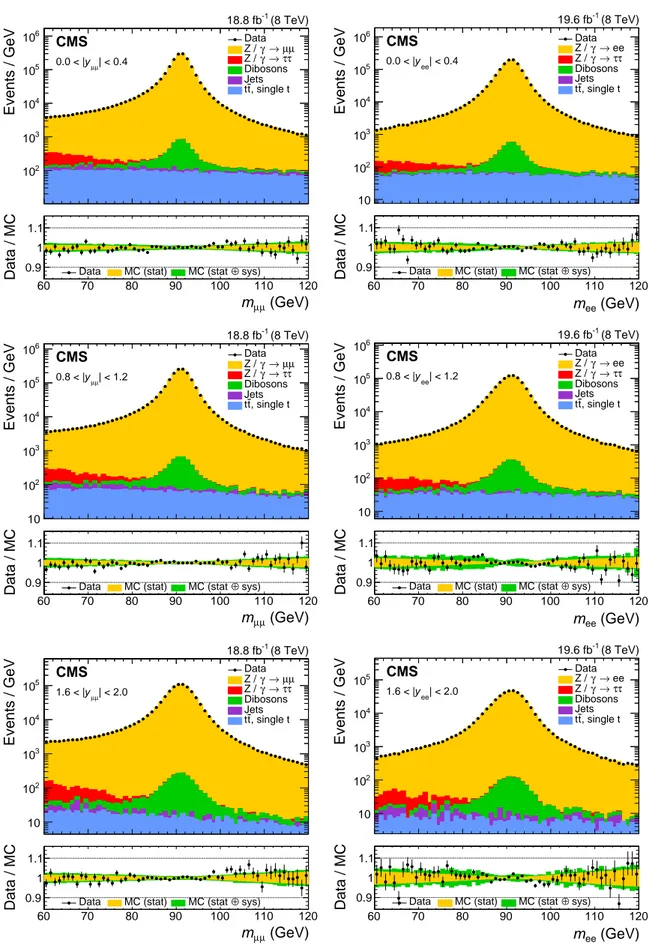
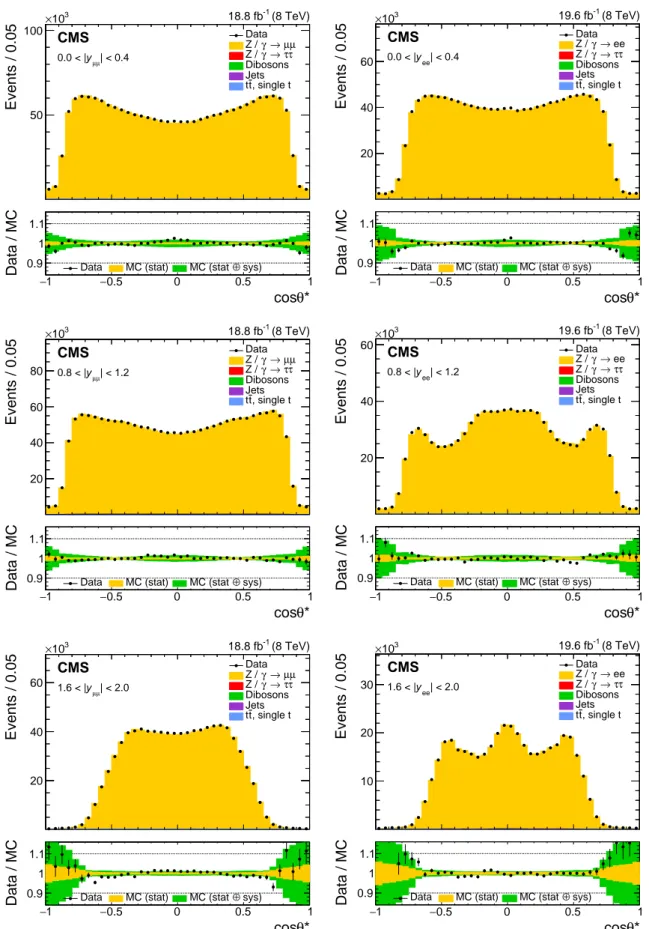
The dilepton mass and cos θ∗distributions in three of the six rapidity bins are shown in Figs. 2 and 3, respectively. The figures include lepton momentum and efficiency corrections, back-ground samples normalized as described above, and the signal normalized to the total expected number of events in the data.
5
Weighted
A
FBmeasurement
As introduced in Section 1, the LO angular distribution of dilepton events has a(1+cos2θ∗)
term that arises from the spin-1 of the exchanged boson and a cos θ∗ term that originates from the interference between vector and axial-vector contributions. However, there is also a(1−
3 cos2θ∗)NLO term that originates from the p
Tof the interacting partons [39]. Each (m``, y``)
bin of the dilepton pair at NLO therefore has an angular distribution in cos θ∗ that follows the form [39]: 1 σ dσ d cos θ∗ = 3 8 h 1+cos2θ∗+ A0 2 (1−3 cos 2 θ∗) +A4cos θ∗ i . (7)
The AFBvalue in each(m``, y``)bin is calculated using the “angular event weighting” method,
described in Ref. [40], in which each event with a cos θ∗ value (denoted as “c”), is reflected in the denominator (D) and numerator (N) weights through:
wD = 1 2 c2 (1+c2+h)3, (8) wN= 1 2 |c| (1+c2+h)2, (9)
where h = 0.5A0(1−3c2). Here, as a baseline we use the pT,``-averaged A0 value of about
0.1 in each measurement(m``, y``) bin, as predicted by the signal MC simulation. Using the
weighted sums N and D for forward (cos θ∗ >0) and backward (cos θ∗ <0) events, we obtain DF=
∑
c>0 wD, DB=∑
c<0 wD, (10) NF =∑
c>0 wN, NB =∑
c<0 wN, (11)from which the weighted AFBof Eq. (2) can be written as:
AFB = 3 8 NF−NB DF+DB . (12)
The statistical uncertainty in this weighted AFB value takes into account correlations among
the numerator and denominator sums. For data, the background contribution in the event-weighted sums are subtracted before calculating AFB. In the full phase space, the values of the
weighted and the nominal AFB, calculated as an asymmetry between the total event counts in
the forward and backward hemispheres, are the same. Since the acceptances of the forward and backward events are equal for same values of |cos θ∗|, the fiducial values of the event-weighted AFB are also the same as in the full phase space, while the nominal AFB values are
smaller because of the limited acceptance at large cos θ∗. This feature makes an event-weighted AFBless sensitive than the nominal AFBto the specific modeling of the acceptance. In addition,
because the event-weighted AFBexploits the full distribution in cos θ∗, as opposed to only its
7 Events / GeV 2 10 3 10 4 10 5 10 6 10 (8 TeV) -1 18.8 fb CMS | < 0.4 µ µ y 0.0 < | Data µ µ → γ Z / τ τ → γ Z / Dibosons Jets , single t t t (GeV) µ µ m 60 70 80 90 100 110 120 Data / MC 0.9 1 1.1
Data MC (stat) MC (stat ⊕ sys)
Events / GeV 10 2 10 3 10 4 10 5 10 6 10 | < 0.4 ee y 0.0 < | (8 TeV) -1 19.6 fb CMS Data ee → γ Z / τ τ → γ Z / Dibosons Jets , single t t t (GeV) ee m 60 70 80 90 100 110 120 Data / MC 0.9 1 1.1
Data MC (stat) MC (stat ⊕ sys)
Events / GeV 10 2 10 3 10 4 10 5 10 6 10 (8 TeV) -1 18.8 fb CMS | < 1.2 µ µ y 0.8 < | Data µ µ → γ Z / τ τ → γ Z / Dibosons Jets , single t t t (GeV) µ µ m 60 70 80 90 100 110 120 Data / MC 0.9 1 1.1
Data MC (stat) MC (stat ⊕ sys)
Events / GeV 10 2 10 3 10 4 10 5 10 6 10 | < 1.2 ee y 0.8 < | (8 TeV) -1 19.6 fb CMS Data ee → γ Z / τ τ → γ Z / Dibosons Jets , single t t t (GeV) ee m 60 70 80 90 100 110 120 Data / MC 0.9 1 1.1
Data MC (stat) MC (stat ⊕ sys)
Events / GeV 10 2 10 3 10 4 10 5 10 (8 TeV) -1 18.8 fb CMS | < 2.0 µ µ y 1.6 < | Data µ µ → γ Z / τ τ → γ Z / Dibosons Jets , single t t t (GeV) µ µ m 60 70 80 90 100 110 120 Data / MC 0.9 1 1.1
Data MC (stat) MC (stat ⊕ sys)
Events / GeV 10 2 10 3 10 4 10 5 10 | < 2.0 ee y 1.6 < | (8 TeV) -1 19.6 fb CMS Data ee → γ Z / τ τ → γ Z / Dibosons Jets , single t t t (GeV) ee m 60 70 80 90 100 110 120 Data / MC 0.9 1 1.1
Data MC (stat) MC (stat ⊕ sys)
Figure 2: Dimuon (left) and dielectron (right) mass distributions in three representative bins in rapidity:|y``| <0.4 (upper), 0.8< |y``| <1.2 (middle), and 1.6< |y``| <2.0 (lower).
Events / 0.05 50 100 3 10 × 18.8 fb-1 (8 TeV) CMS | < 0.4 µ µ y 0.0 < | Data µ µ → γ Z / τ τ → γ Z / Dibosons Jets , single t t t * θ cos 1 − −0.5 0 0.5 1 Data / MC 0.9 1 1.1
Data MC (stat) MC (stat ⊕ sys)
Events / 0.05 20 40 60 3 10 × | < 0.4 ee y 0.0 < | (8 TeV) -1 19.6 fb CMS Data ee → γ Z / τ τ → γ Z / Dibosons Jets , single t t t * θ cos 1 − −0.5 0 0.5 1 Data / MC 0.9 1 1.1
Data MC (stat) MC (stat ⊕ sys)
Events / 0.05 20 40 60 80 3 10 × 18.8 fb-1 (8 TeV) CMS | < 1.2 µ µ y 0.8 < | Data µ µ → γ Z / τ τ → γ Z / Dibosons Jets , single t t t * θ cos 1 − −0.5 0 0.5 1 Data / MC 0.9 1 1.1
Data MC (stat) MC (stat ⊕ sys)
Events / 0.05 20 40 60 3 10 × | < 1.2 ee y 0.8 < | (8 TeV) -1 19.6 fb CMS Data ee → γ Z / τ τ → γ Z / Dibosons Jets , single t t t * θ cos 1 − −0.5 0 0.5 1 Data / MC 0.9 1 1.1
Data MC (stat) MC (stat ⊕ sys)
Events / 0.05 20 40 60 3 10 × 18.8 fb-1 (8 TeV) CMS | < 2.0 µ µ y 1.6 < | Data µ µ → γ Z / τ τ → γ Z / Dibosons Jets , single t t t * θ cos 1 − −0.5 0 0.5 1 Data / MC 0.9 1 1.1
Data MC (stat) MC (stat ⊕ sys)
Events / 0.05 10 20 30 3 10 × | < 2.0 ee y 1.6 < | (8 TeV) -1 19.6 fb CMS Data ee → γ Z / τ τ → γ Z / Dibosons Jets , single t t t * θ cos 1 − −0.5 0 0.5 1 Data / MC 0.9 1 1.1
Data MC (stat) MC (stat ⊕ sys)
Figure 3: The muon (left) and electron (right) cos θ∗ distributions in three representative bins in rapidity: |y``| < 0.4 (upper), 0.8 < |y``| < 1.2 (middle), and 1.6< |y``| < 2.0 (lower). The
9
6
Extraction of sin
2θ
`effWe extract sin2θeff` by fitting the AFB (m``, y``) distribution in data with the theoretical
pre-dictions. The default signal distributions are based on thePOWHEG v2 event generator using
the NNPDF3.0 PDFs [17]. The POWHEG generator is interfaced with PYTHIA 8 [16] and the
CUETP8M1 [31] underlying event tune to provide parton showering and hadronization, in-cluding electromagnetic FSR. The dependence on sin2θ`eff, on the renormalization and
factor-ization scales, and on the PDFs is modeled through thePOWHEGMC generator that provides matrix-element-based, event-by-event weights for each change in these parameters. The distri-butions are modified to different values of sin2θ`effby weighting each event in the full
simula-tion by the ratio of cos θ∗distributions obtained with the modified and default configurations in each(m``, y``) bin. The uncertainties in the simulation of the detector have a small effect
because AFBis extracted through the angular event-weighting technique that is insensitive to
efficiency and acceptance.
Table 1 summarizes the statistical uncertainty in the extracted sin2θ`eff in the muon and
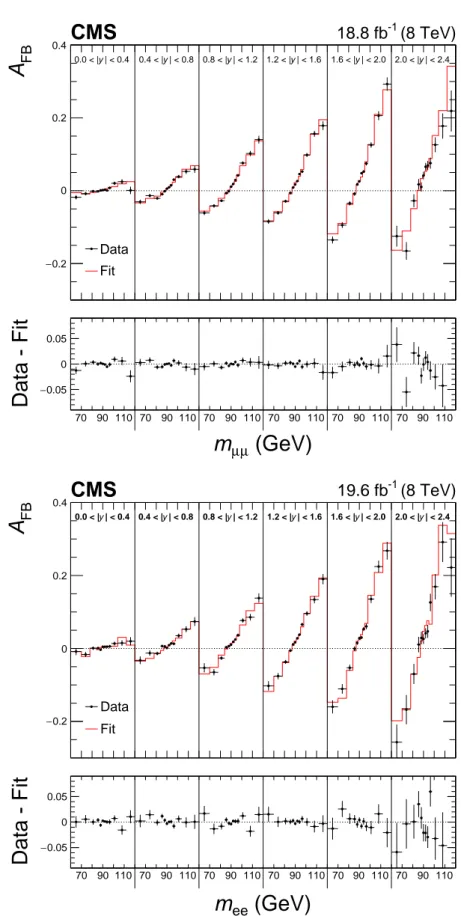
elec-tron channels and in their combination. Comparisons between the data and best-fit distribu-tions are shown in Fig. 4. The statistical uncertainties are evaluated through the bootstrapping technique [41], and take account of correlations among the measured AFB, lepton selection
effi-ciencies, and calibration coefficients introduced through the repeated use of the same dilepton events. We generate 400 pseudo-experiments that provide an accurate estimate of the statistical uncertainties and correlations. In each pseudo-experiment, every event in the data is replicated n times, where n is a random number sampled from a Poisson distribution with a mean of unity. All steps of the analysis, including extraction of muon selection efficiencies, calibration coefficients, and a measurement of AFB, are performed for each pseudo-experiment. The
statis-tical uncertainties in electron-selection efficiencies and calibration coefficients, which have no charge dependence, are small and are evaluated separately.
Table 1: Summary of statistical uncertainties in sin2θeff` . The statistical uncertainties in the
lepton-selection efficiency and in the calibration coefficients in data are included in the esti-mates.
Channel Statistical uncertainty
Muons 0.00044
Electrons 0.00060
Combined 0.00036
7
Experimental systematic uncertainties
The experimental sources of systematic uncertainty reflect the statistical uncertainties in the simulated events, corrections to lepton-selection efficiency, and to the lepton-momentum scale and resolution, background subtraction, and modeling of pileup. For electrons, the selection efficiencies, which have no dependence on charge, cancel to first order, since we are using the angular event-weighting technique.
7.1 Statistical uncertainties in MC simulated events
To reduce the statistical uncertainties associated with the limited number of events in the sig-nal MC samples, which include simulation of detector response and lepton reconstruction, the generated cos θ∗ distributions in each (m``, y``) bin within the acceptance of the detector is
(GeV) µ µ m FB
A
0.2 − 0 0.2 0.4 | < 0.4 y 0.0 < | 0.4 < |y| < 0.8 0.8 < |y| < 1.2 1.2 < |y| < 1.6 1.6 < |y| < 2.0 2.0 < |y| < 2.4 (8 TeV) -1 18.8 fbCMS
Data Fit(GeV)
µ µm
Data - Fit
−0.05 0 0.05 70 90 110 70 90 110 70 90 110 70 90 110 70 90 110 70 90 110 (GeV) ee m FBA
0.2 − 0 0.2 0.4 | < 0.4 y 0.0 < | 0.4 < |y| < 0.8 0.8 < |y| < 1.2 1.2 < |y| < 1.6 1.6 < |y| < 2.0 2.0 < |y| < 2.4 (8 TeV) -1 19.6 fbCMS
Data Fit(GeV)
eem
Data - Fit
−0.05 0 0.05 70 90 110 70 90 110 70 90 110 70 90 110 70 90 110 70 90 110Figure 4: Comparison between data and best-fit AFB distributions in the dimuon (upper) and
dielectron (lower) channels. The best-fit AFBvalue in each bin is obtained via linear
interpola-tion between two neighboring templates. Here, the templates are based on the central predic-tion of the NLO NNPDF3.0 PDFs. The error bars represent the statistical uncertainties in the data.
7.2 Lepton selection efficiencies 11
lepton reconstruction. This makes the fluctuations in the generated cos θ∗distributions negli-gible, and therefore the statistical uncertainties in the reconstructed AFBvalues become
dom-inated by fluctuations in the simulated detector response and lepton reconstruction. These uncertainties are evaluated using the bootstrapping [41] method in both dimuon and dielec-tron channels, described in Section 6, by reweighting the generated cos θ∗ distributions in each of the bootstrap samples. The total statistical uncertainties in the simulated events also include contributions from uncertainties in the measured lepton-selection efficiencies and calibration coefficients.
7.2 Lepton selection efficiencies
Several sources of uncertainty are considered in measuring of efficiencies. The statistical uncer-tainties in the lepton-selection efficiencies, evaluated through studies of pseudo-experiments, are included in the combined statistical uncertainty of the measured sin2θ`eff.
Combined scale factors for muon reconstruction, identification, and isolation efficiencies are changed by 0.5%, and trigger-selection efficiency scale factors by 0.2%, coherently for all bins for both positive and negative lepton charges. These take into account uncertainties associated with the tag-and-probe method, and are evaluated by changing signal and background models for dimuon mass distributions, levels of backgrounds, the dimuon mass range, and binning used in the fits. These uncertainties are considered fully correlated between the two charges, and therefore have a negligible impact on the measurement of sin2θeff` . In addition, we assign
the difference between the offline efficiencies obtained by fitting the dimuon mass distributions to extract the signal yields, and those found using simple counting method, as additional sys-tematic uncertainties. The total syssys-tematic uncertainty in sin2θ`eff originating from the muon
selection efficiency is±0.00005.
In a similar way as for muons, the scale factors for electron reconstruction, identification, and trigger-selection efficiencies are changed coherently within their uncertainties in all(pT, η)bins,
and the corresponding changes in the resulting sin2θ`eff are assigned as systematic
uncertain-ties. The total uncertainty in sin2θeff` originating from all electron efficiency-related systematic
sources is±0.00004.
7.3 Lepton momentum calibration
The statistical uncertainties in the parameters used to calibrate lepton momentum, described in Section 4, are included in the combined statistical uncertainty. The theoretical uncertainties, discussed in Section 8, are also propagated to the reference distributions used to extract the coefficients in the lepton momentum calibration.
When evaluating the average dimuon masses to extract the (η, φ)dependent corrections, the
dimuon mass window is restricted to 86 < mµµ < 96 GeV. This range of±5 GeV centered at
91 GeV is changed from±2.5 to±10 GeV in steps of 0.5 GeV, and the full calibration sequence is repeated each time. Similarly, a dimuon mass window of±10 (i.e., 81–101) GeV, used in the dimuon fits to obtain the resolution-correction factors, is changed from±5 to±25 GeV in steps of 1 GeV. For each of these modifications, the maximum deviation in the extracted sin2θ`eff
rel-ative to the nominal configuration is taken as a systematic uncertainty. The total experimental systematic uncertainty in sin2θeff` originating from the muon-momentum calibration, evaluated
by adding individual uncertainties in quadrature, is±0.00008. The effects due to PDF uncer-tainties in the calibration coefficients were found to be negligible. In studies of the impact of the value of sin2θ`effused to generate the reference distributions for muon-momentum calibration
the changes made in the muon-calibration parameters. Since the uncertainty in sin2θeff` is much
smaller than±0.02000, we conclude that this effect is negligible.
Similarly, the windows in the dielectron invariant mass used to extract the electron momentum-correction factors are changed to estimate the corresponding systematic uncertainty. And con-sider additional independent sources of systematic uncertainty from the modeling of pileup, background estimation, and bias in the dielecton mass-fitting procedure. The size of the EW corrections in the extracted electron energy-calibration coefficients is estimated by modifying reference dielectron mass distributions through the weight factors obtained withZGRAD[42]. All these systematic uncertainties are found to be rather small. The dominant uncertainty orig-inates from the full corrections to the electron energy resolution, which improve the agreement between data and simulated dielectron mass distributions. The total systematic uncertainty in the extracted value of sin2θeff` due to both the electron energy scale and resolution is±0.00019.
7.4 Background
The systematic uncertainties in the estimated background are evaluated as follows. The nor-malizations of the top quark and Z/γ → τ+τ− backgrounds are changed respectively by 10
and 20%, covering the maximum deviations between the data and simulation observed in the eµ control region. The uncertainty in the multijet and W+jets background is estimated by changing them by ±100%. Changing the diboson background prediction by 100% provides a negligible change in the result (<0.00001). Changing all EW and top quark backgrounds by the uncertainty in the integrated luminosity of 2.6% [43] also produces a negligible change in the result (<0.00001). The total systematic uncertainty in the measured sin2θ`eff from the
un-certainty in the background estimation is±0.00003 and±0.00005 in the dimuon and dielectron channels, respectively.
7.5 Pileup
To take into account the uncertainty originating from differences in pileup between data and simulation, we change the total inelastic cross section by ±5%, and recompute the expected pileup distribution in data. The analysis is repeated and the difference relative to the central value is taken as the systematic uncertainty. These uncertainties are respectively±0.00003 and
±0.00002 in the dimuon and dielectron channels.
All the above systematic uncertainties are summarized in Table 2.
8
Theoretical systematic uncertainties
We investigate sources of systematic uncertainty in modeling the MC templates. For each change in the model, we rederive the reference distributions described in Section 4 to adjust the lepton momentum calibration coefficients. As a baseline, the signal MC events are weighted to match the pT,``distribution in each|y``|bin in the data. The difference relative to the result
obtained without applying the weight factors, which is 0.00003 in both channels, is assigned as a systematic uncertainty associated with the modeling of pT,``.
The renormalization and factorization scales, µR and µF, are each changed independently by
a factor of 2, up and down, such that their ratio is within 0.5 < µR/µF < 2.0. The maximum
deviation among these six variants relative to the nominal choice (excluding the two opposite changes) is assigned as a systematic uncertainty associated with the missing higher-order QCD correction terms.
13
Table 2: Summary of experimental systematic uncertainties in sin2θ`eff.
Source Muons Electrons
Size of MC event sample 0.00015 0.00033 Lepton selection efficiency 0.00005 0.00004 Lepton momentum calibration 0.00008 0.00019 Background subtraction 0.00003 0.00005 Modeling of pileup 0.00003 0.00002
Total 0.00018 0.00039
In addition, we use a multi-scale improved NLO (MINLO [44]) calculation for the Z+1 jet
par-tonic final state (henceforth referred to as “Z+j”), interfaced with PYTHIA 8 for parton
show-ering, FSR, and hadronization, to assess the uncertainty from the missing higher-order QCD terms and modeling of the angular coefficients. The MINLO Z+j process has NLO accuracy for both Z+0 and Z+1 jet events, which provides a better description of the dependence of the angular coefficients on pT,``.
Systematic uncertainties in modeling electromagnetic FSR are estimated by comparing results obtained with distributions based onPYTHIA 8 and PHOTOS 2.15 [45–47] for the modeling of
FSR. Electroweak effects from the difference between the u and d quarks and leptonic effec-tive mixing angles, are estimated by changing sin2θueff and sin2θdeff by 0.0001 and 0.0002 [42],
respectively, relative to sin2θeff` . The sin2θeff` extracted using the corresponding distributions is
shifted by 0.00001.
The underlying event tune parameters [31] are changed by their uncertainties, and sin2θeff` is
extracted also using the corresponding distributions. The maximum difference from the default tune is taken as the corresponding uncertainty. The systematic uncertainties from these and all the above sources, are summarized in Table 3.
We also separately study the modeling of the A0 angular coefficient, which is included in the
definition of AFB. As a baseline, the pT,``-averaged A0 value in each measurement (m``, y``)
bin is used in the definition of the weighted AFB. Several other options are studied: (i) the
LO expression: A0 = p2T,``/(p2T,``+m2``), (ii) the pT,``-dependent A0 in each (m``, y``)bin as
predicted in the baseline NLOPOWHEGsimulation, (iii) the pT,``-dependent A0predicted in the
MINLO Z+jPOWHEGgenerator, and (iv) A0set to 0. The same definition is used for data and
simulation, and the extracted sin2θeff` is identical within±0.00002 of the default. In addition,
we weight the|cos θ∗|distribution from the MINLO Z+j MC sample to match the dependence
of A0on pT,``in each(m``, y``)bin to the corresponding values of the baseline MC simulation.
The change in the resulting sin2θeff` is also negligible.
Table 3: Summary of the theoretical uncertainties for the dimuon and dielectron channels, as discussed in the text.
Modeling parameter Muons Electrons
Dilepton pTreweighting 0.00003 0.00003
µRand µFscales 0.00011 0.00013
POWHEGMINLO Z+j vs. Z at NLO 0.00009 0.00009
FSR model (PHOTOSvs.PYTHIA8) 0.00003 0.00005
Underlying event 0.00003 0.00004
Electroweak sin2θ`effvs. sin2θu,deff 0.00001 0.00001
9
Uncertainties in the PDFs
The observed AFB values depend on the size of the dilution effect, as well as on the relative
contributions from u and d valence quarks to the total dilepton production cross section. The uncertainties in the PDFs translate into sizable changes in the observed AFBvalues. However,
changes in PDFs affect the AFB(m``, y``)distribution in a different way than changes in sin2θeff` .
Changes in PDFs produce large changes in AFB, when the absolute values of AFBare large, i.e.,
at large and small dilepton mass values. In contrast, the effect of changes in sin2θeff` are largest
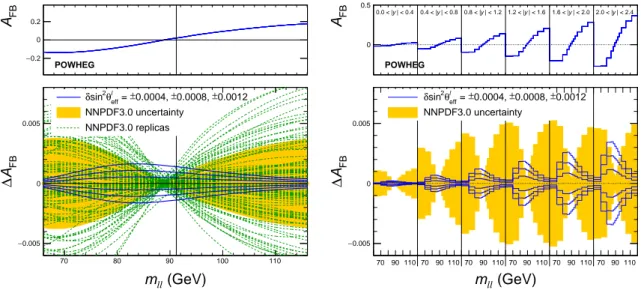
near the Z boson peak, and are significantly smaller at high and low masses. Because of this behavior, which is illustrated in Fig. 5, we apply a Bayesian χ2reweighting method to constrain the PDFs [48–50], and thereby reduce their uncertainties in the extracted value of sin2θ`eff.
FB A 0.2 − 0 0.2 POWHEG (GeV) ll m 70 80 90 100 110 FB A ∆ 0.005 − 0 0.005 0.0012 ± 0.0008, ± 0.0004, ± = l eff θ 2 sin δ NNPDF3.0 uncertainty NNPDF3.0 replicas (GeV) µ µ m FB A 0 0.5 | < 0.4 y 0.0 < | 0.4 < |y| < 0.8 0.8 < |y| < 1.2 1.2 < |y| < 1.6 1.6 < |y| < 2.0 2.0 < |y| < 2.4 POWHEG (GeV) ll m FB A ∆ 0.005 − 0 0.005 70 90 110 70 90 110 70 90 110 70 90 110 70 90 110 70 90 110 0.0012 ± 0.0008, ± 0.0004, ± = l eff θ 2 sin δ NNPDF3.0 uncertainty
Figure 5: Distribution in AFBas a function of dilepton mass, integrated over rapidity (left), and
in six rapidity bins (right) for sin2θeff` =0.23120 inPOWHEG. The solid lines in the bottom panel correspond to six changes at sin2θeff` around the central value, corresponding to: ±0.00040,
±0.00080, and±0.00120. The dashed lines refer to the AFBpredictions for 100 NNPDF3.0
repli-cas. The shaded bands illustrate the standard deviation in the NNPDF3.0 replirepli-cas.
As a baseline, we use the NLO NNPDF3.0 PDFs. In the Bayesian χ2 reweighting method,
PDF replicas that offer good descriptions of the observed AFB distribution are assigned large
weights, and those that poorly describe the AFBare given small weights. Each weight factor is
based on the best-fit χ2min,ivalue obtained by fitting the AFB(m``,y``) distribution with a given
PDF replica i: wi = e− χ2min,i 2 1 N ∑iN=1e− χ2min,i 2 , (13)
where N is the number of replicas in a set of PDFs. The final result is then calculated as a weighted average over the replicas: sin2θeff` = ∑iN=1wisi/N, where si is the best-fit sin2θeff`
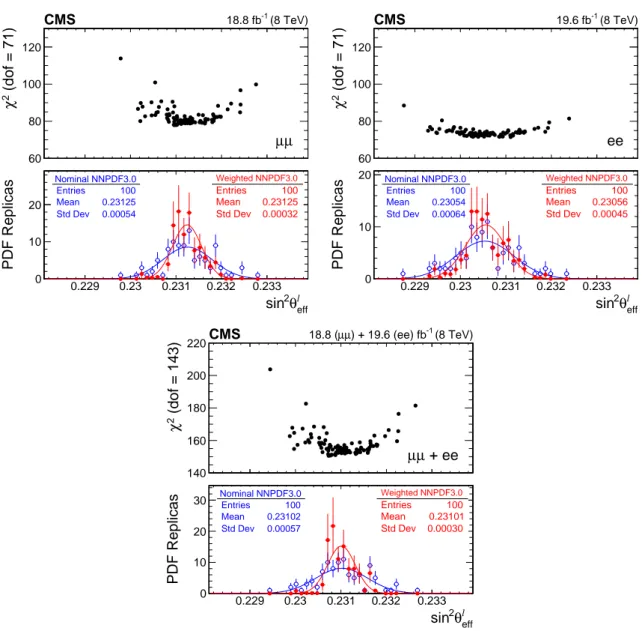
value obtained for the ithreplica. Figure 6 shows a scatter plot of the χ2
min vs. the best-fit sin2θeff` value for the 100 NNPDF3.0
replicas for the µµ and ee samples, and for the combined dimuon and dielectron results. All sources of statistical and experimental systematic uncertainties are included in a 72×72
covari-15
ance matrices for data and template AFBdistributions. The χ2(s)is defined as:
χ2(s) = (D−T(s))TV−1(D−T(s)), (14)
where D represents the measured AFBvalues for data in 72 bins, T(s)denotes the theoretical
predictions for AFB as a function of s, or sin2θeff` , and V represents the sum of the covariance
matrices for the data and templates. As illustrated in these figures, the extreme PDF repli-cas from either side are disfavored by both the dimuon and dielectron data. For each of the NNPDF3.0 replicas, the muon and electron results are combined using their respective best-fit
χ2values, sin2θeff` , and their fitted statistical and experimental systematic uncertainties.
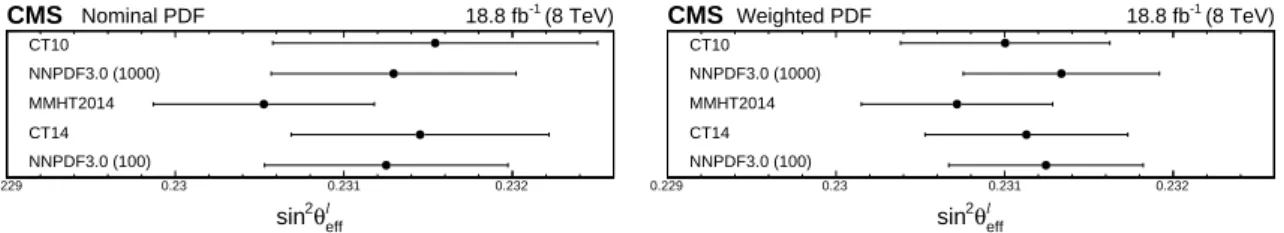
Figure 7 shows the extracted sin2θ`effin the muon and electron decay channels and their
com-bination, with and without constraining the uncertainties in the PDFs. The corresponding nu-merical values are also listed in Table 4. After Bayesian χ2reweighting, the PDF uncertainties are reduced by about a factor of 2. It should be noted that the Bayesian χ2reweighting tech-nique works well when the replicas span the optimal value on both of its sides. In addition, the effective number of replicas after χ2 reweighting, neff = N2/∑iN=1w2i, should also be large
enough to give a reasonable estimate of the average value and its standard deviation. There are 39 effective replicas after the χ2 reweighting (n
eff = 39). Including the corresponding
sta-tistical uncertainty of 0.00005, the total PDF uncertainty becomes 0.00031. As a cross-check, we perform the analysis with the corresponding set of 1000 NNPDF3.0 replicas in the dimuon channel, and find good consistency between the two results.
We have also studied the PDFs represented by Hessian eigenvectors using the CT10 [28], CT14 [51], and MMHT2014 [52] PDFs in an analysis performed in the dimuon channel. First, we generate the replica predictions (i) for each observable O for the Hessian eigensets (k):
Oi =O0+ 1 2 n
∑
k=0 (O2k+1−O2k+2)Rik, (15)where n is the number of eigenvector axes, and the Rik are random numbers sampled from
the normal distribution with a mean of 0 and a standard deviation of unity. Then, the same technique is applied as used in the NNPDF analysis. The results of fits for these PDFs are summarized in Fig. 8. After Bayesian χ2 reweighting the central predictions for all PDFs are closer to each other, and the corresponding uncertainties are significantly reduced. The result using CT14 is within about 1/3 of the PDF uncertainty of the NNPDF3.0 result in the muon channel, whereas the MMHT2014 set yields a smaller sin2θ`eff value by about one standard
deviation. Some of these differences can be reduced by adding more data (e.g. including the electron channel, which is not considered in this check). Some can be attributed to the residual differences in the valence and sea quark distributions, which are not fully constrained using the AFB distributions alone. For example, we find that the NLO NNPDF3.0 PDF set yields a
very good description for the published 8 TeV CMS muon charge asymmetry (χ2 of 4.6 for 11 dof). In contrast, the χ2 values with the CT14 and MMHT2014 PDF sets are 21.3 and 21.4, respectively. We also constructed a combined set from same number of replicas of NNPDF3.0, CT14, and MMHT2014 PDFs, and after including the data from the W charge asymmetry in the PDF reweighting, we find the combined weighted average in the dimuon channel differs from the NNPDF3.0 result by only 0.00009, and the standard deviation only increases from 0.00032 to 0.00036. Consequently, for our quoted results we use only the NNPDF3.0 PDF set, which is used in both dimuon and dielectron analyses.
As an additional test, for the case of Hessian PDFs (including the Hessian NNPDF3.0 [53]) we perform a simultaneous χ2 fit for sin2θeff` and all PDF nuisance parameters representing the
l eff θ 2 sin (dof = 71) 2χ 60 80 100 120 (8 TeV) -1 18.8 fb CMS µ µ Nominal NNPDF3.0 Entries 100 Mean 0.23125 Std Dev 0.00054 l eff θ 2 sin 0.229 0.23 0.231 0.232 0.233 PDF Replicas 0 10 20 Nominal NNPDF3.0 Entries 100 Mean 0.23125 Std Dev 0.00054 Weighted NNPDF3.0 Entries 100 Mean 0.23125 Std Dev 0.00032 Weighted NNPDF3.0 Entries 100 Mean 0.23125 Std Dev 0.00032 l eff θ 2 sin (dof = 71) 2χ 60 80 100 120 (8 TeV) -1 19.6 fb CMS ee Nominal NNPDF3.0 Entries 100 Mean 0.23054 Std Dev 0.00064 l eff θ 2 sin 0.229 0.23 0.231 0.232 0.233 PDF Replicas 0 10 20 Nominal NNPDF3.0 Entries 100 Mean 0.23054 Std Dev 0.00064 Weighted NNPDF3.0 Entries 100 Mean 0.23056 Std Dev 0.00045 Weighted NNPDF3.0 Entries 100 Mean 0.23056 Std Dev 0.00045 l eff θ 2 sin (dof = 143) 2χ 140 160 180 200 220 (8 TeV) -1 ) + 19.6 (ee) fb µ µ 18.8 ( CMS + ee µ µ Nominal NNPDF3.0 Entries 100 Mean 0.23102 Std Dev 0.00057 l eff θ 2 sin 0.229 0.23 0.231 0.232 0.233 PDF Replicas 0 10 20 30 Nominal NNPDF3.0Entries 100 Mean 0.23102 Std Dev 0.00057 Weighted NNPDF3.0 Entries 100 Mean 0.23101 Std Dev 0.00030 Weighted NNPDF3.0 Entries 100 Mean 0.23101 Std Dev 0.00030
Figure 6: The upper panel in each figure shows a scatter plot in χ2minvs. the best-fit sin2θeff` for
100 NNPDF replicas in the muon channel (upper left), electron channel (upper right), and their combination (below). The corresponding lower panels have the projected distributions in the best-fit sin2θeff` for the nominal (open circles) and weighted (solid circles) replicas.
l eff θ 2 sin 0.229 0.23 0.231 0.232 Combined Electron Muon (8 TeV) -1 ) + 19.6 (ee) fb µ µ Nominal NNPDF3.0 18.8 ( CMS l eff θ 2 sin 0.229 0.23 0.231 0.232 Combined Electron Muon (8 TeV) -1 ) + 19.6 (ee) fb µ µ Weighted NNPDF3.0 18.8 ( CMS
Figure 7: The extracted values of sin2θeff` in the muon and electron channels, and their
combi-nation. The horizontal bars include statistical, experimental, and PDF uncertainties. The PDF uncertainties are obtained both without (left) and with (right) using the Bayesian χ2weighting.
17
variations for each eigenvector. As expected for Gaussian distributions, we obtain the same central values and the total uncertainties that are extracted from Bayesian reweighting of the corresponding set of replicas.
Table 4: The central value and the PDF uncertainty in the measured sin2θeff` in the muon and
electron channels, and their combination, obtained without and with constraining PDFs using Bayesian χ2reweighting.
Channel Not constraining PDFs Constraining PDFs Muons 0.23125±0.00054 0.23125±0.00032 Electrons 0.23054±0.00064 0.23056±0.00045 Combined 0.23102±0.00057 0.23101±0.00030
Finally, as a cross-check, we also repeat the measurement using different mass windows for extracting sin2θeff` , and for constraining the PDFs. Specifically, we first use the central five bins,
corresponding to the dimuon mass range of 84< mµµ < 95 GeV, to extract sin2θ `
eff. Then, we
use predictions based on the extracted sin2θ`eff in the lower three(60 < mµµ < 84 GeV) and
the higher four (95 < mµµ < 120 GeV) dimuon mass bins, to constrain the PDFs. We find
that the statistical uncertainty increases by only about 10%, and the PDF uncertainty increases by only about 6% relative to the uncertainties obtained when using the full mass range to extract the sin2θeff` and simultaneously constrain the PDFs. The test thereby confirms that the
PDF uncertainties are constrained mainly by the high- and low-mass bins, and that we obtain consistent results with these two approaches.
l eff θ 2 sin 0.229 0.23 0.231 0.232 NNPDF3.0 (100) CT14 MMHT2014 NNPDF3.0 (1000) CT10 (8 TeV) -1 Nominal PDF 18.8 fb CMS l eff θ 2 sin 0.229 0.23 0.231 0.232 NNPDF3.0 (100) CT14 MMHT2014 NNPDF3.0 (1000) CT10 (8 TeV) -1 Weighted PDF 18.8 fb CMS
Figure 8: Extracted values of sin2θeff` from the dimuon data for different sets of PDFs with the
nominal (left) and χ2-reweighted (right) replicas. The horizontal error bars include
contribu-tions from statistical, experimental, and PDF uncertainties.
10
Summary
The effective leptonic mixing angle, sin2θeff` , has been extracted from measurements of the mass
and rapidity dependence of the forward-backward asymmetries AFB in Drell–Yan µµ and ee
production. As a baseline model, we use thePOWHEG event generator for the inclusive pp→
Z/γ → ``process at leading electroweak order, where the weak mixing angle is interpreted through the improved Born approximation as the effective angle incorporating higher-order corrections. With more data and new analysis techniques, including precise lepton-momentum calibration, angular event weighting, and additional constraints on PDFs, the statistical and systematic uncertainties are significantly reduced relative to previous CMS measurements. The combined result from the dielectron and dimuon channels is:
sin2θeff` =0.23101±0.00036 (stat)±0.00018 (syst)±0.00016 (theo)±0.00031(PDF), (16)
or summing the uncertainties in quadrature,
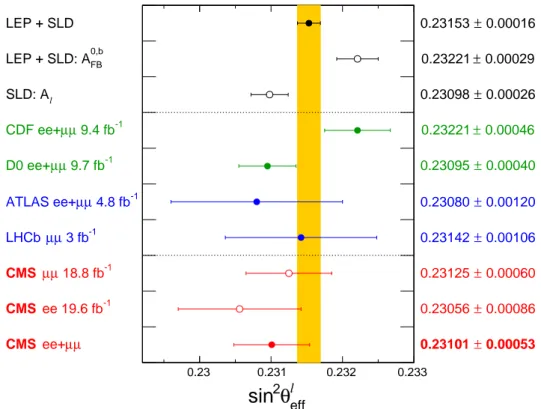
A comparison of the extracted sin2θeff` with previous results from LEP, SLC, Tevatron, and LHC,
shown in Fig. 9, indicates consistency with the mean of the most precise LEP and SLD results, as well as with the other measurements.
l eff
θ
2sin
0.23 0.231 0.232 0.233 0 1 2 3 4 5 6 7 8 9 10 LEP + SLD 0,b FB LEP + SLD: A l SLD: A -1 9.4 fb µ µ CDF ee+ -1 9.7 fb µ µ D0 ee+ -1 4.8 fb µ µ ATLAS ee+ -1 3 fb µ µ LHCb -1 18.8 fb µ µ CMS -1 ee 19.6 fb CMS µ µ ee+ CMS 0.00016 ± 0.23153 0.00029 ± 0.23221 0.00026 ± 0.23098 0.00046 ± 0.23221 0.00040 ± 0.23095 0.00120 ± 0.23080 0.00106 ± 0.23142 0.00060 ± 0.23125 0.00086 ± 0.23056 0.00053 ± 0.23101Figure 9: Comparison of the measured sin2θeff` in the muon and electron channels and their
combination, with previous LEP, SLD, Tevatron, and LHC measurements. The shaded band corresponds to the combination of the LEP and SLD measurements.
Acknowledgments
We congratulate our colleagues in the CERN accelerator departments for the excellent perfor-mance of the LHC and thank the technical and administrative staffs at CERN and at other CMS institutes for their contributions to the success of the CMS effort. In addition, we grate-fully acknowledge the computing centers and personnel of the Worldwide LHC Computing Grid for delivering so effectively the computing infrastructure essential to our analyses. Fi-nally, we acknowledge the enduring support for the construction and operation of the LHC and the CMS detector provided by the following funding agencies: BMWFW and FWF (Aus-tria); FNRS and FWO (Belgium); CNPq, CAPES, FAPERJ, and FAPESP (Brazil); MES (Bulgaria); CERN; CAS, MoST, and NSFC (China); COLCIENCIAS (Colombia); MSES and CSF (Croatia); RPF (Cyprus); SENESCYT (Ecuador); MoER, ERC IUT, and ERDF (Estonia); Academy of Fin-land, MEC, and HIP (Finland); CEA and CNRS/IN2P3 (France); BMBF, DFG, and HGF (Ger-many); GSRT (Greece); OTKA and NIH (Hungary); DAE and DST (India); IPM (Iran); SFI (Ireland); INFN (Italy); MSIP and NRF (Republic of Korea); LAS (Lithuania); MOE and UM (Malaysia); BUAP, CINVESTAV, CONACYT, LNS, SEP, and UASLP-FAI (Mexico); MBIE (New Zealand); PAEC (Pakistan); MSHE and NSC (Poland); FCT (Portugal); JINR (Dubna); MON, RosAtom, RAS, RFBR and RAEP (Russia); MESTD (Serbia); SEIDI, CPAN, PCTI and FEDER (Spain); Swiss Funding Agencies (Switzerland); MST (Taipei); ThEPCenter, IPST, STAR, and
References 19
NSTDA (Thailand); TUBITAK and TAEK (Turkey); NASU and SFFR (Ukraine); STFC (United Kingdom); DOE and NSF (USA).
Individuals have received support from the Marie-Curie program and the European Research Council and Horizon 2020 Grant, contract No. 675440 (European Union); the Leventis Foun-dation; the A. P. Sloan FounFoun-dation; the Alexander von Humboldt FounFoun-dation; the Belgian Federal Science Policy Office; the Fonds pour la Formation `a la Recherche dans l’Industrie et dans l’Agriculture (FRIA-Belgium); the Agentschap voor Innovatie door Wetenschap en Technologie (IWT-Belgium); the F.R.S.-FNRS and FWO (Belgium) under the ”Excellence of Sci-ence - EOS” - be.h project n. 30820817; the Ministry of Education, Youth and Sports (MEYS) of the Czech Republic; the Council of Science and Industrial Research, India; the HOMING PLUS program of the Foundation for Polish Science, cofinanced from European Union, Re-gional Development Fund, the Mobility Plus program of the Ministry of Science and Higher Education, the National Science Center (Poland), contracts Harmonia 2014/14/M/ST2/00428, Opus 2014/13/B/ST2/02543, 2014/15/B/ST2/03998, and 2015/19/B/ST2/02861, Sonata-bis 2012/07/E/ST2/01406; the National Priorities Research Program by Qatar National Research Fund; the Programa Severo Ochoa del Principado de Asturias; the Thalis and Aristeia programs cofinanced by EU-ESF and the Greek NSRF; the Rachadapisek Sompot Fund for Postdoctoral Fellowship, Chulalongkorn University and the Chulalongkorn Academic into Its 2nd Century Project Advancement Project (Thailand); the Welch Foundation, contract C-1845; and the We-ston Havens Foundation (USA).
References
[1] J. C. Collins and D. E. Soper, “Angular distribution of dileptons in high-energy hadron collisions”, Phys. Rev. D 16 (1977) 2219, doi:10.1103/PhysRevD.16.2219.
[2] D. Y. Bardin, W. F. L. Hollik, and G. Passarino, “Reports of the working group on precision calculations for the z resonance”, technical report, CERN, 1995.
doi:10.5170/CERN-1995-003.
[3] D. Yu. Bardin et al., “ZFITTER v.6.21: A semianalytical program for fermion pair production in e+e−annihilation”, Comput. Phys. Commun. 133 (2001) 229, doi:10.1016/S0010-4655(00)00152-1, arXiv:hep-ph/9908433.
[4] The ALEPH Collaboration, the DELPHI Collaboration, the L3 Collaboration, the OPAL Collaboration, the SLD Collaboration, the LEP Electroweak Working Group, the SLD Electroweak and Heavy Flavour Groups, “Precision electroweak measurements on the Z resonance”, Phys. Rept. 427 (2006) 257, doi:10.1016/j.physrep.2005.12.006, arXiv:hep-ex/0509008.
[5] D0 Collaboration, “Measurement of the forward-backward charge asymmetry and extraction of sin2θWeffin p ¯p→Z/γ∗+X→e+e−+X events produced at
√
s =1.96 TeV”, Phys. Rev. Lett. 101 (2008) 191801, doi:10.1103/PhysRevLett.101.191801,
arXiv:0804.3220.
[6] D0 Collaboration, “Measurement of sin2θ`effand Z-light quark couplings using the
forward-backward charge asymmetry in p ¯p →Z/γ∗ →e+e−events withL =5.0 fb−1at
√
s =1.96 TeV”, Phys. Rev. D 84 (2011) 012007, doi:10.1103/PhysRevD.84.012007, arXiv:1104.4590.
[7] CMS Collaboration, “Measurement of the weak mixing angle with the Drell-Yan process in proton-proton collisions at the LHC”, Phys. Rev. D 84 (2011) 112002,
doi:10.1103/PhysRevD.84.112002, arXiv:1110.2682.
[8] CDF Collaboration, “Indirect measurement of sin2θW (MW)using e+e−pairs in the
Z-boson region with p ¯p collisions at a center-of-momentum energy of 1.96 TeV”, Phys. Rev. D 88 (2013) 072002, doi:10.1103/PhysRevD.88.072002, arXiv:1307.0770. [9] CDF Collaboration, “Indirect measurement of sin2θW (or MW) using µ+µ−pairs from
γ∗/Z bosons produced in p ¯p collisions at a center-of-momentum energy of 1.96 TeV”,
Phys. Rev. D 89 (2014) 072005, doi:10.1103/PhysRevD.89.072005, arXiv:1402.2239.
[10] D0 Collaboration, “Measurement of the effective weak mixing angle in p¯p→Z/γ∗→e+e−events”, Phys. Rev. Lett. 115 (2015) 041801,
doi:10.1103/PhysRevLett.115.041801, arXiv:1408.5016.
[11] ATLAS Collaboration, “Measurement of the forward-backward asymmetry of electron and muon pair-production in pp collisions at√s = 7 TeV with the ATLAS detector”, JHEP 09 (2015) 049, doi:10.1007/JHEP09(2015)049, arXiv:1503.03709. [12] LHCb Collaboration, “Measurement of the forward-backward asymmetry in
Z/γ∗ →µ+µ−decays and determination of the effective weak mixing angle”, JHEP 11
(2015) 190, doi:10.1007/JHEP11(2015)190, arXiv:1509.07645.
[13] CDF Collaboration, “Measurement of sin2θeffleptusing e+e−pairs from γ∗/Z bosons
produced in p ¯p collisions at a center-of-momentum energy of 1.96 TeV”, Phys. Rev. D 93 (2016) 112016, doi:10.1103/PhysRevD.93.112016, arXiv:1605.02719.
[14] D0 Collaboration, “Measurement of the effective weak mixing angle in p¯p→Z/γ∗→ `+`−events”, Phys. Rev. Lett. 120 (2018) 241802,
doi:10.1103/PhysRevLett.120.241802, arXiv:1710.03951.
[15] CDF and D0 Collaborations, “Tevatron Run II combination of the effective leptonic electroweak mixing angle”, (2018). arXiv:1801.06283. Submitted to Phys. Rev. D. [16] T. Sj ¨ostrand et al., “An Introduction to PYTHIA 8.2”, Comput. Phys. Commun. 191 (2015)
159, doi:10.1016/j.cpc.2015.01.024, arXiv:1410.3012.
[17] NNPDF Collaboration, “Parton distributions for the LHC Run II”, JHEP 04 (2015) 040, doi:10.1007/JHEP04(2015)040, arXiv:1410.8849.
[18] CMS Collaboration, “The CMS experiment at the CERN LHC”, JINST 3 (2008) S08004, doi:10.1088/1748-0221/3/08/S08004.
[19] CMS Collaboration, “Performance of CMS muon reconstruction in pp collision events at√ s =7 TeV”, JINST 7 (2012) P10002, doi:10.1088/1748-0221/7/10/P10002, arXiv:1206.4071.
[20] CMS Collaboration, “Performance of electron reconstruction and selection with the CMS detector in proton-proton collisions at√s=8 TeV”, JINST 10 (2015) P06005,
doi:10.1088/1748-0221/10/06/P06005, arXiv:1502.02701. [21] CMS Collaboration, “The CMS trigger system”, JINST 12 (2017) P01020,
References 21
[22] CMS Collaboration, “Particle-flow reconstruction and global event description with the CMS detector”, JINST 12 (2017) P10003, doi:10.1088/1748-0221/12/10/P10003, arXiv:1706.04965.
[23] D. Bourilkov, “Photon-induced background for dilepton searches and measurements in pp collisions at 13 TeV”, (2016). arXiv:1606.00523.
[24] S. Alioli, P. Nason, C. Oleari, and E. Re, “NLO vector-boson production matched with shower in POWHEG”, JHEP 07 (2008) 060,
doi:10.1088/1126-6708/2008/07/060, arXiv:0805.4802.
[25] P. Nason, “A new method for combining NLO QCD with shower Monte Carlo algorithms”, JHEP 11 (2004) 040, doi:10.1088/1126-6708/2004/11/040, arXiv:hep-ph/0409146.
[26] S. Frixione, P. Nason, and C. Oleari, “Matching NLO QCD computations with parton shower simulations: the POWHEG method”, JHEP 11 (2007) 070,
doi:10.1088/1126-6708/2007/11/070, arXiv:0709.2092.
[27] S. Alioli, P. Nason, C. Oleari, and E. Re, “A general framework for implementing NLO calculations in shower Monte Carlo programs: the POWHEG BOX”, JHEP 06 (2010) 043, doi:10.1007/JHEP06(2010)043, arXiv:1002.2581.
[28] H.-L. Lai et al., “New parton distributions for collider physics”, Phys. Rev. D 82 (2010) 074024, doi:10.1103/PhysRevD.82.074024, arXiv:1007.2241.
[29] T. Sj ¨ostrand, S. Mrenna, and P. Skands, “PYTHIA 6.4 physics and manual”, JHEP 05 (2006) 026, doi:10.1088/1126-6708/2006/05/026, arXiv:hep-ph/0603175. [30] CMS Collaboration, “Study of the underlying event at forward rapidity in pp collisions
at√s = 0.9, 2.76, and 7 TeV”, JHEP 04 (2013) 072, doi:10.1007/JHEP04(2013)072, arXiv:1302.2394.
[31] CMS Collaboration, “Event generator tunes obtained from underlying event and multiparton scattering measurements”, Eur. Phys. J. C 76 (2016) 155,
doi:10.1140/epjc/s10052-016-3988-x, arXiv:1512.00815. [32] N. Davidson et al., “Universal interface of TAUOLA: Technical and physics
documentation”, Comput. Phys. Commun. 183 (2012) 821, doi:10.1016/j.cpc.2011.12.009, arXiv:1002.0543.
[33] J. Pumplin et al., “New generation of parton distributions with uncertainties from global QCD analysis”, JHEP 07 (2002) 012, doi:10.1088/1126-6708/2002/07/012, arXiv:hep-ph/0201195.
[34] GEANT4 Collaboration, “GEANT4 — a simulation toolkit”, Nucl. Instrum. Meth. A 506 (2003) 250, doi:10.1016/S0168-9002(03)01368-8.
[35] CMS Collaboration, “Measurement of the differential cross section and charge
asymmetry for inclusive pp→W±+X production at√s=8 TeV”, Eur. Phys. J. C 76 (2016) 469, doi:10.1140/epjc/s10052-016-4293-4, arXiv:1603.01803. [36] A. Bodek et al., “Extracting muon momentum scale corrections for hadron collider
experiments”, Eur. Phys. J. C 72 (2012) 2194,
[37] Y. Li and F. Petriello, “Combining QCD and electroweak corrections to dilepton production in the framework of the FEWZ simulation code”, Phys. Rev. D 86 (2012) 094034, doi:10.1103/PhysRevD.86.094034, arXiv:1208.5967.
[38] M. Czakon and A. Mitov, “Top++: a program for the calculation of the top-pair cross-section at hadron colliders”, Comput. Phys. Commun. 185 (2014) 2930, doi:10.1016/j.cpc.2014.06.021, arXiv:1112.5675.
[39] E. Mirkes and J. Ohnemus, “W and Z polarization effects in hadronic collisions”, Phys. Rev. D 50 (1994) 5692, doi:10.1103/PhysRevD.50.5692, arXiv:hep-ph/9406381. [40] A. Bodek, “A simple event weighting technique for optimizing the measurement of the
forward-backward asymmetry of Drell-Yan dilepton pairs at hadron colliders”, Eur. Phys. J. C 67 (2010) 321, doi:10.1140/epjc/s10052-010-1287-5, arXiv:0911.2850. [41] B. Efron, “Bootstrap methods: Another look at the jackknife”, Ann. Statist. 7 (1979) 1,
doi:10.1214/aos/1176344552.
[42] U. Baur et al., “Electroweak radiative corrections to neutral current Drell-Yan processes at hadron colliders”, Phys. Rev. D 65 (2002) 033007,
doi:10.1103/PhysRevD.65.033007, arXiv:hep-ph/0108274.
[43] CMS Collaboration, “CMS luminosity based on pixel cluster counting — Summer 2013 update”, Technical Report CMS-PAS-LUM-13-001, 2013.
[44] K. Hamilton, P. Nason, and G. Zanderighi, “MINLO: multi-scale improved NLO”, JHEP
10(2012) 155, doi:10.1007/JHEP10(2012)155, arXiv:1206.3572.
[45] P. Golonka and Z. Was, “PHOTOS Monte Carlo: A precision tool for QED corrections in Z and W decays”, Eur. Phys. J. C 45 (2006) 97, doi:10.1140/epjc/s2005-02396-4, arXiv:hep-ph/0506026.
[46] E. Barberio and Z. Wa¸s, “PHOTOS: A universal Monte Carlo for QED radiative corrections. Version 2.0”, Comput. Phys. Commun. 79 (1994) 291,
doi:10.1016/0010-4655(94)90074-4.
[47] N. Davidson, T. Przedzinski, and Z. Was, “PHOTOS interface in C++: Technical and Physics Documentation”, Comput. Phys. Commun. 199 (2016) 86,
doi:10.1016/j.cpc.2015.09.013, arXiv:1011.0937.
[48] W. T. Giele and S. Keller, “Implications of hadron collider observables on parton distribution function uncertainties”, Phys. Rev. D 58 (1998) 094023,
doi:10.1103/PhysRevD.58.094023, arXiv:hep-ph/9803393.
[49] N. Sato, J. F. Owens, and H. Prosper, “Bayesian reweighting for global fits”, Phys. Rev. D
89(2014) 114020, doi:10.1103/PhysRevD.89.114020, arXiv:1310.1089. [50] A. Bodek, J. Han, A. Khukhunaishvili, and W. Sakumoto, “Using Drell-Yan
forward-backward asymmetry to reduce PDF uncertainties in the measurement of electroweak parameters”, Eur. Phys. J. C 76 (2016) 115,
doi:10.1140/epjc/s10052-016-3958-3, arXiv:1507.02470.
[51] S. Dulat et al., “New parton distribution functions from a global analysis of quantum chromodynamics”, Phys. Rev. D 93 (2016) 033006,
References 23
[52] L. A. Harland-Lang, A. D. Martin, P. Motylinski, and R. S. Thorne, “Parton distributions in the LHC era: MMHT 2014 PDFs”, Eur. Phys. J. C 75 (2015) 204,
doi:10.1140/epjc/s10052-015-3397-6, arXiv:1412.3989.
[53] S. Carrazza et al., “An unbiased Hessian representation for Monte Carlo PDFs”, Eur. Phys. J. C 75 (2015) 369, doi:10.1140/epjc/s10052-015-3590-7,
![Figure 1: The dependence of A FB on m `` in dimuon events generated using PYTHIA 8.212 [16] and the LO NNPDF3.0 [17] PDFs for dimuon rapidities of | y `` | < 2.4](https://thumb-eu.123doks.com/thumbv2/9libnet/4584379.84453/4.892.127.777.671.863/figure-dependence-dimuon-events-generated-pythia-nnpdf-rapidities.webp)