Pamukkale UnivMuh BilimDerg, 24(1), 69-75, 2018
Pamukkale Üniversitesi Mühendislik Bilimleri Dergisi
Pamukkale University Journal of Engineering Sciences
69
Experimental investigation of machining accuracy in electrical discharge
drilling
Elektro erozyon ile delik delmede işleme tamlığının deneysel incelenmesi
Yakup YILDIZ1*
1Makine Mühendisliği Bölümü, Teknoloji Fakültesi, Dumlupınar Üniversitesi, Kütahya, Türkiye.
yakup.yildiz@live.com
Received/Geliş Tarihi: 26.01.2017, Accepted/Kabul Tarihi: 21.05.2017
* Corresponding author/Yazışılan Yazar Research Article/doi: 10.5505/pajes.2017.13471 Araştırma Makalesi
Abstract Öz
Machining accuracy is one of the most important criteria of electro discharge drilling (EDD) processes and this phenomenon is serious due to excessive electrode wears. In this study, the workpieces were machined with regard to EDD parameters to obtain blind holes. The machining accuracy was analyzed experimentally based on machining depth and shape of the holes. Experimental results were assessed by statistical methods such as analysis of variance and regression analysis. In addition, grey relation analysis was used to determine optimal machining condition and to improve the machining accuracy. It has been observed that working current is the determinative parameter. The lower working current and the higher pulse time are suggested to obtain the more accurate shape of the drilled holes in EDD of materials.
İşleme tamlığı, elektro erozyon ile delik delme işlemlerinin en önemli ölçütlerden birisidir ve bu olay aşırı elektrot aşınmalarından dolayı çok önemlidir. Bu çalışmada iş parçaları, kör delikler elde edebilmek için elektro erozyon parametrelerine bağlı olarak işlenmiştir. İşleme tamlığı deneysel olarak işleme derinliği ve deliklerin şekillerine bağlı analiz edilmiştir. Deneysel sonuçlar varyans analizi ve regresyon analizi gibi istatistiksel metotlar ile değerlendirilmiştir. Ek olarak, işleme tamlığını geliştirmek ve en uygun işleme şartlarını belirlemek için grey ilişki analizi kullanılmıştır. Çalışma akımının belirleyici parametre olduğu gözlemlenmiştir. Malzemelerin elektro erozyon ile delme işlemlerinde daha doğru delik şekli elde edebilmek için daha düşük çalışma akımı ve daha yüksek vurum süresi tavsiye edilmiştir.
Keywords: Machining accuracy, Electrical discharge drilling,
Grey relation analysis Anahtar kelimeler: İşleme tamlığı, Elektro erozyon ile delik delme, Grey ilişki analizi
1 Introduction
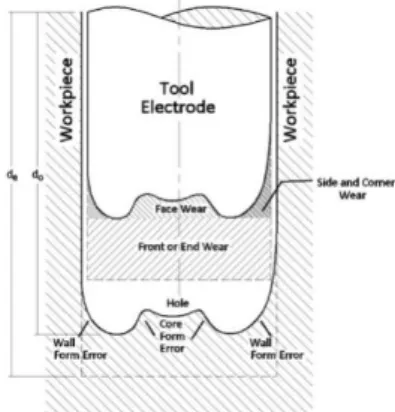
Electro discharge drilling (EDD) is a kind of die sinking electro discharge machining (EDM) process. However, EDD machines are operated just for drilling purposes and the aim of these machines is to drill holes faster particularly in fabrication of special parts for industry. EDM/EDD is a non-conventional machining process and works based on thermo-electrical interaction between electrode tool and workpiece. Higher temperatures from 8.000°C to 12.000°C [1] are generated by periodic occurrence of electrical sparks. These temperatures melt small pieces of electrode material as well as workpiece material [2]. This phenomenon causes wear of electrodes and thus distortion on shape of machined surfaces of the workpieces. In other words, tool wear in EDM processes causes geometrical inaccuracy or form errors on the machined surfaces. It is stated that the electrode tools are worn just in beginning of EDM process and shape of these electrodes are deteriorated mainly around their terminal surfaces because of the irregular wears [3]. Figure 1 represents an example for observable wear types on a worn tool electrode and their effects on a deep of hole.
Wear types on an EDM electrode can be classified mainly into three groups as side/corner wear, face wear and front/end wear. The electric field becomes more intensive on outside edges of the electrodes due to their finite dimensions by working voltage. This excessive electric field intensity at end of the electrodes initially causes wears of corner and side regions on outside of the electrodes during discharge process. This situation is resulted in excessive wear at corner of the electrodes. As a result, corner of the electrodes is transferred
to an equipotential surface depending on EDM conditions as reported previously [3]. One of the examples of that outcome was shown in Figure 2, [4].
Figure 1: Tool wear types and their effects on form errors in EDD process.
Pamukkale UnivMuh BilimDerg, 24(1), 69-75, 2018 Y. Yıldız
70 Therefore, wears on corner of the electrodes cause form
errors in machined region as shown in Figure 1. Tubular electrodes provide a considerable advantage in EDD processes. Internal dielectric fluid flow from these types of electrodes facilitates removing of debris from deep of holes. On the other hand, face wear can be observed on tubular electrodes with single or multi channels [4]. It is assumed that current density moves from edges of the electrodes to center of the electrodes by corner wear of the tools, and this causes face wear on electrodes. This type of wear also causes form errors in machined region as shown in Figure 1. Consequently, while front or end wears affect the necessary machining depth, face and corner wears mainly lead to form errors around the hole bottoms in EDD process. Additionally, while the face wear causes form errors around core region of deep of the holes, corner wear causes form errors around wall region of deep of the holes.
There are numerous studies addressing importance of measurement and determination of the electrode wears and their effects on EDM process. Tsai and Masuzawa [5] estimated curvature of the corner wear portion by Weierstrass’ polynomial approximation theorem for micro-EDM process. For this purpose, they benefited from radius of the electrode by measuring it on an optical microscope. Thus, they determined volumetric wear ratio on corner portion of the electrode. Ozgedik and Cogun [6] investigated variations of the geometrical tool wear characteristics in relation to electro discharge machining parameters. Pham et al. [7] investigated tube and rod electrode shape alterations based on a volumetric wear compensation method for accuracy of micro EDM process. Jeong and Min [8] developed simulation based model to predict geometry of tool electrode shapes and drilled holes by micro-EDM and used that model in offline compensation of tool wear in fabrication of the blind holes. Opoz et al. [9] investigated shape and dimensional geometry of blind micro holes machined by micro-EDM. Yan et al. [10] measured corner wear of tool directly by the machine vision system using image-processing software utilities to present an electrode wear compensation method. They determined corner wear as the ratio defined as a ratio between length of corner wear and electrode diameter. Yan and Lin [11] also used that system for three-dimensional (3D) micro-EDM milling to compensate electrode wear. Nguyen et al. [12] studied on profile error compensation in 3D micro-EDM milling by implementing radius of corner wear into an electrode compensation model. Consequently, it can be seen that the machining accuracy is crucial for EDM processes. In this study, machining accuracy was investigated based on EDD parameters, working current and pulse time in machining of a copper alloy. For this purpose, tubular electrodes were used to obtain blind holes. Machining accuracy was examined based on machining depth and shape of the holes.
Experimental results were evaluated by analysis of variance (ANOVA) and regression analysis. An optimization study was also performed by grey relation analysis to determine optimal machining condition regarding to machining accuracy.
2 Materials and method
Experiments were performed by using an electro discharge drilling machine (ZNC/50A). Workpiece materials were Moldmax Be-Cu alloy (26x26x13 mm) and tools were two channel (web type) copper (C-122) electrodes (Ø3x300 mm). Commonwealth EDM-244 oil was used as the dielectric medium. Some properties of these materials [4] were given in Table 1.
Four working currents (10 A, 15 A, 20 A and 25 A) up to maximum peak current and four pulse on/off times (20 µsec, 40 µsec, 60 µsec and 80 µsec) with constant duty factor of 0.5 were chosen for the machining tests. The other parameters, working voltage (150 V), capacitance (3 µF), spindle speed (187 rpm), gap voltage (20 V) and speed of servo feed (50 mm/min) were hold as constant. All these parameters were regulated on control unit of the machine. Flushing was supplied by forced flow of the dielectric liquid from two holes of the electrode tools. Drilling depth was settled as 20 mm to get a blind hole. These experiments were performed by full randomized factorial design with one replication. Some references [4],[13] have served as a basis for determining the experimental parameters that were used in this research.
2.1 Determination of machining accuracy
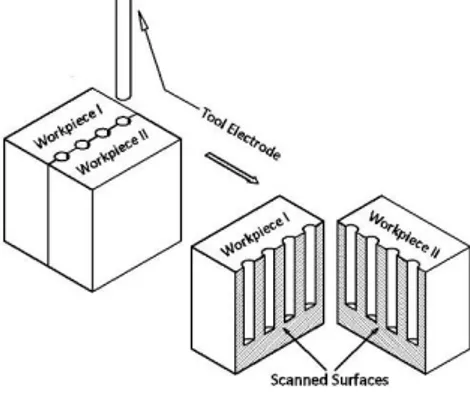
Machining accuracy was evaluated depending on machining depth and shape of the holes as stated above. A different machining approach was applied to determine hole shapes in this study. Hole shapes were investigated according to form errors caused by tool wears as shown in Figure 1. For the EDD process, two workpieces were clamped together and center of the tool was positioned on intersection of these workpieces as shown in Figure 3.
Figure 3: EDD machining method. Table 1: Chemical composition (by weight %) and some properties of the materials.
C-122 Copper Electrodes
Copper (Cu) Phosphorus (P) - - -
99.90 0.015-0.04 - - -
Density (kg/m3) Tensile Strength (MPa) Yield Strength (MPa)
8940.609 220.632 68.947
Be-Cu Alloys
Be Co+Ni Co+Ni+Fe Pb Cu
1.8 0.2 0.6 0.4 97
Dens. (kg/m3) Elastic Mod. (N/mm2) Thermal Conductivity (W/m.°F)
8350 1.31E+05 5.35
Pamukkale UnivMuh BilimDerg, 24(1), 69-75, 2018 Y. Yıldız
71 While the exact semi profile of the rotating tool machines the
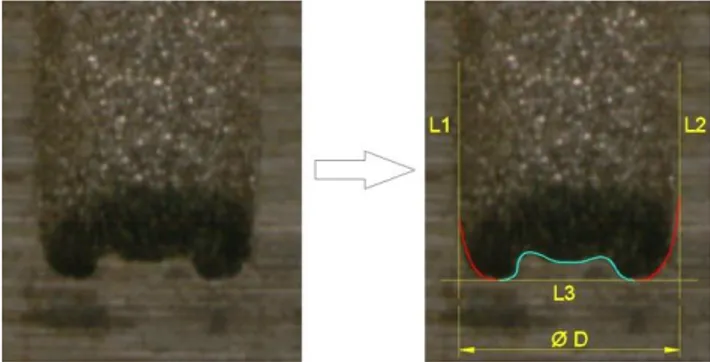
workpiece I, the other exact semi profile of the rotating tool machines the workpiece II simultaneously and symmetrically. Moreover, the machined hole geometry to be examined was obtained easily by this way without additional machining operation (i.e. wire EDM from center of the hole). So, the machined holes were exactly sliced into two pieces. As a consequence, total of sixty-four measurements were completed for modeling of the hole profiles to reduce error. Measurements were made on both pieces of the workpiece. In other words, both sides of the holes were taken into consideration due to assumption of symmetrical effect of tool corner wears for the measurement of wall form errors. After machining experiments, workpieces were cleaned in acetone by employing an ultrasonic cleaner for twenty minutes. Then, those workpieces were placed on a scanner (HP L2698A Scanjet) from their machined surfaces and they were scanned with high resolution (4800 dpi). The pictures of the machined surfaces were converted to JPEG format and they were transferred into the software. Dimensions of the obtained holes are bigger than diameter of tool electrodes depending on gap distance between tool and workpiece. The machined regions in EDM process geometrically take shape of the tool which is one of the most important characteristic of the EDM process. In other words, the machined shape of the workpiece is the copied shape of the electrode. Therefore, the approximated borders of the machined holes are determined by drawing of extended orthogonal and tangential lines (L1, L2 and L3) which are thinner as shown in Figure 4 to regulate hole diameters from bottom and walls.
Figure 4: Determination of the hole profiles.
L1 is parallel to L2 and both L1 and L2 are perpendicular to L3. Average hole diameters were determined by using a small hole gauge and a Mitutoyo micrometer with readability of 0.001mm. All the pictures were scaled to the average hole diameter which is 3.125 mm for this study. This process has provided accurate hole shapes in determining of hole borders. The regions which reflect the form errors due to corner/side wear and face wear around bottom of the holes are fitted by smooth curves. These curves are created by a sequence of points within a specified tolerance by thicker and colored lines as shown in Figure 4. For the last step of this stage, hole profiles are transferred to the different location and an orthogonal coordinate system is established to specify 2D position of the spatial nodes as shown in Figure 5.
Thereby, a reliable data is collected. Additionally, the depth ratio is determined as the ratio of obtained depth (𝑑𝑜) to given
or expected depth (𝑑𝑒). Figure 1 demonstrates these terms
clearly.
Figure 5: 2D spatial points of a sample wall form error and its digitized status.
3 Results
3.1 Machining accuracy based on volumetric form errors
In this study, variations of the form errors depending on EDD parameters were investigated from wall and core regions of the hole bottoms separately as described in Figure 2. Lengths of the hole profiles have been composed of 𝑛 sub-lengths (𝑥𝑖→ 𝑥𝑖+1𝑥𝑛−1→ 𝑥𝑛) indexed by 𝑖 as shown in Figure 6.
Therefore, approximated total value of the volumetric errors can be calculated by the following simple integration equation (Equation 1),
2
2 1 0 n e i i i iV
y
r
x
r
x
(1)Where 𝑟 is the radius of the hole and n is the total number of the integers ascending up to the value where 𝑥𝑖+1= 𝑟 = 𝑥𝑛.
Figure 6: A sample of sub-divided state of an hole profile. Table 2 shows fixed effects of multivariate ANOVA results for volumetric errors formed around deep of the holes. For the responses, wall and core errors, obtained 𝑃 values (0.03 and 0.000) addressing the importance of working current factor are lower than the significance level of 0.05. This result expresses that the working current is an important EDD parameter in drilling of Be-Cu alloys in terms of shape accuracy of the holes. On the other hand, obtained 𝑃 value
Pamukkale UnivMuh BilimDerg, 24(1), 69-75, 2018 Y. Yıldız
72 (0.616) addressing the importance of pulse time is higher than
significance level of 0.05. This result means that pulse time is insignificant and negligible EDD parameter on wall errors around hole bottoms. On the contrary, pulse time seems as significant parameter on formation of core errors due to lower 𝑃 value (0.033).
Table 2: ANOVA results for volumetric errors
Source Dep. Var. DF SS MS F P
W. Current
(A) WFE CFE 3 3 1.40 1.06 0.46 0.35 10.30 69.97 0.003 0.000 Pulse On/Off
Time (µsec) WFE CFE 3 3 0.08 0.06 0.02 0.02 0.627 4.550 0.616 0.033 Error WFE CFE 9 9 0.40 0.04 0.04 0.00
Total WFE CFE 15 15 1.89 1.18
R2 WFE (Wall Form Error) 78.46%
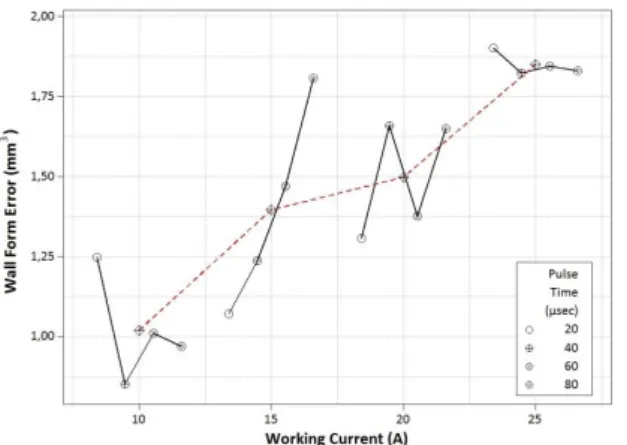
CFE (Core Form Error) 96.13% ANOVA results expressed in Table 2 are also presented in multivariate graph forms as shown in Figure 7 and Figure 8. These charts point out data means at each level of working current factor, which is the most dominant factor in EDM processes, for every pulse time factors. Linearity and inclination of the effect of working current factor (dashed lines in the graphs) can be seen clearly by this way. Moreover, results of ANOVA have been verified visually.
Figure 7: Variation of wall form errors around deep of the holes depending on EDD parameters.
Figure 8: Variation of core form errors around deep of the holes depending on EDD parameters.
It can be inferred from the graph that while the effect of pulse time on wall error is normally unstable, the effect of working current is very clear. These errors around the hole bottoms
are increasing by increase of working current and this increase is almost 83.17% from 10 A to 25 A. Therefore, lower working currents are suggested in EDD of Be-Cu alloys to reduce wall errors in the holes. On the contrary, core errors in the holes decrease by increasing of working current as shown in Figure 7. This reduction of 58.72% is important from 10 A to 25 A. It is assumed that insufficient flashing from tubular electrodes and undesirable debris concentration on deep of the holes lead to wear of the electrodes from center and naturally this phenomenon causes core errors in blind holes due to long machining times by lower working currents. However, it is perceptible from the graphs and mean values that wall errors are larger than core errors in EDD of Be-Cu alloys. While the mean value of volumetric wall error depending on EDD parameters is around 1.44 mm3, the mean
value of volumetric core error is around 0.67 mm3. This result
also refers that corner and side wears are more serious than face wear of electrode tools. Therefore, lower working currents are recommended in EDD of Be-Cu alloys in terms of machining accuracy of blind holes.
3.2 Machining accuracy based on depth ratio
Generally, in EDD processes, obtained depth is different from expected or given depth due to wear of electrodes. Therefore, the obtained depth, close to expected depth, is important in terms of machining accuracy. For this purpose, depth ratios were determined to investigate effects of EDD parameters on depth. Depth ratios can be obtained by Equation 2.
*
o r ed
D
100
d
(2)Where, 𝐷𝑟 is depth ratio, 𝑑𝑜 is obtained depth and 𝑑𝑒 is
expected depth which is 20 mm in this study. Table 3 shows ANOVA results of these data.
Table 3: ANOVA results for depth ratios.
Source DF SS MS F P W. Current (A) 3 103.40 34.46 164.527 0.000 Pulse On/Off Time (µsec) 3 5.661 1.887 9.007 0.004 Error 9 1.886 0.210 Total 15 110.95 15 R2 98.3%
Lower 𝑃 values than the significant level indicate that both working current and pulse time factors are important for depth of EDD process. Figure 9 shows the variations of depth ratios based on EDD parameters.
Figure 9: Variation of depth ratios depending on EDD parameters.
Pamukkale UnivMuh BilimDerg, 24(1), 69-75, 2018 Y. Yıldız
73 It can be seen that depth ratio is increasing by decrease of
working current and this increase is around 8.96% from 25 A to 10 A. Depth ratio is also increasing by increase of pulse time and this increase is around 2.23% from 20 µsec to 80 µsec. However, these increases are more apparent at lower working currents. On the other hand, trends of the variations are unstable at higher working currents. Therefore, it can be concluded from these results that lower working currents and higher pulse times are suggested to obtain deeper holes close to expected depth. In addition, a regression analysis was also performed to determine obtained depth based on EDD parameters. Depth ratio versus working current and pulse time can also be fitted linearly based on multiple regression analysis with least squares estimation method by Equation 3.
2
r w p
D = 82.1- 0.45I +0.0238t
R = 95.2%
(3)Where, 𝐼𝑤 is the working current and 𝑡𝑝 is the pulse time. This
equation confirms ANOVA results that working current is the dominant parameter by its larger coefficient (0.45) and depth ratio will decrease by increasing of working current by its negative sign. The equation also confirms that depth ratio will increase by increasing of pulse time due to its positive sign. The obtained depth can be predicted by the following form (Equation 4) from Equation 1 and Equation 2.
e w p 0d 82.1 - 0.450I +0.0238t
d =
100
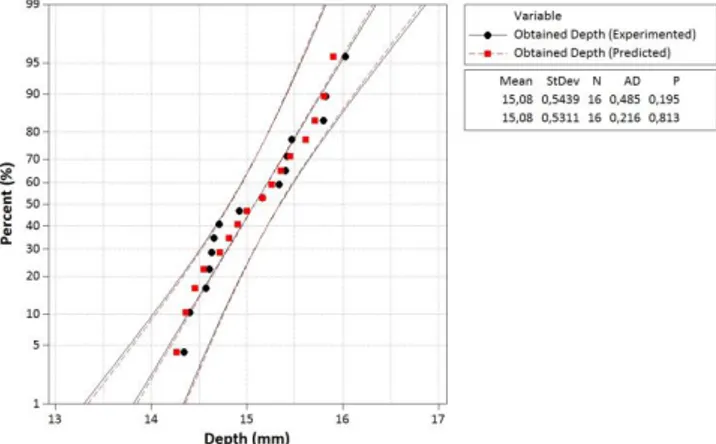
(4) Figure 10 shows normal probability of predicted depths by Equation 4 and experimented depths. Means and standard deviations of experimented and predicted data prove that fitting process is well enough. In addition, plotted points of experimented and predicted data constitute reasonably straight line by following each other and the fitted distribution line fairly close. All these results will also indicate that residuals are normally distributed.Figure 10: Normal probability plot of experimented and predicted data.
3.3 Machining accuracy based on optimal parameters
Experimental results have showed that there is an uncertainty for selection of working parameters with regard to machining accuracy in EDD of Be-Cu alloys. For example, while higher working currents decrease the core errors in machining region, they also increase wall errors and produce lower depths than the expected depths. Therefore, an optimization
study is necessary to determine optimal EDD parameters for more accurate forms of blind holes. Optimal EDD parameters should reduce form errors in machining zone and produce deeper depths for machining accuracy. For this purpose, grey relation analysis was implemented on the experimental data. All of the experimental results are normalized in the range between 0 and 1 by that method. After normalizing, the best outcome is equal or close to 1 [14]. Based on this study, standardized empirical values -𝑦𝑖(𝑘)- of wall form errors and
core form errors are extracted by Equation 5 based on lower the better feature.
, i i i i i WFE CFE
maxx (k) - x (k)
y (k)
=
maxx (k) - minx (k)
(5)Where, 𝑥𝑖(𝑘) is the 𝑘𝑡ℎ empirical outcome in the 𝑖𝑡ℎ test,
𝑚𝑖𝑛𝑥𝑖(𝑘) and 𝑚𝑎𝑥𝑥𝑖(𝑘) are the minimum and the maximum
values of 𝑥𝑖(𝑘) correspondingly. Additionally, normalized
empirical
values-𝑦𝑖(𝑘)- of depth ratio are expressed by Equation 6 based
on higher the better feature.
r i i i i i D
x (k) - minx (k)
y (k) =
maxx (k) - minx (k)
(6)After that, coefficients of grey relation indicating the interaction between the optimal and real standardized values are settled by Equations 7 and 8 respectively.
( )
min max i 0i max(k)=
k
(7)( )
( )
( )
0ik
y k
0y k
i
(8)Where, 𝜉𝑖(𝑘) is the grey relation coefficient, ∆𝑚𝑖𝑛 and ∆𝑚𝑎𝑥 is
the minimum and the maximum values of ∆0𝑖 relatively, 𝜁 is
the verification constant arranging with regarding systematic real need, explained in the range [0, 1] and usually suggested the value of 0.5, ∆0𝑖(𝑘) is the absolute differences of two
comparative series, 𝑦0(𝑘) is the reference series which is
equal to 1 and 𝑦𝑖(𝑘) is the comparison series in the process.
The bigger coefficient of grey relation 𝜉𝑖(𝑘) will symbolize that
the determined empirical outcome is closer to the optimal or the best standardized result. After derivation of coefficients of grey relation, the grey relation grade is settled as the last phase of the process for a general evaluating. For this purpose, the grey relation grades are calculated by Equation 9.
1 1
( )
n i i kn
k
(9)Where 𝛾𝑖 is the grey relation grade and 𝑛 is the number of the
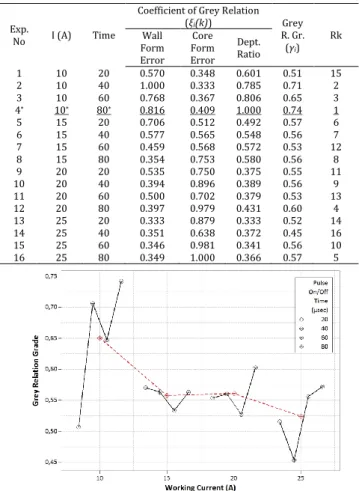
attributes. The higher grey relation grade will refer the optimal EDD parameters for accurate machining. Table 4 gives coefficients of grey relation, the grey relation grades, and their ranks for each experimental condition. It can be seen that lower working current (10 A) and higher pulse time (80 µsec) give the highest grey relation grade. This result can also be seen clearly by data means on Figure 11. As a consequence,
Pamukkale UnivMuh BilimDerg, 24(1), 69-75, 2018 Y. Yıldız
74 lower working current and higher pulse time are suggested in
EDD of materials in terms of machining accuracy.
Table 4: Coefficient of grey relation, grey relation grade and rank (Rk) for each EDD condition.
Exp.
No I (A) Time
Coefficient of Grey Relation (ξi(k)) Grey R. Gr. (γi) Rk Wall Form Error Core Form Error Dept. Ratio 1 10 20 0.570 0.348 0.601 0.51 15 2 10 40 1.000 0.333 0.785 0.71 2 3 10 60 0.768 0.367 0.806 0.65 3 4* 10* 80* 0.816 0.409 1.000 0.74 1 5 15 20 0.706 0.512 0.492 0.57 6 6 15 40 0.577 0.565 0.548 0.56 7 7 15 60 0.459 0.568 0.572 0.53 12 8 15 80 0.354 0.753 0.580 0.56 8 9 20 20 0.535 0.750 0.375 0.55 11 10 20 40 0.394 0.896 0.389 0.56 9 11 20 60 0.500 0.702 0.379 0.53 13 12 20 80 0.397 0.979 0.431 0.60 4 13 25 20 0.333 0.879 0.333 0.52 14 14 25 40 0.351 0.638 0.372 0.45 16 15 25 60 0.346 0.981 0.341 0.56 10 16 25 80 0.349 1.000 0.366 0.57 5
Figure 11: Variation of grey relation grade depending on EDD parameters.
4 Conclusions
This study has attempted to explore machining accuracy in EDD of the copper alloys and considerable outcomes have been observed. Machining accuracy has been evaluated by hole shapes and drilling depths. Following results can be drawn from this study:
Clearly, working current is the prominent parameter that impacts the form errors of the machined holes. However, the effect of pulse time on machining accuracy can be neglected. Lower working current should be used to eliminate wall form errors in blind holes and to obtain higher depth ratios. Conversely higher working current should be preferred to eliminate core form errors in blind holes.
As a summary, lower working current and higher pulse time should be used for the better machining accuracy. This outcome will be beneficial for finishing processes.
More in-depth experimental analyses are suggested to correlate the effect of working currents of EDD with form errors of machined holes for further studies.
5 Acknowledgment
Experiments were performed at the Center for Nontraditional Manufacturing Research (CNMR) in the University of
Nebraska-Lincoln. The author is grateful to Professor Kamlakar P. Rajurkar and to the University of Nebraska-Lincoln for the experimental facilities.
6 References
[1] Rajurkar KP. Nontraditional Manufacturing Processes. Editors: Dorf RC, Kusiak A. Handbook of Design Manufacturing and Automation, 211-241, Hoboken, New Jersey, USA, John Wiley & Sons, Inc., 1994.
[2] Rajurkar KP, Levy G, Malshe A, Sundaram MM, McGeough J, Hu X, Resnick R, DeSilva A. “Micro and nano machining by electro-physical and chemical processes”. CIRP Annals
– Manufacturing Technology, 5582), 643-666, 2006.
[3] Sundaram MM, Rajurkar KP. “Towards freeform machining by micro electro discharge machining process”. Transactions of the North American
Manufacturing Research Institute of SME, 36, 381-388,
2008.
[4] Yildiz Y, Sundaram MM, Rajurkar KP. “Statistical analysis and optimization study on the machinability of beryllium-copper alloy in electro discharge machining”.
Proceedings of the Institution of Mechanical Engineers Part B Journal of Engineering Manufacture, 226(11),
1847-1861, 2012.
[5] Ji R, Liu Y, Zhang Y, Wang F, Cai B, Dong X. “Machining performance optimization in end ed milling and mechanical grinding compound process”. Materials and
Manufacturing Processes, 27(2), 221-228, 2012.
[6] Ozgedik A, Cogun C. “An experimental investigation of tool wear in electric discharge machining”. International
Journal of Advanced Manufacturing Technology, 27(5-6),
488-500, 2006.
[7] Pham DT, Ivanov A, Bigot S, Popov K, Dimov S. “An investigation of tube and rod electrode wear in micro EDM drilling”. International Journal of Advanced
Manufacturing Technology, 33(1-2), 103-109, 2007.
[8] Jeong YH, Min BK. “Geometry prediction of EDM-drilled holes and tool electrode shapes of micro-EDM process using simulation”. International Journal of Machine Tools
and Manufacture, 47, 1817-1826, 2007.
[9] Opoz TT, Ekmekci B, Erden A. “An experimental study on the geometry of microholes in microelectric discharge machining”. Materials and Manufacturing Processes, 24(12), 1236-1241, 2009.
[10] Yan MT, Huang KY, Lo CY. “A study on electrode wear sensing and compensation in Micro-EDM using machine vision system”. International Journal of Advanced
Manufacturing Technology, 42, 1065-1073, 2009.
[11] Yan MT, Lin SS. “Process planning and electrode wear compensation for 3D micro-EDM”. International Journal
of Advanced Manufacturing Technology, 53(1-4),
209-219, 2011.
[12] Nguyen MD, Wong YS, Rahman M. “Profile error compensation in high precision 3D micro-EDM milling”.
Precision Engineering, 37(2), 399-407, 2013.
[13] Yildiz Y, Sundaram MM, Rajurkar KP. “Empirical modeling of the white layer thickness formed in electrodischarge drilling of beryllium-copper alloys”.
International Journal of Advanced Manufacturing Technology, 66(9-12), 1745-1755, 2013.
[14] Deng JL. “Introduction to grey system theory”. Journal of
Pamukkale UnivMuh BilimDerg, 24(1), 69-75, 2018 Y. Yıldız
75
Appendices
𝑉𝑒 : Volumetric error (mm3),
𝑖, 𝑛 : Number of observations in an experimental design,
𝑟 : Radius of the hole,
𝐷𝐹 : Degrees of freedom (DF is found by taking the number of group levels minus 1), 𝑆𝑆 : Sum of squares,
𝑀𝑆 : Adjusted mean square (SS/DF),
𝐹 : F-statistic (Calculated by taking the MS for the variable divided by the MS of the error)
𝑃 : 𝑝-value,
𝑅2 : Coefficient of determination,
𝐷𝑟 : Depth ratio (%),
𝑑𝑜 : Obtained depth (mm),
𝑑𝑒 : Expected depth (mm),
𝐼𝑤 : Working current (A),
𝑡𝑝 : Pulse time (µsec),
𝑦𝑖(𝑘) : Normalized experimental values,
𝑥𝑖(𝑘) : kth experimental result in the ith experiment
𝑚𝑖𝑛𝑥𝑖(𝑘) : Minimum values of 𝑥𝑖(𝑘)
𝑚𝑎𝑥𝑥𝑖(𝑘) : Maximum values of 𝑥𝑖(𝑘)
𝜉𝑖(𝑘) : Coefficient of greyrelation,
∆𝑚𝑖𝑛,
∆𝑚𝑖𝑛
: Minimum and maximum values of ∆0𝑖
𝜁 : Identification coefficient,
∆0𝑖(𝑘) : Absolute differences of two comparative
sequence,
𝑦0(𝑘) : Reference sequence,
𝑦𝑖(𝑘) : Objective/comparison squence,
