Hittite Journal of Science and Engineering, 2020, 7 (2) 99-108 ISSN NUMBER: 2148-4171
DOI: 10.17350/HJSE19030000178
N
owadays, the competition of the companies con-tinues rapidly and each of them tries to make the best decisions. Decision making in all sectors sho-uld be made according to the different criteria at the same time. Multi-criteria decision making problems can be handled in different areas such as construc-tion sector. The decisions should be made by trying to optimize each criterion but some of them conflict. Therefore multi-criteria decision making (MCDM) approaches can be used in these problems.Aggregates which constitute the undercarriage of concrete, the most widely used load bearing structure material, are used in amounts of 1600 to 1900 kg in 1 m3
of concrete mixture based on varying factors. While the physical (petrographic structure, granulometric combi-nation, density and water absorption ratio, unit weight, organic and washable material ratio, alkaline aggrega-te reactivity, abrasive strength, etc.) and mechanical (compressive strength, modulus of elasticity, Poisson’s ratio) properties of aggregate effect the concrete’s strength, durability, stability in time, appearance,
we-Article History: Received: 2019/12/20 Accepted: 2020/05/10
A Knowledge-Based System for Fine Aggregate Material
Problem Selection in Concrete Production
Abdullah Demir
Kutahya Dumlupinar University, Department of Civil Engineering, Kutahya, Turkey
Online: 2020/06/26
Correspondence to: Abdullah Demir, Deparment of Civil Engineering, Kütahya Dumlıpınar University, Kütahya, Demir Tel: +90 2744434140
Fax: +90 2742652066
E-Mail:[email protected]
ight and workability, they also play an important role in the unit material cost of the concrete. For example, the elasticity module of the concrete is controlled by the elasticity module of the mixture and aggregate, and therefore, aggregate choice becomes important in cases where portion calculations and fineness are important. Additionally, the aggregate’s physical properties are important in choice of methods in concrete mixtu-re design [1]. In case of strong, quality aggmixtu-regate with constant water absorption ratio, the design is based on a constant water/cement ratio. In this case, the standard deviation of compression strength becomes smaller. If the aggregate has high water absorption ratio, it comes from different sources or there are fluctuations in its granulometric composition, the design of the mixture is prepared based on constant settlement. Preference and control of the aggregate are also important for quality control. The main properties preferred for concrete agg-regates are the following:
• Suitable granulometrics • Exclusion of harmful materials • Sufficient strength
A B S T R A C T
O
ne of the main problems of our country is inability to select the right materials of high quality in production. Decision making based on multiple criteria has an important role to do the right selections in each sector. One of these sectors is construction. Construction sector develops rapidly and using the right material is an important issue. Using the right material in this period when construction sector develops rapidly has a great importance. In the construction sector, the building material which has been used the most widely from past to present is concrete. In this study, a knowledge-based system via TOPSIS approach was proposed to generalize the multi-criteria decision making problems of fine aggregate mate-rial selection in concrete production. In addition, six different mortar series were produced by using the fine aggregates which were obtained from various plants used in the production of ready-mixed concrete in Kütahya and CEN Standard sand. The methylene blue, physical and mechanical tests were carried out on the produced mortars in order to get an idea for the strength and durability of concrete. The purpose of the study was to determine which of the five different fine aggregates had characteristics that are the closest to those of CEN Stand-ard sand based on defined these multi criteria. It was found that the best fine aggregate series was A based on the defined criteria by considering the results of the experiments, assigning weights based on importance and analyzing these with TOPSIS approach.I
NTRODUCTIONKeywords:
A. Demir / Hittite J Sci Eng, 2020, 7 (2) 99 –108
ge-based system can be used to evaluate different materials.
TOPSIS AND KNOWLEDGE-BASED
SYSTEM FOR MATERIAL SELECTION
Material selection problem is one of the important mul-ti criteria decision making problems for the producmul-tion processes in the sectors and also the environmental im-pacts in the world. The problem has been studied in the literature in different aspects. Jahan et al. [7] studied on a literature review and presented that TOPSIS, ELECT-RE (Elemination and Choice Translating Reality English) and AHP (Analytic Hierarchy Process) have been the most prevalent techniques in material selection con-text. Warren Liao [8] presented two interval type 2 fuzzy multi-attribute decision making methods that based on TOPSIS for material selection problem. Yazdani and Pa-yam [9] analyzed for different applications of microelect-romechanical systems electrostatic actuators, based on the actuation voltage and force, speed of actuation and electrical resistivity, and selected the most appropriate materials by using TOPSIS and VIKOR (VlseKriteri-jumska Optimizacija I Kompromisno Resenje). Kaspar et al. [10] presented a formalized approach to support the material selection decisions. The approach is part of an overall material-oriented development methodology that considers production process and material information. Mousavi-Nasab and Sotoudeh-Anvari [11] used a simp-le and comprehensive MCDM-based framework to sol-ve a material selection problem with TOPSIS, COPRAS (Complex Proportional Assessment) and DEA (Data En-velopment Analysis). Zhang et. al. [12] studied on how to select a suitable material in multiple bone transplant replacement materials with similar properties by a TOP-SIS method. Maghsoodi et al. [13] studied on a material selection problem by applying a hybrid decision-making approach supported on the Step-Wise Weight Assess-ment Ratio Analysis (SWARA) method and COmbinative Distance-based ASsessment (CODAS) technique conta-ining target-based attributes. A case-study for selecting the optimal cement material type based on a real-world conceptual dam construction project in Iran has been analyzed.In the literature, it can be seen that TOPSIS with infor-mation systems has been studied in some fields. Papathana-siou et al. [14] presented an implementation of a web-based decision support system that incorporates TOPSIS and VIKOR and allows decision makers to compare the results. Ploskas and Papathanasiou [15] studied on a decision sup-port system for multiple criteria alternative ranking using TOPSIS and VIKOR in fuzzy and non-fuzzy environments. Kwok and Lau [16] studied on a decision support algorithm entitled as Vague Set TOPSIS to help travelers to rank the hotel options. Konstantinos et al. [17] proposed a methodo-• Suitable grain shape
• Strength against frost
Based on the place where the concrete will be used and conditions of usage and environment, some of the proper-ties mentioned above may be more important, while some may be less important. While choosing the source of aggre-gate, these properties are determined by conducting labo-ratory analyses, investigating reports of previous analysis and consulting other users who supply aggregates from the same source. In addition to these, capacity of the furnace, uniformity of the material, organization and the order of working are also considered. After determining potential sources, concrete mixture trials are made and technical and economic tests are conducted. Quality is also constantly controlled during production.
Decision makers may encounter multi-criteria prob-lems in every area and they aim to find the most suitable so-lutions to these problems in the shortest possible time. For this problem in CEN (European Committee for Standardi-zation) standard sand with different aggregates, methylene blue, compressive strength, ultrasonic pulse velocity, water absorption by weight, flexural strength, capillarity coeffici-ent and modulus of dynamic elasticity values were obtained and the most suitable aggregate series was obtained. There-fore, TOPSIS (Technique for Order Preference by Similarity to Ideal Solution) approach, which is one of the methods of multi criteria decision making, was used with this purpose. On the other hand, a knowledge based system for TOPSIS was proposed to generalize the MCDM problems in mate-rial selection.
TOPSIS approach was developed by Hwang and Yoon in 1981 to solve multi criteria decision making problems [2]. The logic of the approach is based on determining the option that is the closest to the positive ideal solution and farthest from the negative ideal solution [3]. Its application in different fields may be seen in the literature. These fields include energy, strategy, production/engineering [4], supply chain management and logistics, marketing, human reso-urces, environment and resource management [5], financial performance analysis [6].
In this study, a knowledge-based system was proposed to find out the optimum aggregate serial. Based on this opi-nion, some experiments were made in order to obtain the methylene blue values and physical and mechanical proper-ties of fine aggregates used as fine materials in the ready-mixed concrete plant in the province of Kütahya. According to the experiment results, it was aimed to determine the sample with properties that are the closest to those of CEN Standard sand, accepted as the ideal, by considering multi criteria via TOPSIS approach. Also, the proposed
knowled-A. Demir/ Hittite J Sci Eng, 2020, 7 (2) 99–108 logy which is the combination of a MCDM and GIS
(Geog-raphic Information System) in order to determine the most suitable locations for wind farms installation. The calcula-ted locations are then ranked with TOPSIS to rank the loca-tions based on installation suitability.
In this study, a knowledge-system with TOPSIS was proposed for fine aggregate material selection problem in the production of ready-mixed concrete. To determine the contributions of the series in the concrete is an important issue and the problem can be recurrently solved based on the problem with an interactive way. Therefore a knowledge based system was proposed in the study.
The steps in the application of TOPSIS are given as the following:
Step 1. Formation of the decision matrix
Step 2. Formation of the standard decision matrix Step 3. Formation of the weighted standard decision matrix
Step 4. Formation of the ideal ( A*
) and negative ide-al ( A− ) solutions
Step 5. Calculation of the criteria of alternation Step 6. Calculation of the relative proximity to the ideal solution
The interface of the knowledge-based system is gi-ven in Fig. 1. Matlab was used to design the system. The evaluation can be done by entering the number of criteria and series firstly, then the definitions can be made and after calculations the ranks can be given by the system.
Step 1.Enter the number of criteria and series Step 2.Define the criteria and series
Step 3.Enter the decision matrix Step 4.Enter the weights of the criteria
Step5. Define the objectives’ directions such as
ma-ximization or minimization
Step6. Select the TOPSIS type for the analysis and push ‘Results Report’ button.
The calculation details for TOPSIS are given with a case study in the fine aggregate material selection prob-lem part.
MATERIALS AND EXPERIMENT
RESULTS
The study consisted of four stages as methylene blue, sample production, physical and mechanical experiments. Materials
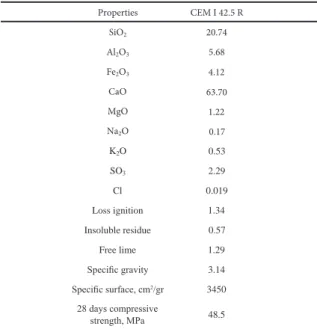
The study used CEM I 42.4 R cement, produced by a ce-ment factory. The chemical properties of this cece-ment are given in Table 1. As water mixture, the city of Kütahya mains water with 5.8 mg/lt sulphate content, 3.9 mg/lt hardness and pH 6.3 was used. For the mixture series to be prepared, CEN Standard sand was used in the control series. In the remaining mixture series, fine aggregates
obtained from different ready-mixed concrete facilities in Kütahya and designated as A, B, C, D and E were used. Criteria
In the study, the methylene blue values of the fine mate-rials were determined before starting mixture producti-on. Methylene blue experiment starts with preparing a methylene blue solution. For the solution, 10 gr of meth-ylene blue powder is added onto 50 ml of distilled water at 40°C in the beaker. It is stirred until the powder dissolves and cooled down to 20°C. The solution in the beaker is transferred to a 1-liter volumetric flask. Distilled water is added to fill it up to 1 liter and it is transferred to a lightly
Figure 1. Interface of the proposed knowledge-based system
While using TOPSIS in the knowledge-based system, the following steps were applied to evaluate the materials by the proposed system.
Table 1. Properties of the cement
CEM I 42.5 R 20.74 5.68 4.12 63.70 1.22 0.17 0.53 2.29 0.019 1.34 0.57 1.29 3.14 Properties SiO2 Al2O3 Fe2O3 CaO MgO Na2O K2O SO3 Cl Loss ignition Insoluble residue Free lime Specific gravity Specific surface, cm2/gr 3450 28 days compressive strength, MPa 48.5
A. Demir / Hittite J Sci Eng, 2020, 7 (2) 99 –108
colored protective glass bottle. After the methylene blue solution is prepared, stain experiment starts. To form a suspension, the dried part of experiment sample (200 gr of sand passed through 2 mm sieve) is added to 500 ml of distilled water by stirring. The suspension is mixed in the speed of 600 cycles/min for 5 minutes. Then 5 ml of stain solution is added, and the process continues at 400 cycles/ min. After 1 minute of mixing, a drop is taken from the mixture by a glass rod and dropped on filter paper. The filter paper should be placed on a beaker or a suitable support so that its surface does not contact any solid or liquid. Mixture is continued after adding another 5 ml of stain. Again, after 1 minute, a drop is added on the filter paper. It is expected that a light blue circle surrounding a blue central accumulation will form. Otherwise, the same process is repeated by adding 5 ml of stain again. Stain experiment and stain addition is continued with 1 minute intervals until a circle is formed. After 5 minutes, the process is continued by adding 2 ml of stain instead of 5. In the case of circle formation, it the circle can be sustained for 5 minutes, the experiment is considered po-sitive and ended. The amount of stain added until circle formation is recorded. The light blue circle’s thickness should be about 1 mm for the accumulation between 8 mm and 12 mm [18].
In this study, mixture preparation was made based on TS EN 196-1 [19]. Based on TS EN 196-1 [19] materials were determined by mass as one-part cement, three-parts stan-dard sand and 1/2-part water (water/cement ratio of 0.50). In amounts sufficient for three experiment containers with di-mensions of 40x40x160 mm, 450±2 g CEM I 42.5 R, 1350±5 g aggregate and 225±1 g water were prepared for each mix-ture series. Cement, aggregate, water and devices were kept in the temperature of the laboratory environment.
A cement mixer suitable for TS EN 196-1 [19] was used for mixture preparation. The mixture is obtained as a re-sult of mechanical mixing for 4 minutes. While the mixer is working, the water is poured into the mixing container and cement is added. Then the mixer is used in low speed, and after 30 seconds, the aggregate is added for 30 seconds by constantly stirring. When all materials are combined, the mixer is set to high speed and used for 30 more seconds. The mixer is stopped after 1 minute and 30 seconds. The parts of the mixture accumulated on the sides and base of the container are collected by a plastic scraper for 15 se-conds and gathered in the middle. It is covered by a damp cloth and let rest for 75 seconds. Mixing is continued for another 60 seconds in high speed. The prepared mixture is added onto the molds with dimensions of 40x40x160mm in two steps, containing 60 free falls in each step on the vibra-tory table unit. The mixture series prepared in this way, af-ter flattening the mixture surface at the end, were laid to rest for 24 in the climatization cabin with 90% relative humidity.
The samples removed from the molts were kept in lime-sa-turated water at 20±2°C for physical and mechanical tests till the 7th and 28th days, and their physical and mechanical characteristics were determined in the following stage. Results of the Methylene Blue Experiment
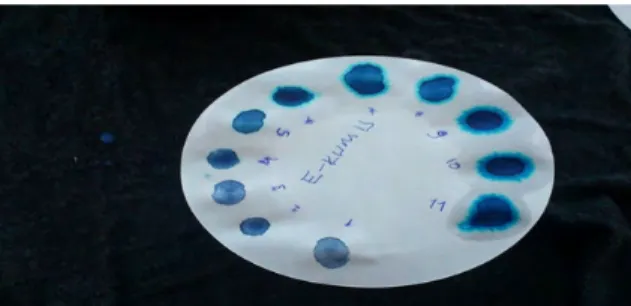
A methylene blue analysis experiment was run for the aggregates used in the study. The purpose of this experi-ment is to determine the content of clay-based materials in the fine aggregate. This is because humic and organic materials in fine aggregates distribute finely and damage the hardening and compression strength of the concrete, or distribute in grains and lead to changes in color or te-aring on the surface of the concrete by expanding. It has been observed that aggregates with the same rate of fine materials provide very different methylene blue values. Fig. 2 shows the filter paper as a result of methylene blue in the sand E. The methylene blue results of other aggre-gates and relative analysis results obtained by taking the standard sand series representing CEN Standard sand as a reference are given in Fig. 3. Methylene blue values change in the range of 0.1-0.350 ml/g in series. The hig-hest methylene blue value was in sand C, with 250% inc-rease on the reference series. The lowest value was seen in sand A with 125% increase over the reference series. There were significant changes between the methylene blue values of the series and the reference value. In order to predict concrete behavior, there is a need for meth-ylene blue experiment, which provides information about the quality of fine materials. Including this experiment in continuous quality control plans is useful to guarantee the sustainability of the quality of the aggregate, and the concrete produced with it.
Figure 2. Determining the methylene blue value of sand
A. Demir/ Hittite J Sci Eng, 2020, 7 (2) 99–108
Physical and Mechanical Experiment Results
Unit weight, ultrasonic pulse velocity, water absorption by weight, capillarity, flexural strength and compressive experiments were conducted at the end of the 7th and 28th days on mixture samples prepared according to TS EN 196-1 [19]. Unit weights, ultrasonic pulse velocities, modules of dynamic elasticity, water absorption rates by weight, capillarity coefficients, flexural strengths and compressive strengths were calculated for the samples. In the analyses made in varying durations of curing, the results of relative values obtained by calculations taking the sample age of all samples of the standard sand series as a reference were explained.
Fig. 4 shows the changes in unit weight in series com-posed of different fine aggregates in different ages. The unit weights in the produced mixture series change between 2.12 and 3.15 g/cm3. The unit weight of the standard sand
series changes in the range of 2.23-2.25 g/cm3. When the
produced series were compared among each other especi-ally in further ages, an average of 1% increase was seen in their unit weights. However, when their unit weights were analyzed in relation to the standard sand series, sands C and E had values that were 3% and 2% lower respectively. There-fore, it is concluded that the composition of the aggregates in these series were lower.
Figure 4. Relative unit weight values
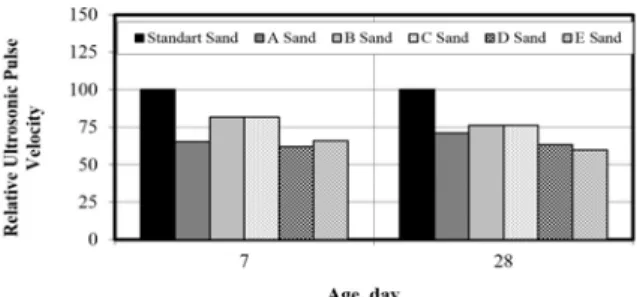
calculated relative ultrasonic pulse velocities of the series. The values of ultrasonic pulse velocity changed between 4.98 and 2.94 km/s. At the end of the 7th and 28th days, the ultrasonic pulse velocities of the standard sand series were 4.73 and 4.98 respectively. The highest velocity values in dif-ferent curing times were obtained from the standard sand series. Based on the results at the end of the 28th day, the standard sand was followed in order by sands C and A. It was observed that, as a result of two different curing times, all samples had ultrasonic pulse velocities over 3 km/s, ex-cept the 7th day value of the sand D. The ultrasonic pulse velocities of sand A and C series changed between 3.09 and 3.86 km/s at the end of two different curing times. Conside-ring the change in velocities between the series’ own values in two different curing times, the highest increase was seen
in sand A by 9%. The highest rate of decrease based on the standard sand series was seen in sand D by 28%. This shows that porosity increased in sand D series.
Fig. 6 shows relative modulus of dynamic elasticity va-lues calculated using the results of ultrasonic pulse velocity and unit weight. Modulus of dynamic elasticity (Edin) was calculated using Equation (1).
5 2
10 9.81
xV x
Edin= ∆ (1)
In Equation (1), “V” is the ultrasonic pulse velocity in units of km/s, “∆” is the unit weight in units of kg/lt, and the unit of Edin is GPa [20]. Modulus of dynamic elasticity valu-es changed between 20.14 and 51.90 GPa. Considering the results, the changes in modulus of dynamic elasticity of sands A and C relative to the standard sand series were lo-wer than those of other series. The highest decrease was fo-und as 31% in sand E series in the 28th day.
Fig. 7 shows the tensile strength values calculated using the results of the flexural strength experiments conducted on mixture series. The tensile strength values changed bet-ween 2.47 and 4.51 MPa at the end of the 7th day. At the end of the 28th day, they changed between 6.28 and 4.00 MPa. Considering the tensile strengths at the end of the 7th day, tensile strength values of the series of sands A and B were higher than that of the standard sand series by 38% on average. At the end of the 28th day, it was observed that tensile strength values of all series except B were lower than that of the standard sand series. The increase in the tensile strength of sand B was 6% in relation to the standard sand series. The highest amount of decrease in relation to the standard sand series was seen in sands C, D and E by 23%.
Figure 5. Relative ultrasonic pulse velocity values
Figure 6. Relative modulus of dynamic elasticity values
In the ultrasonic pulse velocity experiment, the veloci- ties were found between 32.1 and 52.4 µ s. Fig. 5 shows the
A. Demir / Hittite J Sci Eng, 2020, 7 (2) 99
–108 Fig. 9 shows the samples’ water absorption by weight values. No very large differences were seen in the values of the series for different curing periods. The water absorption by weight values changed in the range of 7-11.15%. The stan-dard sand series had the lowest water absorption by weight value. All other series had higher values. After the 7th day, the highest increase in water absorption by weight value was seen in sand D by 21%. A 3% decrease was observed in sand B series. However, in the water absorption by weight values calculated at the end of the 28th day, the highest increase was found again in sand D by 56%, and the lowest was found in sand C by 27%. It was followed by sands B, A and E with very small difference. The increase in the water absorption values is an important factor in understanding the permea-bility and therefore durapermea-bility of the concrete in cases where
physical characteristics are important. It is preferred that this value is not too high.
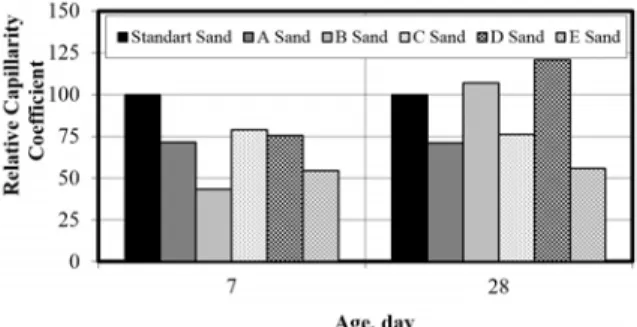
Fig. 10 shows the capillarity coefficients calculated using the capillary absorption experiments conducted on mixture samples. Capillarity coefficients changed between 1.79 x 10⁻⁶ and 7.64 x 10⁻⁶ cm2/s. In the analyses conducted
by taking the standard sand series as reference, the capilla-rity coefficients of all series were found low at the end of the 7th day. In the capillarity coefficients obtained at the end of the 28th day, there were increases in sands B and D by 6% and 20% respectively. The highest amount of decrease was found in the sand E series by 45%. This series was followed by the sand A series by 29%, and the sand C series by 24%. As opposed to the case in other properties, these series had
lower capillarity coefficients in relation to the standard sand series. This is a preferred situation in cases where physical properties are important. This is because, due to the good distribution of aggregate grains in these series, the distances among grains are shorter, the connective mixture is used on an optimal level, the interface connections between the aggregate and the mixture are stronger, and a higher quality outer surface is formed.
Fine Aggregate Material Selection Problem
In this study, a fine aggregate material selection prob-lem in concrete production was studied by designing a knowledge-system to obtain an interactive decision making environment. A case study for concrete production was analyzed with TOPSIS based knowledge system as in the steps below [2] and the most suitable series was proposed.
Step 1. Formation of the decision matrix
In the experiment results, methylene blue (ml/gr) (C1),
Figure 7. Relative tensile strength values
Fig. 8 shows the relative compressive strength values of the produced fine aggregate mixture samples. Compressive strength values were between 23.08 and 54.80 MPa. The 7th and 28th day values of the standard sand series were 38.7 and 54.80 MPa respectively. Compressive strengths of other series came out to be lower than those of the standard sand series. It was observed that only the compressive strength values of sands A and B were higher than that of the stan-dard sand series by 10% and 5% respectively at the end of the 7th day. The sand A had a 10% lower value in relation to the standard sand series at the end of the 28th day. These series were followed by sand C (24%), sand E (37%) and sand D (43%). When the increase in strength of the series is consi-dered within their own values, the highest increase from the 7th to the 28th day was seen in sand B by 44%.
Figure 8. Relative compressive strength values
Figure 9. Relative water absorption by weight values
Figure 10. Relative capillarity coefficient values
A. Demir/ Hittite J Sci Eng, 2020, 7 (2) 99–108 compressive strength (MPa) (C2), ultrasonic pulse velocity
(km/s) (C3), water absorption by volume (%) (C4), flexural strength (MPa) (C5), capillarity coefficient (10-6 cm2/s) (C6)
and modulus of dynamic elasticity (GPa) (C7) were used as criteria and the decision matrix in Table 2 was formed.
In the proposed knowledge-based system, the decision matrix was obtained by using the data entry interface and definitions of series as given Fig. 11 and 12. The decision matrix can be seen in Fig. 13.
Step 2. Formation of the standard decision matrix All criteria were converted to the maximization form and the standard decision matrix was formed using the aij values in Table 3 as in the Equation (2).
Table 2. Decision matrix
C1 C2 C3 C4 C5 C6 C7 Standart sand 0.10 54.80 4.98 7.00 5.91 3.20 51.90 A sand 0.23 50.28 3.54 9.23 5.29 2.28 29.55 B sand 0.25 48.62 3.37 9.14 6.28 3.42 26.97 C sand 0.35 41.76 3.79 8.95 4.01 2.44 34.12 D sand 0.28 31.30 3.15 11.15 4.01 3.87 22.76 E sand 0.28 34.84 2.98 9.44 4.00 1.79 20.49
Figure 11. Data entry interface
Figure 12. Definitions of criteria and series
Figure 13. Decision matrix
(2)
While compressive strength, ultrasonic pulse velocity and flexural strength were criteria for maximization, others were criteria for minimization. All criteria were represen-ted for maximization for calculations. While the weights of methylene blue, compressive strength and capillarity coef-ficient were 0.20 in the analyses, others’ weights were 0.10. The weighted standard decision matrix in Table 4 was for-med by multiplication of criterion values with the defined weights.
Table 3.Standard decision matrix
C1 C2 C3 C4 C5 C6 C7 Standart sand 0.795 0.503 0.550 0.725 0.481 0.216 0.648 A sand 0.397 0.462 0.391 0.335 0.431 0.514 0.369 B sand 0.318 0.446 0.372 0.351 0.511 0.145 0.337 C sand 0.000 0.383 0.418 0.384 0.326 0.462 0.426 D sand 0.222 0.287 0.348 0.000 0.326 0.000 0.284 E sand 0.238 0.320 0.329 0.298 0.326 0.673 0.256
Table 4. Weighted standard decision matrix
C1 C2 C3 C4 C5 C6 C7 Standart sand 0.159 0.101 0.550 0.073 0.048 0.043 0.065 A sand 0.080 0.092 0.039 0.034 0.043 0.103 0.037 B sand 0.064 0.089 0.037 0.035 0.051 0.029 0.034 C sand 0.000 0.077 0.041 0.038 0.033 0.093 0.043 D sand 0.045 0.058 0.035 0.000 0.033 0.000 0.028 E sand 0.048 0.064 0.033 0.030 0.033 0.135 0.026 Figure 14. Weights
Figure 15. Objective directions
Step 4. Formation of the ideal ( A* ) and negative ideal
( A− ) solutions
The ideal solution set is formed by choosing the highest ones among the weighted analysis criteria. Formation of the ideal solution set is shown in Equation (3).
Step 3. Formation of the weighted standard decision matrix
The weights and the objectives were also entered to the proposed system as given in Fig. 14 and 15. On the other hand, the interface of the proposed system with data can be seen in Fig. 16.
A. Demir / Hittite J Sci Eng, 2020, 7 (2) 99 –108 (3) The set calculated using the Equation (3) may be shown
as * * 2 * 1 * , ,..., n v v v A = .
The negative ideal solution set is formed by choosing the smallest ones among the weighted analysis criteria. For-mation of the negative ideal solution set is shown in Equa-tion (4).
(4) The set calculated using the Equation (4) may be shown
as A v1,v2,...,vn .
Step 5. Calculation of the criteria of alternation The Euclidean distance approach is used in the TOPSIS approach to find the deviations from the positive ideal and negative ideal solution sets of the analysis criteria value of each series. The deviation values of the determined series are defined as positive ideal alternative ( *
i
S ) and negative
ideal alternative (Si
−
) criteria. Calculation of the positive ideal alternative ( *
i
S ) criterion is given in Equation (5),
whi-le calculation of the negative ideal alternative (Si
−
) criterion is given in Equation (6).
(5) (6) Step 6. Calculation of the relative proximity to the ideal solution
Ideal and negative ideal alternative criteria are used in calculation of the relative proximity of each series to the ide-al solution, *
i
C . The values of proximity to the ideal solution
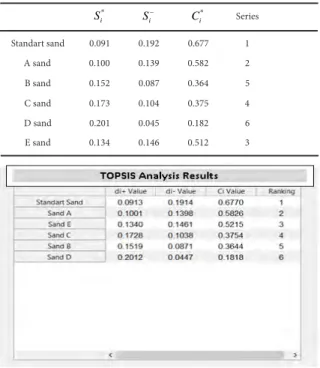
were calculated using the Equation (7) and the rank of the series among themselves based on the considered criteria is
given in Table 5. The results of the problem by the proposed knowledge-based system can be also seen in Fig. 17.
(7)
• Results of methylene blue experiment showed that aggregates with the same fine material ratio had very different methylene blue values. The sand A series had the closest methylene blue value to that of the CEN Stan-dard sand. Methylene blue experiment, which shows the
Table 5. Rank of the series
* i S Si − * i C Series Standart sand 0.091 0.192 0.677 1 A sand 0.100 0.139 0.582 2 B sand 0.152 0.087 0.364 5 C sand 0.173 0.104 0.375 4 D sand 0.201 0.045 0.182 6 E sand 0.134 0.146 0.512 3
Figure 16. Interface of the knowledge-based system with data
Figure 17. Interface of the analysis results
CONCLUSION
In the study, a decision making problem with multiple criteria in selection of the most suitable aggregate series in the construction sector was studied. In this case, dif-ferent related criteria were evaluated and tried to be op-timized. TOPSIS approach was used to determine which of the five different aggregates used in concrete produc-tion as fine aggregate had properties that are the closest to those of CEN Standard sand, which was assumed to be ideal. The study utilized methylene blue experiments on fine aggregates in the series, and physical and mec-hanical experiments on mixture samples obtained using these aggregates. The outcomes of these experiments are given below:
Considering these proximity values, the standard sand had the first place in the order of proximity to the ideal value. This situation is expected due to the fact that the standard sand was taken as ideal, while the aggregate series in the se-cond place belonged to sand A.
A. Demir/ Hittite J Sci Eng, 2020, 7 (2) 99–108 quality of fine material, is needed to predict the behavior
of the concrete. It is recommended that aggregate produ-cers should make improvements based on methylene blue experiment results.
• Based on the unit weight experiment results, the sand D series had a unit weight value higher than all other series.
• According to the ultrasonic pulse velocity ex-periment results, which provide information regarding the pockets in the mixture or the concrete, the highest values after those of CEN Standard sand belonged to sands C and A.
• According to the modulus of dynamic elasticity results obtained by using the unit weight and ultrasonic pulse velocity values, again, the series of sands C and A had the highest values following those of CEN Standard sand.
• The highest tensile strength value among the ones obtained as a result of flexural strength experiments was found in the series of sand B.
• In one of the most significant properties of concrete, the highest compressive strength was seen in sand A, after CEN Standard sand.
• While the physical property of water absorpti-on by weight value is absorpti-one of the preferred properties in ca-ses where the concrete’s strength against external factors is important, the series of sand C was found to have the lowest water absorption by weight value.
• While the capillarity coefficient is one of the most important physical properties that provide infor-mation on permeability, which is the most significant reason for problems in durability, the lowest value of ca-pillarity coefficient in the study belonged to the series of sand E.
As the purpose of the study was to determine which of the five different fine aggregates had characteristics that are the closest to those of CEN Standard sand based on defined these multi criteria, it was found that the best fine aggregate series was A based on the defined criteria by considering the results of the experiments, assigning weights based on importance and analyzing these with TOPSIS approach. The ranks of the other series were as sand E, sand C, sand B and sand D. On the other hand, different criteria may be analyzed by using TOPSIS approach and different results may be obtained by changing the weights of the criteria in the future studies.
Considering all these issues, choice of materials and properties of such materials may be significant for the de-sired qualities of workability, strength and durability in concrete and technology of concrete. It may be difficult to make a decision in material selection when all properties are
considered and there is a question of ranking the importan-ce of importan-certain criteria. Henimportan-ce, it can be recommended to use multi criteria decision making techniques like TOPSIS in the selection or usage of materials to achieve more accurate results. On the other hand, as an extension of this study, it is thought that it would be beneficial for the sector to carry out study involving the solution of a problem in which all of the basic materials that make up concrete, such as cement, aggregate and concrete admixture, are included and cost in-formation is added.
R E F E R E N C E S
1. Arıoğlu E, Köylüoğlu ÖS. Discussion of “estimation of coarse aggregate strength in high strength concrete” by TP Chang and N K Su. ACI Materials Journal November-December (1996) 637-639. 2. Olson DL. Comparison of weights in TOPSIS models. Mathematical
and Computer Modelling 40 (2004) 721-727.
3. Wu DS, Olson DL. A TOPSIS data mining demonstration and application to credit scoring. International Journal of Data Warehousing and Mining 2(3) (2006) 1-10.
4. Huanga IB, Keislerb J, Linkov I. Multi-criteria decision analysis in environmental sciences: Ten years of applications and trends. Science of The Total Environment 409(19) (2011) 3578–3594. 5. Velasquez M, Hester PT. An analysis of multi-criteria decision
making methods. International Journal of Operations Research 10(2) (2013) 56-66.
6. Feng CM, Wang RT. Considering the financial ratios on the performance evaluation of highway bus industry. Transport Reviews: A Transnational Transdisciplinary Journal, 21(4) (2001) 449-467.
7. Jahan A, Ismail MY, Sapuan, SM, Mustapha F. Material screening and choosing methods–a review. Materials & Design 31 (2010) 696-705.
8. Warren Liao T. Two interval type 2 fuzzy TOPSIS material selection methods. Materials & Design (2015) 1088-1099.
9. Yazdani M, Payam AF. A comparative study on material selection of microelectromechanical systems electrostatic actuators using Ashby, VIKOR and TOPSIS. Materials & Design 65 (2015) 328-334. 10. Kaspar J, Baehre D, Vielhaber M. Material selection based on a product and production engineering integration framework. Procedia CIRP 50 (2016) 2–7.
11. Mousavi-Nasab SH, Sotoudeh-Anvari A. A comprehensive MCDM-based approach using TOPSIS, COPRAS and DEA as an auxiliary tool for material selection problems. Materials & Design 121 (2017) 237-253.
12. Zhang K, Zhan J, Yao Y. TOPSIS method based on a fuzzy covering approximation space: An application to biological nano-materials selection. Information Sciences 502 (2019) 297-329.
13. Maghsoodi AI, Maghsoodi AI, Poursoltan P, Antucheviciene J, Turskis Z. Dam construction material selection by implementing the integrated SWARA–CODAS approach with target-based attributes. Archives of Civil and Mechanical Engineering 19(4) (2019) 1194-1210.
14. Papathanasiou J, Ploskas N, Bournaris T, Manos B. A Decision Support System for Multiple Criteria Alternative Ranking Using TOPSIS and VIKOR: A Case Study on Social Sustainability in Agriculture. In: Liu S., Delibašić B., Oderanti F. (eds) Decision Support Systems VI - Addressing Sustainability and Societal Challenges. ICDSST 2016. Lecture Notes in Business Information
A. Demir / Hittite J Sci Eng, 2020, 7 (2) 99 –108
Processing, 250. Springer, Cham, 2016.
15. Ploskas N, Papathanasiou J. A decision support system for multiple criteria alternative ranking using TOPSIS and VIKOR in fuzzy and nonfuzzy environments. Fuzzy Sets and Systems Available online 23 January 2019, in press (2019).
16. Kwok PK, Lau HYK. Hotel selection using a modified TOPSIS-based decision support algorithm. Decision Support Systems 120 (2019) 95-105.
17. Konstantinos I, Georgios T, Garyfalos A. A Decision Support System methodology for selecting wind farm installation locations using AHP and TOPSIS: Case study in Eastern Macedonia and
Thrace region, Greece. Energy Policy 132 (2019) 232-246. 18. TS EN 933-9+A1. Tests for geometrical properties of aggregates
- part 9: assessment of fines - methylene blue test. Turkish Standardization Institute, Ankara (in Turkish), 2014.
19. TS EN 196-1. Methods of testing cement - part 1: determination of strength. Turkish Standardization Institute Ankara (in Turkish), 2009.
20. Postacıoğlu B. Concrete-Binding Materials. Aggregates Concrete Volume 2, Turkey, Istanbul Technical University (in Turkish), 1986.