I
KADIR HAS UNIVERSITY
GRADUATE SCHOOL OF SOCIAL SCIENCES
ANALYSIS OF THE DETERMINANTS OF ECOLOGICAL FOOTPRINT IN TURKEY
GRADUTE THESIS
ALİ ALPER ALEMDAR
II APPENDIX B Al i Al p er Al em d ar M .A . Th esi s 20 15 Stu d ent’s Fu ll Na m e P h .D. (o r M .S . o r M .A .) The si s 20 11
III
ANALYSIS OF THE DETERMINANTS OF ECOLOGICAL FOOTPRINT IN TURKEY
ALİ ALPER ALEMDAR
Submitted to the Graduate School of Social Sciences in partial fulfillment of the requirements for the degree of
Master of Arts in ECONOMICS
KADIR HAS UNIVERSITY February, 2015
KADIR HAS UNIVERSITY APPENDIX B
i
Table of Contents
Abstract
Özet
Acknowledgements
List of Tables vii
List of Figures viii List of Abbreviations x
1 Introduction 1
1.1 Outline of the Thesis………....5
2 Ecological Footprint 6
2.1 Definition of Ecological Footprint………..………….….6
2.2 Calculation Methods ……….……..…...….9
2.3 Ecological Footprint of Turkey………...……….13
3 Theoretical Background and Literature Review 16
3.1 Theoretical Background………..…16
3.1.1 Ecological Modernization Theory………16
3.1.2 Environmental Kuznets Curve………...19
3.1.3 Treadmill of Production Theory………...19
ii
3.1.5 Ecologically Unequal Exchange Theory…………22
3.2 Literature Review………29
4 Empirical Analysis 39
4.1 Data Set……….39
4.1.1 per Capita Ecological Footprint………..40
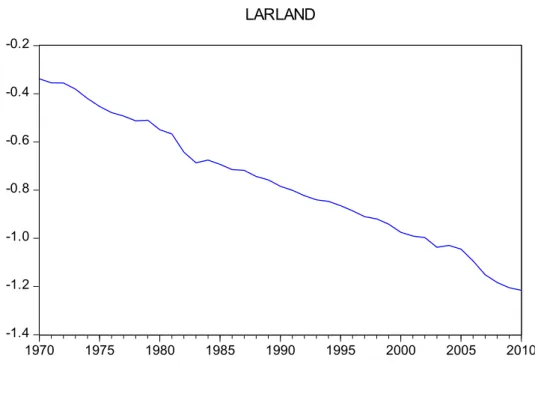
4.1.2 Arable Land per Capita………41
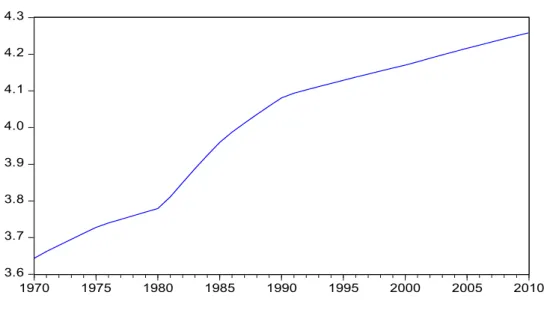
4.1.3 Urban as Population Percentage of Total Population…..…42
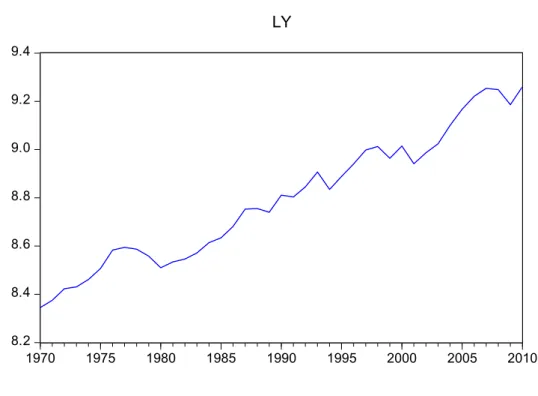
4.1.4 Gross Domestic per Capita………..……….42
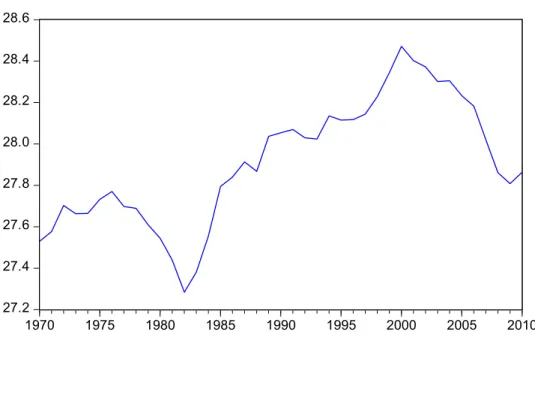
4.1.5 Military Expenditures as a Percentage of GDP………43
4.1.6 Weighted Export Flow Index………...………44
4.2 Methodology………46
4.2.1 Unit-Root Tests and Johansen-Juselius Cointegration Tests..47
4.3 Results and Discussion.……….……....48
4.3.1 Model 1………...………..49
4.3.2 Model 2 ……….………...50
4.3.3 Model 3……….…51
4.3.4 Model 4……….52
4.3.5 Vector Error Correction Models………..………53
4.3.6 Variance Decomposition………..54
iii
5 Conclusion 60
References 62 Appendix Countries Included Analysis 71
iv
ABSTRACT
ANALYSIS OF THE DETERMINANTS OF ECOLOGICAL FOOTPRINT IN TURKEY Ali Alper Alemdar
Master of Arts in Economics Advisor: Assoc. Prof. K. Ali Akkemik
February, 2015
This paper aims to investigate political economy factors which affect environmental degradation in Turkey. The investigation is based on environmental sociology theories and through assumptions of theories, I test validity of these theories for Turkey. The theories that I test are the environmental Kuznets curve, ecological modernization, treadmill of production and destruction, ecologically unequal exchange, and political economy of urbanization. I use time-series data for Turkey covering the period 1970-2010 and in order to see relationship between the effect of economic development, export density to developed countries, urbanization rate, military expenditure and the ecological footprint per capita of Turkey. I employ Johansen cointegration technique. There is a statistically significant and positive relation between economic development, urbanization with ecological footprint, and there is no evidence for ecologically unequal exchange theory, the environmental Kuznets curve and militarization.
Keywords: environmental sociology, ecological economics, ecological footprint
v
ÖZET
ANALYSIS OF THE DETERMINANTS OF ECOLOGICAL FOOTPRINT IN TURKEY Ali Alper Alemdar
Ekonomi, Yüksek Lisans Danışman: Doç. Dr. K. Ali Akkemik
Şubat, 2015
Bu çalışma Türkiye’deki çevresel bozulmanın arkasında yatan ekonomi politik faktörleri keşfetmeyi amaçlamaktadır. Bu araştırma çevre sosyolojisi teorilerine dayanmaktadır ve teorilerin varsayımları aracılığıyla, bu teorilerin Türkiye için geçerliliğini test etmektedir. Test ettiğim teoriler, çevresel Kuznets eğrisi, ekolojik modernleşme teorisi, üretim değirmeni, yıkımın değirmeni teorileri, ekolojik eşit olmayan değişim teorisi ve kentleşmenin ekonomi politiğidir. Metodolojik olarak, Türkiye için 1970 ve 2010 yılları arasını kapsayan zaman serisi kullanılarak, Türkiye’nin kişi başına düşen ayak izine, Türkiye’nin ekonomik gelişmişlik seviyesinin, gelişmiş ülkelere ihracat ağırlığının, kentleşme oranının ve askeri harcamaların etkisine bakılmaktadır. Bu etkilere bakmak için Johansen eş-bütünleşme tekniği analizi uygulanmıştır. Ekolojik ayak izine ekonomik gelişme seviyesi ve kentleşmenin pozitif etkisi bulunurken, çevresel Kuznets eğrisi, ekolojik eşit olmayan değişim ve askerileşmenin ile herhangi bir ilişki bulanamamıştır.
vi
Acknowledgements
First of all, I owe a great debt to my advisor, Assoc. Prof. Dr. K. Ali Akkemik and co-advisor Assoc. Prof. Dr. Özgür Orhangazi who always supported with their valuable ideas and critiques in every step of my thesis. Furthermore, I also thank Asst. Pof. Dr. Çağla Diner in my thesis committee for her support and Asst. Prof. Aslı Şen-Taşbaşı for giving me great inspiration for environmental and ecological studies. I was especially fortunate to work with Assoc. Prof. Mustafa Eray Yücel who assisted me a lot in the econometric part of my thesis. I thank my dear family, they have always supported me. Last, but not least, my special thanks go to Songül Ayaz who always supported encouraged and helped me in writing my thesis. I dedicate this thesis to these people.
vii
List of Tables
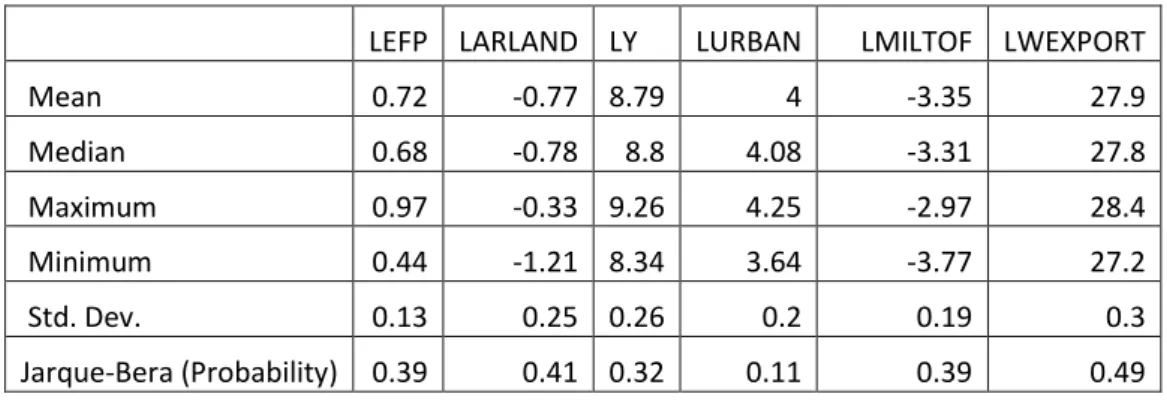
Table 4.1 Descriptive Statistics ... 40
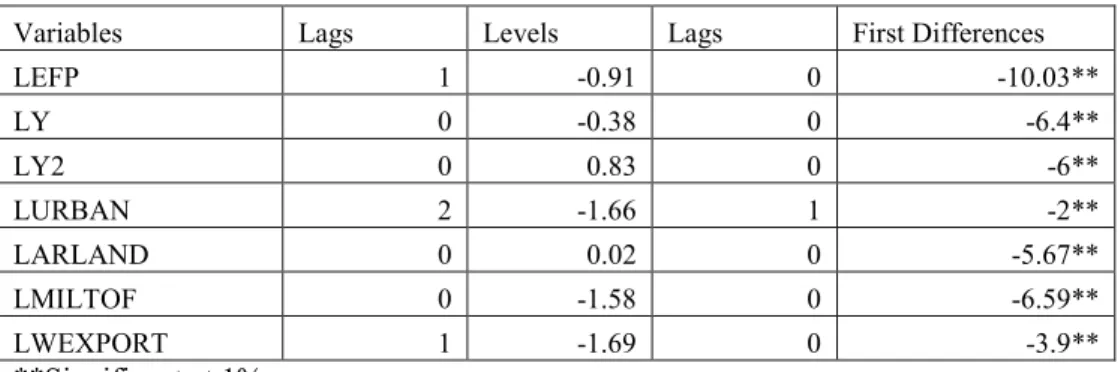
Table 4.2 Augmented Dickey-Fuller Unit Root Test for All Variables ... 48
Table 4.3 the Trace Test for Model 1 ... 49
Table 4.4 the Trace Test for Model 2 ... 51
Table 4.5 the Trace Tests for Model 3 ... 52
viii
List of Figures
Figure 2.1 Ecological Footprint and Biocapacity of the World ... 8
Figure 2.2 World Ecological Footprint Composition 1961-2010 ... 11
Figure 2.3 Biocapacity Reserves and Deficit per Country in 2010... 14
Figure 2.4 Trends of Biocapacity and Ecological Footprint of Turkey ... 15
Figure 4.1 Logged per capita Ecological Footprint against time ... 40
Figure 4.2 Logged per capita Arable Land against time ... 41
Figure 4.3 Logged percentage of Urban Pop. of Tot. Population against time……… 42
Figure 4.4Logged per Capita GDP against time ... 43
Figure 4.5 Logged military expenditures as a percentage of GDP against time ... 44
ix
Figure 4.7 Variance Decomposition for Model 1 ... 55
Figure 4.8 Variance Decomposition for Model 2 ... 55
Figure 4.9 Variance Decomposition for Model 3 ... 56
x
List of Abbreviations
CFC Chlorofluorocarbon CO Carbon Monoxide CO2 Carbon dioxide DCs Developed CountriesEFPP Ecological Footprint Per Capita EKC Environmental Kuznets Curve FDI Foreign Direct Investment FE Fixed Effect
GDP Gross Domestic Product GLS Generalized Least Squares IMF International Monetary Fund
IPCC Intergovernmental Panel on Climate Change LDCs Developing Countries
MNC Multinational Cooperation
NAFTA North American Free Trade Agreement NOx Generic term of the mono-nitrogen oxides
OLS Ordinary Least Squares
PM10 Atmospheric Particulate Matter
PPP Purchasing Power Parity
SIPRI Stockholm International Peace Research Institute SO2 Sulfur Dioxide
SPM Suspending Particular Matter TSCS Time Series of Cross Sections TURKSTAT Turkish Statistics Institute
UNCED United Nations Conference on Environment and Development VEC Vector Error Correction
xi
WDI World Development Indicators WTO World Trade Organization WWF World Wildlife Fund
1
Chapter 1
INTRODUCTION
The man’s massive exploitation of nature is not new; actually it is based on first human settlements and empires (Hornborg et al. 2007:27; Foster 1999:36). Sumerians, known as the cradle of civilization, had led to exploit regional environmental catastrophes that have in turn led to the fall of whole civilizations (Foster 1999:37). Furthermore, increasing size of the empires and centralization of power, for example the Roman Empire, had increased and spread environmental harm and natural resource extraction in Europe, Asia and Africa. Exploitation of forests, hunting and fishing, mining and metallurgy, pastoralism and agriculture were all conversion of core elements of the way of exploiting nature. The effects of these economic activities had been very dramatic for nature and ecological system. Disappearance of lions from Europe, tigers from Iran and Armenia and elephants, rhinoceroses, and zebras from North Africa, and on the other hand, landscape deterioration arising from abandoning olive trees from North Africa are the major examples of the early massive exploitation of nature by humankind (Hornborg, McNeill, Martinez-Alier, eds 2007:27).
Another case in environmental degradation is China almost around the same time with the Roman Empire. Hornborg et al. (2007:41) examine how land and habitat in South China changed dramatically in last two thousand years caused by
2
farming, immigration, and more significantly, exports of silk. In the two thousand year, the disappearance of tropical and semi-tropical forests was seen together with the reshaping of landscape according to commercial activities. As Hornborg et al. (2007:41) argue “A landscape in Guandong province that had been covered with
rice fields thus was re-worked under the demands of commerce into a new landscape, one that said ‘trade’ rather than ‘food’”. Between fifteenth and
seventeenth centuries, the relation between man and nature became more exploitative (Hornborg et al. 2007:123; Foster 1999:41). A case in point is the moving of silver mining in Central Europe to Central and South America which helps understand the origin of the modern world and high rate of environmental degradation in Central and South America. The main reason for moving silver mining is unstable cocktail of rapid commodification and agrarian revolts against this process. As we see in ecological modernization theory and ecologically unequal exchange theory, the core countries (the Western and Central European countries) wanted to protect their environment while transferring the externalities from mining and natural resource extraction. Up until the industrial revolution, the great transformation and capital accumulation started with European colonization for the greater part of the globe. Expansion of European colonization to the ‘New World’ (Asian, African and American countries) is explained by Foster (1999:41) as: “led to the extraction of
vast quantities of economic surplus-whether in the form of precious metals, such as gold and silver, or agricultural products, such as sugar, spices, coffee, tea, and many more—therefore to the social and ecological transformation of the colonized regions”.
With the industrial revolution, Western countries (specifically the Great Britain at the beginning) successfully accelerated GDP growth and expanded
3
massive production and consumption (Maddison 2005). As a consequence of the industrial revolution, production technique changed with the emerging new technologies and this caused the dissolution of previous economic and political institutions, and subsequently, the relation between man and nature. Growing cities, increasing production and consumption resulted in massive use of natural resources and drove more resource-extracting activities out of the Europe.
Environmental awareness in industrial countries started during the 1960s and 1970s. Local environmental movements gained momentum in these countries. The first major event was held in Stockholm in 1972. In this conference, ‘sustainability’ and ‘sustainable development’ topics were opened to discussion. Energy crisis in the 1970s, air and water pollution and destruction of ecosystems for timber, minerals and other concerns forced capitalist countries to consider future renewable energy resources more seriously and less environmentally destructive economic activities (Dunlap and Jorgenson 2012). In 1980, the term sustainable development was introduced and gained popularity after the publication of Our Common Future, also known as Brundtland Report (WCED 1987). Industrial production led to a concentration in greenhouses and other harmful gases for ozone layer, quickening the extinction of species, deforestation, the breakdown of biogeochemical cycles and natural resources extraction (Aşıcı 2012;; Spangenberg 2007). IPCC (1990) demonstrates the four sources of anthropogenic greenhouses gases as: energy, industry, agriculture and forestry. According to the calculations by IPCC Group I, in between 1980-1990 energy constitutes the largest proportion (46%) of greenhouses gases and industry, forestry, agriculture and others follow respectively.
4
High-level greenhouse gas in the air, natural resource exploitation and hazardous wastes at the global level compelled countries to find common solutions at some level. In 1992, Rio de Janeiro hosted the United Nations Conference on Environment and Development (UNCED). The aim of this conference was to find political solutions for environmental problems by mixing science and economics. The major objective in Rio was to stabilize the level of greenhouse gas in the atmosphere at a point that would prevent dangerous anthropogenic interference with the climate system. Such a level should be achieved within a time frame sufficient to allow ecosystems to adapt naturally to climate change, to ensure that food production is not threatened and to enable economic development to proceed in a sustainable manner (Meakin 1992). At the end of the conference, 27 principles were declared. These principles emphasize international cooperation, involving more civil society and following international laws in the solution pattern of environmental problems. Furthermore, United Nations set 10 millennium development goals for sustainability which also include environmental quality. The seventh goal is ‘Ensure Environmental Sustainability’ and it includes three targets (i) integrating the principles of sustainable development into country policies and programs and reverse the loss of environmental resources, (ii) reducing the proportion of people without sustainable access to safe drinking water and basic sanitation, (iii) significant improvement in the lives of at least 100 million slum dwellers which will be achieved in 2020. The first target has five indicators, namely the proportion of land area covered by forest, the ratio of area protected to maintain biological diversity to surface area, energy use (kg oil equivalent) per $1 GDP (PPP), carbon dioxide emissions per capita and consumption of ozone-depleting CFCs and proportion of population using solid fuels.
5 1.1 Outline of the Thesis
This thesis aims to investigate how anthropogenic activities affect the environment and the ecology through ecological footprint. This investigation focuses on Turkey for the period of 1970-2010. In order to discuss political ecology and policy suggestions, I test some environmental sociology hypotheses for the case for Turkey. These hypotheses are the environmental Kuznets curve, ecological modernization, treadmill of production, treadmill of destruction, ecologically unequal exchange. I employ the Johansen cointegration analysis to investigate the association between environmental degradation in Turkey and various indicators. I use ecological footprint per capita (EFPP) as an environmental indicator to measure the effect of human activities to nature. EFPP is used by several studies as an environmental impact and sustainability indicator by these hypotheses (Jorgenson 2003, 2005, 2006, 2009; Jorgenson and Burns 2007; Jorgenson and Clark 2009, 2012; Jorgenson and Rice 2007, 2012). In chapter 2, there are definitions and calculation methods of ecological footprint. Furthermore, brief information about ecological footprint analysis and trends in the world and Turkey are also provided. In the third chapter, hypotheses are explained with the underlying assumptions and criticisms. In addition, chapter 3 provides a review of the literature including previous empirical studies with relevant theories. Chapter 4 is the empirical part of the study. In this chapter, I explain the methodology, the data set and present the estimation results. Finally, in the conclusion, I evaluate the relevant theories with results and provide final remarks and ideas for rethinking environmental problems we face.
6
Chapter 2
ECOLOGICAL FOOTPRINT
2.1 Definition of Ecological Footprint
Since the term ecological footprint was established, it became an important environmental indicator (Wackernagel and Rees 1996). Footprints have been calculated for nations, regions, cities and as well as at the global level (Global Footprint Network 2000; Loth 2007; Mcdonald and Patterson 2004; Simpson et al. 2000; Wackernagel 1998). Wackernagel and Rees (1996) and Rees (2000) define ecological footprint as “how much biologically productive land and water area an
individual, a city, a country, a region, or humanity uses to produce the resources it consumes and to absorb the waste it generates, using prevailing technology and resource management”. Global hectares are used to express the ecological footprint.
Wackernagel et al. (2007) mention that a global hectare is a hectare that is normalized to have the world average productivity of all biologically productive land and water in a given year. Because of international trade and the dispersion of wastes, hectares demanded can be physically located anywhere in the world.
Many studies use ecological footprint as a ‘sustainability’ indicator. McDonald and Patterson (2004) show that there are two reasons to make the ecological footprint as a sustainability indicator. First, ecological footprint measures the ecological cost (in land area) of supplying all goods and services to a human population. This recognizes that people not only directly require land for agricultural production, roads, buildings and so forth, but that land is indirectly embodied in the goods and services that people consume. In this sense, the footprint can be used to make visible the ‘hidden’ ecological cost of an activity or population. Secondly,
7
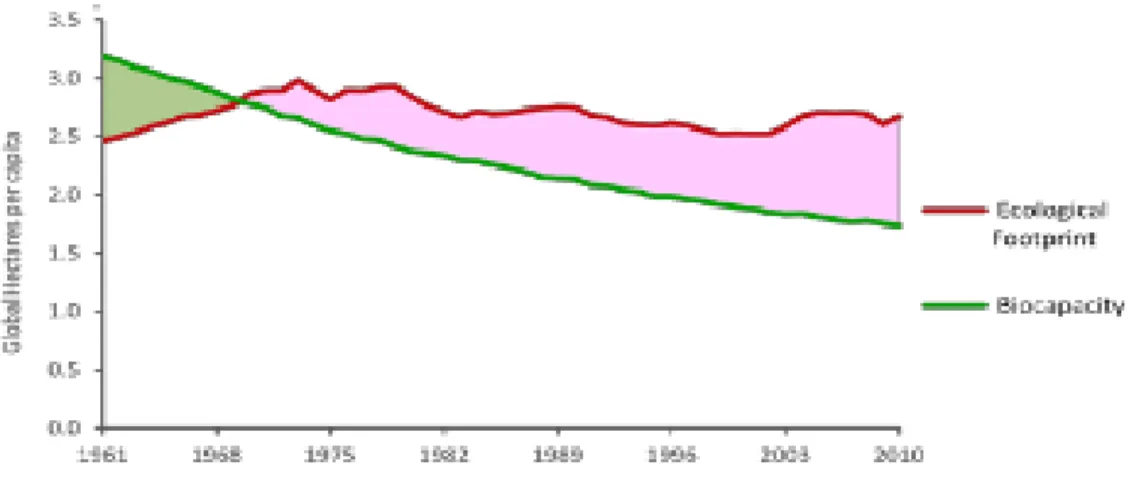
ecological footprint invokes the idea of carrying capacity. ‘Carrying capacity’ in ecology is the maximum population a given land area can support indefinitely. For example, a certain number of hectares are required to support cattle. If the number of cattle exceeds their carrying capacity then the population is said to be in ‘overshoot’. Resources will become scarce and population die-back will occur. If it is applied to human societies, using more biologically productive land than is available within borders result in ‘overshoot’, or in other words, ‘ecological deficit’. In ecological footprint language, ecological arises when ecological footprint of a region, city, country or globe exceeds the available biocapacity. Figure 2.1 illustrates the World’s ecological footprint and biocapacity trend from 1961 to 2010.
8
Figure 2.1 Ecological Footprint and Biocapacity of the World 1961 to 2010
Source: Available online at www.footprintnetwork.org
Weckernagel et al. (2007) define biocapacity as “Biocapacity or biological capacity is the capacity of ecosystems to produce useful biological materials (meaning of ‘useful’ usually changes over time) and to absorb waste materials generated by humans using current management schemes and extraction technologies. Like the ecological footprint, biocapacity is expressed in units of global hectares and is calculated for all biologically productive land and sea are on the planet. Biologically productive area is land and water (both marine and inland) area that supports significant photosynthetic activity and biomass accumulation that can be used by humans. Nonproductive and marginal areas such as arid regions, open oceans the cryosphere, and other low productive surfaces are not included.”
There are several methods developed for calculating of ecological footprints –e.g., Wackernagel and Rees (1996), Folke et al. (1997), Bicknell et al. (1998), Wackernagel et al (1999), Loth (2000), van Vuuren and Smeets (2000), and Ferng
9
(2001). I present Wackernagel and Rees’s (1996) calculation method, because the ecological footprint data of this thesis is calculated by using this method.
2.2 Calculation Methods
Wackernagel and Rees’s (1996) calculation method is based on construction of a ‘consumption by land use’ matrix for a given population (McDonald and Patterson 2004). The consumption land use matrix includes six types of land according to the corresponding consumption pattern. These major land use types in ecological footprint accounting are cropland, grazing land, fishing grounds, forest area, built-up land and carbon land. Before going into details about those types of use land, there is need to explain the fundamental assumptions of ecological footprint accounting.
The first assumption is that the majority of the resources people consume and the wastes they generate can be tracked. The second assumption argues that most of these resource and waste flows can be measured in terms of the biologically productive area necessary to maintain flows. The third assumption states that by weighting each area in proportion to its bioproductivity, different types of areas can be converted into a common unit of global hectares, hectares with world average bioproductivity. Fourthly, as a single global hectare presents a single use, and all global hectares in any single year represent the same amount of bioproductivity, they can be added up to obtain an aggregate indicator of ecological footprint or biocapacity. The fifth assumption is that human demand, expressed as the ecological footprint, can be directly compared to nature’s supply, biocapacity, when both are expressed in global hectares. The last assumption is the overshoot situation, where
10
ecological footprint exceeds available biocapacity (Wackernagel et al. 2002; Wackernagel et al. 2007).
An important component of ecological footprint calculation is major land use by type. There are five biocapacity components and six footprint components (carbon land is not explicitly set aside). These major land use types are: Cropland, grazing land, fishing ground, forest area, built-up land and carbon land which are explained briefly below (Wackernagel and Rees 1996; Wackernagel et al. 1999; Wackernagel et al. 2002; Wackernagel et al. 2007).
Cropland: Growing crops for food, animal feed, fibre, and oils requires cropland, the land type with the greatest average bioproductive per hectare.
Grazing Land: Raising animals for meat, hides, wool, and milk causes using of feed products grown on cropland, fishmeal from wild or farmed fish and/or range land area for grazing.
Fishing Grounds: It includes productive freshwater and marine fishing which are required by harvesting fish and other marine products. Marine areas outside continental shelves are currently excluded from ecological footprint accounts.
Forest Area: This type of land indicates natural and plantation forests that are used in harvesting timber products and fuelwood (products-sawnwood, wood-based panels, paper and paperboard, and wood pulp).
Built-up Land: This land is occupied by infrastructure for housing, transportation, and industrial production. Areas occupied by hydroelectric dams and reservoirs, used for the production of hydropower, are also counted as built-up land.
11
Carbon Land: The ecological footprint of fossil fuel consumption is calculated by estimating the biologically productive area needed to assimilate this waste product of the human economy. Figure 2.2 illustrates the portion of land use types in the ecological footprint of the world 1961 to 2010.
Figure 2.2 World Ecological Footprint Composition (1961 – 2010)
Source: Available online at www.footprintnetwork.org
In ecological footprint accounting, there are some activities currently excluded. Wackernagel et al. (2007) explain the reason why these activities are excluded as follows: “These activities include the release of materials for which the biosphere has no significant assimilation capacity (e.g., plutonium, PCBs, dioxins, and other persistent pollutants) and processes that damage the biosphere’s future capacity (e.g., loss of biodiversity, salination resulting from cropland irrigation, soil erosion from tilling).”
12
Wackernagel and Rees’s model of ecological footprint is calculated by Global Footprint Network for every year. Global Footprint Network has also improved National Footprint Accounts and the ongoing Footprint Standards processes. In the calculation, a nation’s footprint of consumption equals that nation’s footprint of primary production plus imports plus stock changes minus exports. This calculation represents the apparent consumption of biological capacity within a country.
The National Footprint Accounts include more than 200 resource categories such as crop products, fibres, livestock, wild and farmed fish, timber and fuelwood. The accounts also explicitly track one major waste product - carbon dioxide. Demand for resource production and waste assimilation rate are translated into global hectares by dividing the total amount of a resource consumed by the global average yield of the land type producing that resource. This magnitude is multiplied by the appropriate equivalence factor to express the total demand in global hectares for each resource consumed. Furthermore, manufactured or derivative products are converted into primary product equivalents for the purpose of ecological footprint calculation (Wackernagel and Rees 1996; Wackernagel et al. 2002; Wackernagel et al. 2007). A given products’ ecological footprint for a country is the calculated as follows:
Ecological_ Component =Production + Import – Export / Yield.
Ecological footprint is measured by a single measurement unit. In order to convert into a single measurement unit, global hectares, accounting normalizes different types of areas to account for differences in land and sea productivity. Equivalence factors and yield factors are used for this purpose. Equivalence factors convert a specific type of land into a universal unit of biologically productive area, a global hectare. Yield factors take into account the difference in production of a given
13
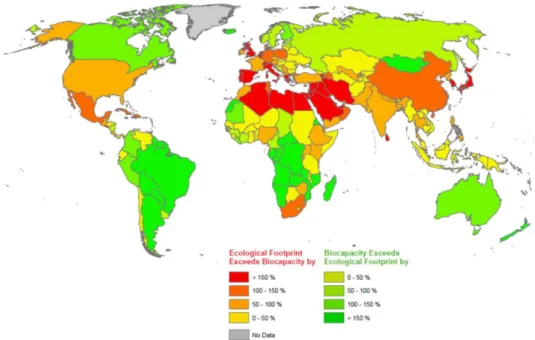
land type across different nations (tons of meat per Turkey or Greece hectare vs. world average) (Wackernagel et al. 1999; Jorgenson 2009). By these calculations and factors, we obtain three important terms, namely, ecological deficit, ecological reserve and ecological debt. An ecological deficit is defined by ecological footprint of a population exceeding the available biocapacity of that population’s territory in a given year. This holds for nations, cities, regions and world. Ecological reserve represents the opposite situation. A population with an ecological footprint smaller than their available biocapacity has an ecological reserve. Ecological debt is the sum of annual ecological deficits that accumulate over a certain period of time. Planet years are the numeric expressions of ecological debt. According to Wackernagel et al. (2007), our planet entered into overshoot since the 1980s. One planet-year equals the total productivity of useful biological materials by the Earth given a year (Wackernagel et al. 2007). Biocapacity reserves and deficit per countries in 2010 is illustrated in figure 2.3.
2.3 Ecological Footprint of Turkey
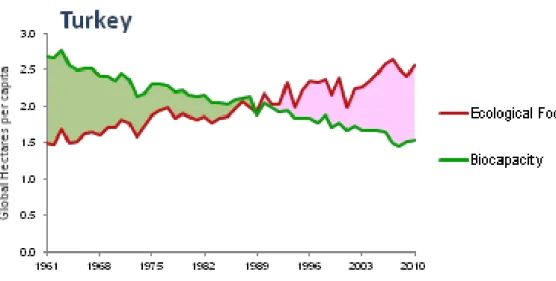
The most recent measurement of Global Footprint Network for Turkey is 2.5 per capita ecological footprints in 2010 (see www.footprintnetwork.org). In depth analysis for Turkey is reported by Türkiye’nin Ekolojik Ayak İzi Raporu (2012). In this report, components and trends in ecological footprint in Turkey are illustrated. According to this report, personal consumption generates 82% of total ecological footprint in Turkey. This implies that the main driver of Turkey’s ecological footprint is consumption. Additionally, imports seem to be an important component of footprint of Turkey as it occupies 20% of footprint of goods and services. Among ecological footprint components of Turkey, carbon has the highest share with 46% in 2007 followed by cropland (35%), forestland (11%), grazing land (3 %) , built-up
14
land (3%) and fishing land (2%) (Global Footprint Network, WWF Türkiye 2012). Figure 2.4 shows Turkey’s ecological footprint and biocapacity trends in terms of global hectares per capita 1961 to 2010.
Figure 2.3 Biocapacity Reserves and Deficit Per Country in 2010
15
Figure 2.4 Trends of Biocapacity and Ecological Footprint of Turkey (1961 -2010)
16
Chapter 3
THEORETICAL BACKGROUND AND LITERATURE REVIEW
This chapter presents fundamental assumptions of hypotheses and reviews previous studies with a similar focus as in this thesis. There are numerous studies which contain theories that I discuss as well. Some of the reviewed studies investigate all these theories in the same paper, but the majority of them focus on specific theories separately.
3.1 THEORETICAL BACKGROUND
Various theories in the past aimed to explain the sources of environmental degradation from different perspectives. While the concept of ecological footprint is very recent, such theories can be utilized to explain the sources of ecological footprint as well. Below I list and elaborate on some of the influential theories which are closely related to ecological footprint.
3.1.1 Ecological Modernization Theory
Ecological modernization theory takes post-industrial modern societies as a potential solver of environmental problems. These societies have advanced levels of technological and industrial development to solve environmental problems. According to the theory, collaboration between civil society, government and industry can solve environmental problems by creating green economy. Ecological modernization theory sees economic growth as a starting engine for solving environmental problems. Spaargaren and Mol (1992) explains that: “Economic
17
growth and technological development, two important institutional traits of modernity, are therefore seen as compatible with and sometimes even as a condition for sustaining the sustenance base, rather than as the main cause of environmental destruction”. Economic growth and technological development via institutional reforms are main components of the solution of environmental problems from the perspective of ecological modernization theorists. Ecological modernization theory also suggests political programs for governments and that makes ecological modernization theory more institutional. Buttel (2000) argues that ecological modernization is a social theory for two reasons. First, more advanced and sophisticated versions of ecological modernization theory provide great political ability to apply private eco-efficiencies and overall environmental reforms. Second, the logic of ecological modernization theory is related with embedded autonomy, civil society, and state- society synergy theories in political sociology. In ecological modernization theory, politically liberal and economically neo-liberal ideology is dominant (Buttel 2000; York, Rosa 2003). The theory also advocates that economies still should lead by private sector but with eco-regulations. Furthermore, belief in technology that increases efficiency in production and decreases input use is the crucial component of ecological modernization theory. However, Jevons’ Paradox ([1865] 1965) steps in to illustrate the paradox between increasing efficiency and increasing material consumption. Systematic and theoretical criticism on ecological modernization theory comes from Schnaiberg (1980) with ‘treadmill of production’. Treadmill of production theory’s discourse and claims run counter to ecological modernization theory and assert that increasing efficiency or technological development bring more material consumption with economic growth. Moreover, in an important empirical study Matthews et al. (2000) found no evidence of an
18
absolute reduction in resource throughput in any of the countries studied. On the contrary, total quantities of conventional wastes, emissions, and discharger increased by between 16 percent and 29 percent in Austria, Germany, Japan, the Netherlands, and the United States from 1975 to 1996. In addition, York and Rosa (2003) criticize ecological modernization theory at four perspectives: (1) failure of ecological modernization theorists to interpret the theoretical expectation connecting emergent institutions of modernity with genuine environmental reform, (2) limitations case studies, (3) eco-efficient improvements can occur in one industry, however this industry may affect other industries’ increasing material consumption, (4) Jevons’s paradox, which means that efficiency does not make lesser consumption and waste production.
There are a number of critics of ecological modernization theory. I think the most consistent criticism belongs to O’Conner (1994) who argues that sustainable capitalism is impossible. Because growth is based on expansionist structure of capitalism, more consumption and waste production will occur. As Magdoff and Foster (2010) conclude, capitalism is a system that must continually expand, in constant search for new sources of raw materials, cheaper labor and new markets. Through this logic, it is highly questionable for ecological modernization theory to sustain capitalism.
Ecological modernization theorists believe that countries such as the Netherlands, Germany, and Sweden can apply the suggestions of ecological modernization theory, just because these countries are superior in technology, economy and civil society. In conclusion, ecological modernization theory advocates that even capitalism creates environmental problems; these problems can be solved
19
in capitalism by more economic growth, environmental state, technological development and civil society.
3.1.2 Environmental Kuznets Curve
The environmental Kuznets curve (EKC) hypothesis concerns the relation between income and environmental degradation or environmental harms. In the EKC, environmental damage first increases with income and then declines. This illustrates the inverted U-shape relation between income or economic growth and different types of environmental damages. The EKC hypothesis believes that after reaching a certain income level, the level of environmental damage will be smaller (Stern 2004). The perspective of the EKC hypothesis is a reductionist and does not assert the certain reasons of inverted U-shaped relation. Ecological modernization theory can explain issues that EKC do not explain with ecological modernization theory’s policy suggestions. As summarized in the literature review section, there are different environmental indicators which can be used in EKC analysis. In this study, I use ecological footprint per capita as the relevant environmental sustainability indicator.
3.1.3 Treadmill of Production Theory
Treadmill of production theory argues that the expansion of production to maintain profit cannot be sustainable environmentally in a world with limited resources. Capital accumulation and profit are main engines of capitalism and capitalists seek ways to expand their production to accumulate capital and make profit. In contrast to ecological modernization theory which assumes that
20
technological development and economic growth are solutions to environmental problems, according to treadmill of production theory, both technological development and economic growth cause more environmental degradation, because more investment and demand lead to depletion of resources and add waste to nature (Schnaiberg 1980; Jorgenson 2011). In treadmill of production, individual capitalists and states accumulate and absorb capital for survival and both accumulation and absorption are part of environmental degradation. Beside that we can include energy-intensive services as well (transportation, marketing). Treadmill of production theory specifically focuses on treadmill of destruction by the state.
How the state absorbs capital accumulation is the main question of the theory. Schnaiberg (1980) is highly influenced by Baran & Sweezy’s (1968) Monopoly of Capital and developed ideas about the absorption of surplus by monopoly and state.
Schnaiberg (1980) pays a great deal of attention to monopoly capitalism. He points out that monopoly capitalism is the engine of the expansion in production. He constructs schematic device to comprehend the reasons behind production expansion and the expansion of the share of production in monopoly capitalism over time as well as increasing capital-intensive production. Profit-driven dependency of the structure of treadmill of production in monopoly capitalism speeds up treadmill and this involves increased environmental withdrawals and additions. Three major features of the treadmill are the role of labor force growth, technological choices and capital intensification of production. For example, he measures the effect of labor force growth on environmental degradation as follows:
21
Environmental degradation = Number of producers × Average workforce × Capital per worker × Production per unit capital ×
Average withdrawals and additions per unit product
Schnaiberg (1980) concludes that the environmental problems are mainly caused by disorganization of production and production reforms are needed to solve environmental problems.
3.1.4 Treadmill of Destruction Theory
Treadmill of destruction theory is a sub theory of treadmill of production theory. This theory specifically focuses on the effects of militarism on environment. York (2008) states that even if only warfare seems to affect the environment harmfully, military institutions, technologies, and behaviors can also produce ecological impacts. From the treadmill of destruction perspective, in armed conflicts it is necessary to consume considerably large amounts of nonrenewable energy and other resources to sustain their overall infrastructures and hardware (Jorgenson and Clark 2009). For ecological impacts, mass amount of fossil fuels consumption and the resulting greenhouse emissions are the most important factors in treadmill of destruction theory. In conclusion, treadmill of destruction theory draws attention to warfare consequences as chemical contamination of ecosystems and devastation of landscapes that result directly from military weaponry plus military campaigns consume enormous amounts of fossil and nuclear fuels in planes, ships, and tanks (Jorgenson et al. 2010).
22 3.1.5 Ecologically Unequal Exchange Theory
While political economy studies conflicts about economic distribution, political ecology studies as studying ecological distribution conflicts (Hornborg 1998). At that point, ecologically unequal exchange brings a new perspective to the relation between nations and nature in terms of commodities and materials. As a starting point, it is helpful to discuss the terms of unequal exchange as the deep historical background contributes to the broader theoretical perspective. Unequal exchange problem in the world system was important for classical economists (Smith, Ricardo, J.S. Mill and Marx) who wrote extensively about colonialism and conditions in the third world. From liberal economists’ perspectives such as Smith, Ricardo and Mill, the criticism of colonial practices was part of a general theoretical defense of free trade (Foster and Holleman 2014). Interestingly, unequal exchange theory was originally and involuntarily developed by Ricardo with his comparative advantage theory. This famous theory postulates that in the existence of two products and two countries, each country specializes in the product that it produces more efficient and they trade with each other according to their comparative advantages. In this theory, labor and capital are immobile (Foster and Holleman 2014). Marx ([1863-65] 1981: 345) as a representative of classical radical political economists, analyze this trade differently from his liberal colleagues in the Capital. Marx argues that there is a flow of ‘surplus profit’ from poor countries to rich countries. Thanks to this ‘free trade’, rich countries can receive cheaper labor commodities. According to Marx, colonialism was the dominant ideology and colonized countries were free to be highly exploited through the use of slaves and coolies. Marx did not have chance to write about unequal exchange theory in the international arena. However, Foster and Holleman (2014) point to the Austrian Marxist Otto Bauer as the best descriptive
23
of Marxist way of unequal exchange theory. Bauer ([1924] 2000) argued about unequal exchange theory:
“The capital of a more highly developed region has a higher organic composition, which means that in this more advanced area a larger quantity of constant capital corresponds to the same size of wage fund (variable capital) than in the backward area. Now Marx has taught that owing to the tendency to equalization of the rate of profit, it is not the labor of each of the two areas respectively that produces the surplus value taken by each area’s capitalists: the totality of the surplus value produced by the workers of both areas will be shared between the capitalists of those two areas not in proportion to the amount of labor contributed in each but in proportion to the amount of capital invested in each. Since in the more highly developed area there is more capital to the same amount of labor, this area appropriates a larger share of the surplus value than would correspond to the amount of labor it has contributed…. Thus, the capitalists of the more highly developed areas not only exploit their own workers but also appropriate some of the surplus value produced in the less highly developed areas. If we consider the prices of commodities, each area receives in exchange as much as it has given. But if we look at the values involved we see that the things exchanged are not equivalent.”
As Lenin (1939) named the highest stage of capitalism as imperialism, unequal exchange between rich and poor countries offer a theoretical perspective to this study.
There are two visible types of unequal exchange relation between the developed countries and the developing countries in a world-system. The first one involves importing raw materials from the developing countries to developed countries to increase consumption diversity, and it additionally secures natural resources and environment from degradation while the developing world faces the extreme level of natural resources extraction, low level of consumption. Secondly, when MNCs shift industrial operations to the developing world this generates
24
pollution and low environmental quality in developing countries. In both ways, carrying capacity are appropriated from the developed from the developing countries by transferring (‘distancing’) the developed countries hazards or anti-wealth to the developing and importing natural resources from the developing countries (Frey 2003; Muradian and Martinez-Alier 2001).
Similar to unequal exchange theory, which emphasizes the exchange of more labor for less, ecologically unequal exchange theory stresses the exchange of more ecological use value (or nature’s product) for less. Two important bodies of work have emerged in sociology addressing ‘ecological imperialism’ (Foster and Clark 2009; Foster and Holleman 2014): Metabolic rift analysis and studies of ecologically unequal exchange. The first tradition is based mostly on Marxist perspective and is derived from important contributions by Foster (1999), (2000), More (2000), (2011a), Burkett (2009), (2014), Clausen (2007), Wittman (2009), Foster et al. (2010), Schneider and MicMicheal (2010), Gunderson (2011), and Dobrovolski (2012). However, metabolic rift analyses are out of scope of this study. Instead, a detailed analysis of ecologically unequal exchange theory is utilized.
This thesis discusses the ecologically unequal relation between developed and developing nations. Ecologically unequal exchange theory has deep roots in the World System Theory, which was developed by Wallerstein (1974), and ecological economics. This theory incorporates the ecological perspective to material relations between the developed north and the developing south. According to this theory, there is a vertical and asymmetric exchange relation between the core and periphery countries and this relation yields economic and ecological advantages to core countries (Bunker 1985; Hornborg 1998; 2006; Jorgenson 2009; Jorgenson and Rice
25
2005; 2007; Jorgenson and Clark 2009; 2012). This unequal exchange relation can be explained in more detail as follows: core developed countries do not want to extract and consume their raw materials and natural resources in their own lands. They, instead, import them from the developing countries, and transform those imported raw materials into industrial and high-valued-added commodities and export them to the developing countries. Core countries can accumulate more capital and externalize the externalities created raw material extraction during this process. Comparatively, core countries save their natural resources and labor time by trading with the developing world (Rice 2009). Jorgenson and Rice (2005) argue that this asymmetrical relationship is regulated by international trade wherein the structure of export increases the material consumption options for the industrialized developed while the non-industrialized developing is suppressed in extracting natural resources.
Historically, Foster and Clark (2009) argue that the exploitation of natural resources of the periphery has long been an important propulsive force for primitive accumulation in the developed countries. Therefore, this historical advantage provides industrial economies flexibility and adaptability while extractive economies become rigid, inflexible, and vulnerable to the shifting demands of transnational capital accumulation (Rice 2009). Furthermore, Bunker (1985) in his study on Amazons showed that high level natural resource extraction and flows to developed European countries provides great advantages for developed countries. Muradian and Martinez (2001) traumatically elucidate this situation in contemporary modern economic world as follows:
“At the global level, there is a clear flow of primary commodities from poor to rich countries. Developed countries consume the majority (two-thirds) of all primary
26
commodity exports and these kind of products account for the majority of export earnings in the third world. Clearly, the Third World is specialized in exploitation of natural resources. Specialization in resources – intensive or environment-intensive products (especially those with low income elasticity) may generate a ‘specialization trap’. When the economic activity is based on non-processed products, attempts to increase earnings need either an agreement among exporters, which is difficult to organize, or an increase in supply, which produces a downward pressure on prices and deterioration in terms of trade.”
The specialization trap does not only worsen the terms of trade of the developing countries, it also worsens their ecological system and natural resources. If material flows from, the developing to developed is conceptualized into ‘ecological flows’, the developed countries seem as net importers of primary goods and raw materials, broadly polluting sectors, and they can have an ‘ecological deficit’ especially vis-à-vis developing countries (Muradian and Martinez 2001; Muradian et al. 2002).
The ecologically unequal exchange theory aims to investigate what is really exchanged between nations. Hornborg (2014) develops a concept of ecologically unequal exchange as follows:
“Advanced technologies exist on account of the very discrepancy between flows of money and flows of matter –energy, i.e. between economics and physics, and thus to show that theorization of “ecologically unequal exchange” is inextricably connected to understandings of technological progress.”
27
Hornborg (2014) claims that the exchange is controlled by a technological system and adds in fact asymmetric flows of embodied human time and embodied natural space between sectors where these assets are differently priced. Uneven technological growth must be viewed as an index of unsustainable resource dissipation and unequal exchange for his conception. Another perspective in conceptualization is the unequal exchange theory with a focus on ecological footprint (Jorgenson 2006, 2010; Rice 2007; Jorgenson et al. 2009; Jorgenson and Clark 2009, 2012). In this analysis, the developed countries with higher ecological footprints than developing countries do not extract ecologically costly materials or produce them massively. Rather, they import those from developing countries. This causes more consumption for developed countries and larger footprint and more environmental degradation with fewer footprints in developing countries. I also employ this analysis to test ecologically unequal exchange theory in this study.
The last study of interest is Odum’s theory of unequal exchange. Odum (1995) uses the second law of thermodynamics which is also known as entropy and develops in his analyses the term ‘emergy’ to measure real wealth. Odum (1995) explains it follows:
“In 1983, the term EMERGY, spelled with an ‘M’, was suggested by David Scienceman for our concept [of embodied energy] and emjoule or emcalorie as the unit… Emergy is defined as the energy of one kind required directly and indirectly to produce a service or product… For example, the production of green plants can be expressed in solar emjoules, which includes the solar energy required to make all the inputs to the plant, such as rain, wind, nutrients, cultivation efforts, seeds, and so forth”.
28
Developed and developing countries channel all their labor force and natural resources into specific production or services to catch up with developed countries. However, most developing countries require capital to realize this process and they usually meet this demand by inviting foreign capital. On the other hand, it is generally argued that capital seeks profitable environments and does not want to face too many regulations in an economy, particularly with regards to labor and environment. These capital inflows from developed to the developing is usually undertaken by Multinational Corporations (MNCs). MNCs tend to shift their investments from developed to developing, because of the newly designed environmental regulations in core countries which increase cost of production. To ensure the continuity of foreign capital inflows, countries do not generally regulate their economies with ecology and labor biased rules (Frey 2003). Frey (2003) emphasizes the importance of international trade agreements and organizations that help MNC investments stay profitable in the developing countries through free-trade agreements and other deregulative laws put in place in the developing countries. For example Frey’s (2003) study on the environmental effects of the export processing zones in the northern part of Mexico shows that MNCs operations from the developed north in countries deregulations of certain limits cause great environmental, human health and social damages. In addition, Frey (2003) also emphasizes how IMF and World Bank forced peripheral countries to pursue export-oriented policies in an effort to attract industry from the developed countries.
29
3.2 A LITERATURE REVIEW OF EMPIRICAL STUDIES ON ENVIRONMENTAL THEORIES
This section reviews a selected list of the previous studies on environmental theories. Specifically, I review the studies that test one or several of the theories explained in the previous section. I first illustrate cross-county studies which are related to environmental sociology. Then, I review the empirical studies in the EKC literature.
Jorgenson and Burns (2007) test a series of hypotheses to examine political economic causes behind changes in per capita consumption-based ecological footprint. Their data cover the period 1991-2001 for 138 countries. The dependent variable is per capita ecological footprint of countries. Independent variables are GDP per capita, exports of goods and services as percentage of total GDP, urban population as percentage of total population, manufacturing as percentage of total GDP, services as percentage of total GDP, domestic income inequality measured as Gini coefficient, and state environmentalism. Their findings illustrate that the level of economic development increases per capita ecological footprint and that, export dependence is negatively related with growth in per capita footprints. Further results reveal that the effect of urbanization is insignificant, manufacturing intensity is inversely related to growth in per capita ecological footprint and service intensity is positive. Finally, agriculture intensity and state-environmentalism are statistically insignificant. The positive and statistically significant relation between GDP per capita and per capita ecological footprint support treadmill of production theory for this study. On the other hand, the assumption of ecologically unequal exchange theory, export dependence theory, and world-systems theory is negative relation
30
between export dependency and per capita ecological footprint. The negative and statistically significant relation between export dependency and per capita ecological footprint support these three studies.
Jorgenson and Clark (2009) discuss different theories related to the political economy framework to examine the structural predictors of per capita ecological footprints of nations. This study investigates similar theories with Jorgenson and Burns (2007), but in different time period. In addition to Jorgenson and Burns (2007), this study also tests treadmill of destruction theory and the environmental Kuznets hypothesis. The data of the study cover period 1975-2000 for 53 developed and less-developed countries. The dependent variable is per capita ecological footprint of nation. The independent variables are GDP per capita, the quadratic form of GDP per capita and military expenditures per soldier. Furthermore, two weighted export indexes are used to examine the validity of ecologically unequal exchange theory. The first one quantifies the relative extent of a country’s exports to more-developed countries. The second one measures the relative extent of a country’s exports to militarily more powerful nations. The results show that the effect of urban population on per capita footprint is statistically significant and positive, contrary to Jorgenson and Burns (2007). It means that urbanization has positive effect on ecological footprint. Their findings contradict with ecological modernization theory and environmental Kuznets curve. Because, ecological modernization posits negative relation between economic development and ecological footprint, two weighted index are found statistically significant and negative with per capita ecological footprint which satisfy the main assumption of ecologically unequal exchange theory, and military expenditures are positively related with per capita ecological footprint. This positive relation between military expenditures and per capita
31
ecological footprint supports treadmill of destruction theory for this study. Finally, the positive relation between GDP per capita and ecological footprint per capita shows the evidence of treadmill of production theory.
Jorgenson and Clark (2011) aim to investigate similar theories in Jorgenson and Burns’s (2007) and Jorgenson and Clark’s (2009) studies. They obtain data for 65 countries for the period 1960 to 2003. The dependent variable is per capita ecological footprint of nations and the independent variables are GDP per capita, arable land per capita, urban population, the square GDP per capita, military personnel as percent total population, military expenditures as percent total GDP, export weighted index1, and the percentage shares of manufacturing and services in GDP. The results show that both the level of economic development and its square are statistically significant and positively affect per capita footprint of nations. These results support treadmill of production theory and contradict with ecological modernization theory and environmental Kuznets curve. Finally, their findings also illustrate that military personnel as percent total population and military expenditures as percent total GDP are statistically significant and positive, and weighted export index is statistically significant and negative. The positive relation between militarization and ecological footprint proves the validity of treadmill of destruction theory and the negative relation between weighted export index and ecological footprint supports ecologically unequal exchange theory. Jorgenson and Clark (2011) find same results with Jorgenson and Burns (2007) and Jorgenson and Clark (2009). Jorgenson and Clark (2011), Jorgenson and Burns (2007), and Jorgenson and Clark
1 Weighted Export Index quantifies the relative extent to which a nation’s exports are sent to
32
(2009) test same theories with similar or different variables in different periods of years and all studies conclude same results except urbanization’s effect.
These three studies test multi-environmental theories. In addition to them, I review three studies which focus on ecologically unequal exchange and treadmill of destruction theories. Ecologically unequal exchange demonstrates that the export dependency of developing countries to developed countries decreases their domestic consumption and it causes a negative relationship between export and ecological footprint in developing countries. Treadmill of destruction theory asserts the relation between militarization and environmental degradation.
Jorgenson and Rice (2007) argue that the less-developed countries with higher levels of exports to the more-developed countries exhibit lower domestic levels of resource consumption. They obtain data for the years 1980 to 2000 and less developed countries which are selected according to World Bank income classification in 2000. The dependent variable is combined ecological footprint per capita in 2000 and the independent variables are weighted export flows in 1990, GDP per capita, GDP per capita change (1980 to 1990), urban population in 1990, domestic income inequality measured by Gini coefficients, secondary school enrollment in 1990, services as percentage of total GDP in 1990, export partner concentration in 1990 measured by the percentage share of total exports to the single largest importing country. Their results demonstrate that export dependency of less developed countries causes less ecological footprint. The other results show that the level of economic development positively affects per capita footprints while the effect of the rate of development is statistically insignificant. In addition, the level of urbanization positively affects per capita footprints in some models, but becomes
33
insignificant when services and export partner concentration are additional controls. The study concludes the existence of ecologically unequal exchange between less developed countries and developed countries.
Jorgenson (2009) also tests the unequal exchange theory. The study uses six observations from 66 lower-income countries for years between 1975 and 2000. The study uses per capita ecological footprint as the dependent variable and a set of key independent variables including the weighted export index for low income countries exports to high income countries for a specific time point (i.e., 1975, 1980, 1985, 1990, 1995, and 2000). According to the results, the effect of weighted export flows is negative and statistically significant. These findings confirm the existence of ecologically unequal exchange between low income countries and high income countries.
Jorgenson (2010) investigates ways of developed countries to treat less developed countries as supply depots to satisfy their consumption levels. Ecologically unequal exchange theory constitutes theoretical background of this perspective. In order to test these hypotheses, Jorgenson employs the multivariate analyses and takes deforestation in the form of percent change as a dependent variable different from his other studies (Jorgenson and Rice 2007; Jorgenson 2009) . The independent variables in the study are weighted exports index for primary goods, accumulated stocks of primary sector foreign direct investment as percentage of GDP. The results reveal that export activities and foreign direct investments have negative impacts on nature. With this result, this study supports ecologically unequal exchange theory.
34
Jorgenson et al. (2010) examine effects of militarization on the environment by evaluating a panel study of carbon dioxide emissions and the ecological footprint of nations for the period 1970-2000 in this study. They imply the cross-national empirical analyses to investigate the impacts of national military expenditures on carbon dioxide emissions and the ecological footprints of nations. The dependent variables are total carbon dioxide emissions (i.e., scale emissions) and carbon dioxide emissions per capita (i.e., intensity emissions) and per capita ecological footprints per nations. The independent variables are military expenditures per soldier and military participation as key factors and other independent variables, namely military expenditures as percentage of (GDP) , GDP per capita, total population, manufacturing as percentage of total GDP, urban population as percentage of total population, percentage of population aged 15-64, and exports as percentage of total GDP . According to the results, economic development and militarization are found to be positive which support treadmill of destruction theory and treadmill of production theory. However, the positive relation between economic development and environmental harm contradicts with environmental Kuznets curve and ecological modernization theory.
Environmental Kuznets curve (EKC) studies have had an important impact in environmental economics studies. The researchers investigating the Kuznets curve particularly seek a possible U-shaped relation between dangerous gas emissions (i.e., green gas) and income level.
Grossman and Krueger (1994) estimate the EKC for SO2, dark matter (fine smoke) and suspended particles to examine the effects of North American Free Trade Agreement (NAFTA) on the environment in Mexico. They involve a cubic function