arXiv:1203.0419v2 [hep-ex] 15 Sep 2012
Measurement of the azimuthal ordering of charged hadrons with the ATLAS detector
G. Aad et al. (The ATLAS Collaboration)∗
This paper presents a study of the possible ordering of charged hadrons in the azimuthal angle relative to the beam axis in high-energy proton-proton collisions at the Large Hadron Collider (LHC). A spectral analysis of correlations between longitudinal and transverse components of the momentum of the charged hadrons, driven by the search for phenomena related to the structure of the QCD field, is performed. Data were recorded with the ATLAS detector at centre-of-mass energies of√s = 900 GeV and√s = 7 TeV. The correlations measured in a kinematic region dominated by low-pTparticles are not well described by conventional models of hadron production. The measured spectra show features consistent with the fragmentation of a QCD string represented by a helix-like ordered gluon chain.
PACS numbers: 13.85.Hd,13.87.Fh
I. INTRODUCTION
Inclusive charged-particle distributions have been mea-sured in proton-proton (pp) collisions at the LHC for differ-ent cdiffer-entre-of-mass energies [1–8]. These measuremdiffer-ents pro-vide insight into the strong interaction (QCD) at low energy scales and show that predictions of current phenomenological models cannot fully describe the measured observables in all kinematic regions. As shown in Ref. [2], the limitation of models is particularly apparent when particles with low trans-verse momentum (pT < 500 MeV) are studied. Specifically,
discrepancies are observed in the description of
• the charged particle density as a function of pseudora-pidity, dNch/dη;
• the shape of the charged-particle multiplicity distribu-tion both at low and high multiplicities;
• the shape of the charged-particle multiplicity distribu-tion for both pT < 500 MeV and pT> 3 GeV; and
• correlations between the average pT of charged
parti-cles per event,hpTi, and the charged-particle
multiplic-ity nch.
Some of these discrepancies may be reduced through the development of parametrisations for the models of non-perturbative QCD and their adjustments (tunes) that better match model predictions to the latest measurements with par-ticles produced at very low pT. Nevertheless, it is also
pos-sible that a new formulation of certain components of these phenomenological models is needed.
Many of the difficulties in accurately describing observ-ables dominated by low-pT QCD phenomena stem from the
fact that there is often a combination of non-perturbative ef-fects, including soft diffraction, low-pT parton scattering and
hadronisation. These effects act simultaneously in a given kinematic region and are difficult to separate experimentally. The recent ATLAS study of inclusive charged-particle produc-tion [2] shows that the sensitivity of measurements to some of
∗Full author list given at the end of the article.
these effects depends on the definition of the kinematic region in which the measurements are made. Typically, the more in-clusively the sample is defined, or the more soft particle activ-ity is added to the measurement, the larger the disagreement is between the data and the models.
Hadronisation, the mechanism of hadron formation from quark and gluon cascades, must be taken into account in all measurements involving hadrons. The flows of energy, mo-mentum and flavour of hadrons approximately follow those of partons [9]. The mechanism of hadron formation, however, can only be described with the aid of phenomenological mod-els. The two main models employed in multi-purpose event generators are the string (Lund) fragmentation model [10] and the cluster model [11].
A proposed modification of the Lund string model [12] evokes the possibility of the formation of a helix-like tured gluon field at the end of the parton cascade. Such a struc-ture corresponds to the optimal packing of soft gluons in the phase space under helicity conservation requirements. Most notably, the helix string model imposes correlations between the adjacent break-up points along a string with observable ef-fects in the inclusive pT distribution and in the azimuthal
or-dering of direct hadrons, i.e. hadrons produced directly from the string fragmentation.
In this paper, the correlations in the charged hadron az-imuthal angleφ [13] are studied for two different schemes of hadron ordering using data recorded with the ATLAS de-tector. The results are corrected for detector effects and com-pared with the predictions of various Monte Carlo (MC) event generators. The paper is organised as follows: the observables are described in Section II. Section III describes the ATLAS detector and Section IV presents the MC samples used in the study. The track and event selection are detailed in Section V. The analysis and the uncorrected data distributions measured at the center-of-mass energy of√s=7 TeV are presented in
Section VI. The procedure to correct for detector and selec-tion effects and an overview of systematic uncertainties can be found in Section VII (additional information is provided in the Appendix B). The last section of the paper is devoted to a comparison of corrected data with models and a discussion of the results. Appendix A presents results with√s=900 GeV.
II. OBSERVABLE QUANTITY
The presence of azimuthal ordering, stemming from the un-derlying QCD string structure, is studied for two different variants of the helix-like ordered gluon field. As suggested in [12], the azimuthal ordering of hadrons should be observ-able with the help of a power spectrum defined according to the expected structure of the helix field. Assuming the break-up of the string occurs via tunneling [10], with the partons emerging at rest, the azimuthal direction of the hadron’s in-trinsic transverse momentum coincides with the phase of the helix string in the centre of the string piece which forms the hadron. Hence, the azimuthal opening angle of two direct hadrons measures the phase difference between two corre-sponding points along the string, with the transverse plane defined with respect to the string axis. The analysis takes ad-vantage of the fact that in soft pp interactions, the QCD strings tend to be aligned along the beam axis.
In close analogy with [12], where the authors assume the helix winding is proportional to the rapidity difference be-tween hadrons, we define the power spectrum
Sη(ξ) = 1 Nevevent
∑
1 nch| nch∑
j exp(i(ξ ηj−φj))|2, (1) whereξ is a parameter andηj(φj) is the pseudorapidity (az-imuthal angle) of the j-th hadron, Nevis the number of events, and nchis the number of charged hadrons in the event. The in-ner sum runs over charged hadrons in the event and the outer sum over events in the sample.It is important to note that the form of the helix field is not well constrained and that it is possible to find several parametrisations of the helix field conforming to the assump-tions made in [12]. One possible scenario [14] corresponds to a static, regular helix structure with the phase difference
∆φproportional to the amount of internal energy stored in the fraction f of string with mass M0
∆φ= S f M0= S κ∆l= S ∆E, (2) where S is a parameter,κ is the string energy density,∆φ is the difference in the helix phase between two points along the string and∆l and∆E are the length and the energy,
respec-tively, of the corresponding string piece in its rest frame. The energy-distance∆E along the string between direct hadrons is
not directly observable but according to MC studies, the sig-nature of the helix-shaped field should be visible with help of a very loose approximation of the string by a chain of hadrons ordered in pseudorapidity. For the purpose of measuring the azimuthal ordering, we thus retain two parameters for each fi-nal hadron: the azimuthal angleφ and the position X along the chain, evaluated as
Xj= 0.5 Ej+ k<j
∑
k=0
Ek, (3)
where Ekis the energy of the k-th hadron in the chain, and the position of the hadron is associated with the centre of the cor-responding string piece. Accordingly, we define an alternative
power spectrum SE(ω) = 1 Nevevent
∑
1 nch| nch∑
j exp(i(ωXj−φj))|2, (4)where ω is a parameter. The inner sum runs over pseudorapidity-ordered charged hadrons in the event.
The presence of a helix-like angular ordering of hadrons of either type would manifest itself as a peak in the correspond-ing power spectrum; the position of the peak would indicate the density of the helix winding. It should be stressed that, though formally very similar, SEand Sηare only loosely
cor-related. A modified form of the helix string implies a differ-ence in the experimental signature, such that the presdiffer-ence of a helix gluon field creating a peak in SE does not necessarily
result in a peak structure in Sηand vice-versa.
The power spectra can also be expressed as a sum of con-tributions from pairs of hadrons
Sη(ξ) = 1 + 1
Nevevent
∑
1nch
∑
i6=jcos(ξ∆ηij−∆φij),
SE(ω) = 1 + 1 Nevevent
∑
1 nch∑
i6=j cos(ω∆Xij−∆φij), (5) where∆φij=φi−φjis the opening azimuthal angle between hadrons,∆ηij=ηi−ηjis their pseudorapidity difference and∆Xij= Xi− Xjtheir energy-distance as defined above. The ab-sence of correlations corresponds to Sη(ξ)=1 and SE(ω)=1.
III. ATLAS DETECTOR
The ATLAS detector [15] covers almost the entire solid an-gle around the collision point with layers of tracking detec-tors, calorimeters and muon chambers. It has been designed to study a wide range of physics topics at LHC energies. For the measurements presented in this paper, the trigger system and the tracking devices are of particular importance.
The ATLAS inner detector has full coverage inφand cov-ers the pseudorapidity range|η| < 2.5. It consists of a silicon pixel detector, a silicon strip detector (SCT) and a transition radiation tracker (TRT). These detectors are immersed in a 2 T axial magnetic field. The pixel, SCT and TRT detectors have typical r–φ position resolutions of 10, 17 and 130µm, re-spectively, and the pixel and SCT detectors have r–z position resolutions of 115 and 580µm, respectively. A track travers-ing the full radial extent would typically have 3 silicon pixel hits, 8 and more silicon strip hits and more than 30 TRT hits.
The ATLAS detector has a three-level trigger sys-tem: level 1 (L1), level 2 (L2) and the event filter (EF). For this measurement, the L1 trigger relies on the beam pickup timing devices (BPTX) and the minimum bias trigger scintil-lators (MBTS). The BPTX are composed of electrostatic beam pickups attached to the beam pipe at a distance z= ±175 m from the center of the ATLAS detector. The MBTS are mounted at each end of the detector in front of the liquid-argon endcap-calorimeter cryostats at z= ±3.56 m and are
segmented into eight sectors in azimuth and two rings in pseu-dorapidity (2.09 < |η| < 2.82 and 2.82 < |η| < 3.84). Data were taken for this analysis using the single-arm MBTS trig-ger, formed from BPTX and MBTS L1 trigger signals. The MBTS trigger was configured to require one hit above thresh-old from either side of the detector. The MBTS trigger effi-ciency was studied with a separate pre-scaled L1 BPTX trig-ger, filtered to obtain inelastic interactions by inner detector requirements at L2 and EF [2].
IV. MONTE CARLO SAMPLES
The analysis has been developed using a PYTHIA 6.421 [16] (MC09 tune [17]) sample with large statistics, fully simulated [18] and reconstructed using the standard ATLAS reconstruction chain [19]. It should be stressed that the choice of the MC tune does not affect the outcome of the analysis because the data are corrected in a model independent way.
For the comparison of the corrected data with the standard hadronisation models, MC samples produced with PHOJET 1.12.1.35 [20], HERWIG++ 2.5.1 [21] (LHC-UE7-2/MU900-2 tunes [(LHC-UE7-2/MU900-2(LHC-UE7-2/MU900-2]), PYTHIA 8.130 (4C tune [(LHC-UE7-2/MU900-23]) and a recent tune of PYTHIA 6 (AMBT2b [24]) have been used. The MC gen-erators PYTHIA and PHOJET employ the Lund string frag-mentation model whereas the HERWIG MC is based on the cluster model. To study the sensitivity of the power spectra to the modification of the string fragmentation model, the data are also compared with an alternative implementation of the fragmentation process based on the helix string field described by Eq. 2 [25].
V. DATA SAMPLES
The measurements reported in this paper were made using
pp collision data recorded at√s= 7 TeV. The data were col-lected with stable colliding beams at 7 TeV and correspond to an integrated luminosity of∼ 190µb−1 from the beginning of the 2010 LHC run [2]. A sample of pp collision events recorded at√s= 900 GeV corresponding to an integrated lu-minosity of∼ 7µb−1[2] was also studied and the results are shown in Appendix A.
V.1. Event and track selection
Events are selected using the following criteria: • the event has at least one trigger hit in MBTS;
• the event has one and only one reconstructed vertex and this vertex must have at least three associated tracks; • the event has no tracks with pT> 10 GeV;
• the event has at least six reconstructed tracks (ntr> 5)
passing the requirements below.
The requirements on reconstructed tracks included in the analysis are the following:
• the track is reconstructed by the track reconstruction al-gorithm used in [1], with an implicit cut on the trans-verse momentum, pT > 100 MeV, and more than 6 hits
in the silicon detectors;
• the track has a transverse impact parameter with respect to the primary vertex|dPV0 | < 2 mm;
• the track has a longitudinal impact parameter with re-spect to the primary vertex|zPV0 |sin(θ) < 2 mm; and • the track is reconstructed in the pseudorapidity range
−2.5 <η< 2.5.
The requirement on the minimum number of tracks en-sures full trigger efficiency [2]. The contributions from the beam and non-collision background (cosmic rays and detec-tor noise) have been investigated in [2] and found to be neg-ligible. Events with multiple primary vertices (less than 0.3% of the sample and subsamples defined below) are rejected in order to prevent a bias from multiple pp interactions in the colliding proton bunches.
V.2. Subsample definitions
The analysis is carried out in parallel on the sample selected as described above (henceforth referred to as the “inclusive sample”) and on two subsamples.
The first subsample contains events where the transverse momentum of any reconstructed track does not exceed 1 GeV (max(pT) < 1 GeV). This subsample is called the “low-pT
en-hanced sample”. The effects of parton showering and lateral boost are diminished in this selection. The max(pT) < 1 GeV
requirement selects events with little acollinear jet activity and thus the transverse activity is expected to be primarily sensi-tive to hadronisation effects.
The analysis is also performed on a second subsample de-fined by a higher track pTcut-off, pT> 500 MeV. This
partic-ular selection yields a subsample with a significantly reduced contribution from diffractive pp interactions (see Table I). This subsample is referred to as the “low-pT depleted sample”.
V.3. Selection criteria at particle level
The comparison between corrected data and MC models re-quires an adjustment of the event selection in order to avoid a systematic bias. The analysis relies on two main selection criteria: the charged-hadron pT and the charged-hadron
mul-tiplicity.
The effect of the low pT cut-off is easily modelled at the
particle level (MC truth [26]) and the corresponding system-atic uncertainty is covered by the uncertainty assigned to the correction procedure, described in Section VII. The cut on the maximal pT of a track is more selective when applied at the
particle level as it removes also those MC events which con-tain a non-reconstructed high pT track. The effect is
non-negligible in the low-pT enhanced sample, where it is
cor-rected for and a systematic uncertainty is assigned to reflect the additional uncertainty.
The charged-track multiplicity selection criteria on the measured data need to be modified in order to emulate MC modelling. The adjustment of the charged-track multiplicity is done in the following way: for each reconstructed track, a random number RND is repeatedly generated according to a flat distribution until RND<εtr,εtrbeing the estimated track
reconstruction efficiency [27]. The corrected charged-track mutiplicity nchcorresponds to the number of random numbers
generated for the entire event. The procedure also contains an additional correction for the residual content of secondary tracks.
The selection based on nchroughly reproduces the average
charged-particle multiplicity of the particle-level sample se-lected with a ngench cut-off (see Table I). Figure 1 illustrates the effect of hadron-level cuts on the true charged-particle mul-tiplicity ngench . The choice of the selection cut for the current analysis (nch≈ ngench > 10 ) is aimed at minimising any bias
in the power spectra related to the loss of events due to the detector-level charged-track multiplicity cut-off ntr>5.
The selection criteria distinguishing between data samples are summarised in Table II which also provides the informa-tion about the final number of events retained for the analy-sis and the mean corrected charged-track multiplicity of each sample. The relative fraction of diffractive events (based on the nominal cross-section) and the mean charged-particle mul-tiplicity of the Monte Carlo selection are given in Table I.
The final track selection contains 2.8±0.4% of secondary tracks according to studies performed on simulated samples. Non-primary tracks predominantly arise from hadronic
inter-gen ch charged-particle multiplicity n 10 gen ch /d n ev d N 0 500 1000 3 10 ×
ATLAS Simulation → PYTHIA6 MC09, s = 7 TeV unbiased > 5 tr n > 10 ch n
FIG. 1. The impact of the charged-track multiplicity cut-off on the true charged-particle multiplicity distribution. The arrow indicates the cut on the true charged-particle multiplicity, removing the region affected by the loss of events due to the requirement of at least 6 reconstructed tracks (white area). The shaded area corresponds to the detector-level cut ntr> 5. The final analysis selection cut (nch> 10) is indicated by closed points.
actions with detector material, photon conversion to electron-positron pairs and decays of long lived particles. The aver-age reconstruction efficiency for primary charged particles is 75% for the pT >100 MeV track selection and 84% for the
pT >500 MeV selection. The systematic uncertainty due to
the performance of the track reconstruction is estimated fol-lowing the studies performed in Ref. [2].
Model(tune) PYTHIA6(MC09)
low pT cut >100 MeV >500 MeV max(pT) cut < 10 GeV < 1 GeV < 10 GeV
nch>10 (corrected detector level)
Nchgen 31.93 17.11∗ 22.62
diffractive/total 3.9±0.1% 21.4±0.2% <0.1% ngench >10 (particle level)
Nchgen 31.31 15.53 22.26
diffractive/total 4.0±0.1% 22.7±0.2% <0.1%
TABLE I. Average charged-particle multiplicity Nchgen and relative fraction of diffractive events for the fully simulated PYTHIA6 (MC09) MC sample at√s= 7 TeV. Results are shown for events se-lected with the corrected charged-track multiplicity cut-off nch>10 (detector level) and ngench >10 (particle level) (∗indicates before the max(pT) cut correction).
pp collisions at√s = 7 TeV, nch>10 pT>100 MeV pT>500 MeV max(pT)<10 GeV max(pT)<1 GeV max(pT)<10 GeV
Nev Nch Nev Nch Nev Nch
8,099,211 34.71 1,292,389 17.96∗ 4,341,217 23.27 TABLE II. Number of selected data events and average cor-rected charged-track multiplicity, per sample (∗indicates before the max(pT) cut correction).
VI. ANALYSIS METHOD
For the measurement of SE, the selected tracks are ordered
by pseudorapidity and a pion mass is assigned to each of them. According to MC estimates, the charged particle sample con-tains about 86% pions, 9.5% kaons, 4% protons/antiprotons and a negligible number of leptons (∼ 0.5%). The effect of assuming a pion mass would need to be taken into account for a precision measurement of the position of the signal but its impact on the comparison of data with MC models is negligi-ble. For the calculation of Sηno mass assumption is required. The power spectra are measured as (Sη − 1) and (SE − 1)
for convenience.
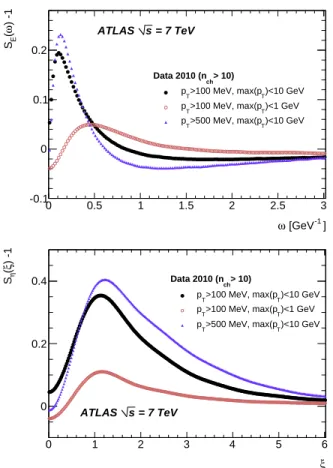
The uncorrected power spectra are shown in Fig. 2 as a function of the azimuthal opening angle (helix phase differ-ence) per unit of energy distance (SE) and per unit of
pseudo-rapidity (Sη) for the three samples. All angles are expressed in radians throughout the paper.
] -1 [GeV ω 0 0.5 1 1.5 2 2.5 3 ) -1 ω (E S -0.1 0 0.1 0.2 = 7 TeV s ATLAS > 10) ch Data 2010 (n )<10 GeV T >100 MeV, max(p T p )<1 GeV T >100 MeV, max(p T p )<10 GeV T >500 MeV, max(p T p ξ 0 1 2 3 4 5 6 ) -1 ξ (η S 0 0.2 0.4 = 7 TeV s ATLAS > 10) ch Data 2010 (n )<10 GeV T >100 MeV, max(p T p )<1 GeV T >100 MeV, max(p T p )<10 GeV T >500 MeV, max(p T p
FIG. 2. The uncorrected data measurements (top: SE, bottom: Sη) obtained from the data sample collected at√s = 7 TeV. The mea-surement of the inclusive sample is compared to meamea-surements of the low-pTenhanced and low-pTdepleted subsamples.
MC studies show that the power spectra are sensitive to var-ious kinds of correlations between particles. The dominant peaks seen in both distributions arise due to the jet structure and momentum conservation in the hard parton-parton scat-tering. The position of these peaks depends on the visible energy (in the case of SE) and the pseudorapidity range (in
the case of Sη) used in the analysis. Their height is sensi-tive to a number of physics processes, notably the amount and structure of multiple parton interactions, cross-talk between overlapping hadronic systems (colour reconnection), and par-ton shower properties. Note, that the values of SE(ω= 0) and
Sη(ξ= 0) are identical by definition. They are closely related to the average opening angle between particles in the trans-verse plane. The presence of azimuthal correlations stemming from the properties of the gluon field should be visible as an additional positive peak or enhancement in the power spec-trum and the modification should be more pronounced in the low-pT region, where the fragmentation and parton
interac-tions have comparable effects on the transverse momentum of hadrons.
The comparison of the uncorrected data obtained in the in-clusive event selection and in the low-pT enhanced/depleted
subsamples shows the size of the peaks diminishing with the
decreasing track pT selection range, a feature we may
asso-ciate with the relative fraction of high pT jets in the sample.
VII. CORRECTION PROCEDURE AND SYSTEMATIC UNCERTAINTIES
The data are corrected for non-reconstructed charged parti-cles with the help of an unfolding technique based on [28] and described in the Appendix B.
The correction for the secondary track content is obtained using a random sampling of secondary tracks according to the parametrised secondary track rate obtained from fully simu-lated MC. The contribution from tracks labeled as secondary (δSsec) is subtracted from the measured data distribution. Typ-ically, it amounts to∼ 6% of the size of the peak in the power spectrum.
An additional correction is applied in the low-pT enhanced
sample to compensate for the bias introduced by the selection cut on max(pT) in case the track with highest pT was not
re-constructed. Selecting events with exactly one track above the threshold, the power spectra (SpT) are calculated using all the
other tracks in the event. The correction is obtained by sub-tracting SpT from the data in the proportion corresponding to
the probability for the high-pT track being lost in the
recon-struction.
All corrections are model independent. The correction pro-cedure has been verified by checking the propro-cedure on fully simulated MC samples.
VII.1. Systematic uncertainties
The principal sources and parametrisations of systematic uncertainty associated with the corrected data are summarised in Table III. The combined systematic uncertainty has the fol-lowing components:
• residual bias of the folding procedure (Appendix B): obtained from the comparison of distributions recon-structed at the detector level using samples with full detector simulation and those obtained with the folding technique;
Source Systematic uncertainty [SE(ω), Sη(ξ)] folding procedure max(0.003, 3%(S − 1))
unfolding envelope of the residual bias from unfolding tracking efficiency scaling parameters± 5%
secondary tracks max(0.005, 0.25|δSsec|) nchcut-off variation of the cut-off nchby± 1 max(pT) < 1 GeV δSpT= (1 −εtr)/εtrSpT,εtr± 5%
TABLE III. The parametrisation of the components of the systematic uncertainty, per measured point of the corrected power spectrum.
• uncertainty of the unfolding technique: parametrised to cover the residual discrepancies in the scaling of 3 fold-ing iterations (Appendix B);
• uncertainty on the tracking efficiency estimate: domi-nated by the uncertainty on the inner detector material description, which translates into a variation of scaling factors by 5%;
• uncertainty due to the residual content of secondary tracks: set to 25% of the correction applied, with mini-mal value of 0.005 (based on MC studies) ;
• uncertainty due to the difference in the charged-particle multiplicity selection at the generator level and at the detector level: calculated in a model-independent way as a variation of the shape corresponding to the change of the averaged selected charged-particle multiplicity by one unit; and
• the uncertainty in the correction of the bias due the max(pT) cut: corresponds to a 5% variation of the track
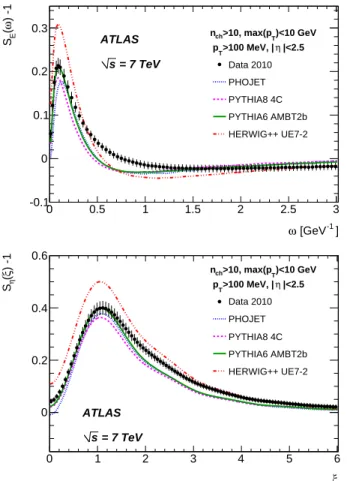
reconstruction efficiency. ] -1 [GeV ω 0 0.5 1 1.5 2 2.5 3 ) -1 ω (E S -0.1 0 0.1 0.2 0.3 ATLAS = 7 TeV s )<10 GeV T >10, max(p ch n |<2.5 η >100 MeV, | T p Data 2010 PHOJET PYTHIA8 4C PYTHIA6 AMBT2b HERWIG++ UE7-2 ξ 0 1 2 3 4 5 6 ) -1 ξ (η S 0 0.2 0.4 0.6 ATLAS = 7 TeV s )<10 GeV T >10, max(p ch n |<2.5 η >100 MeV, | T p Data 2010 PHOJET PYTHIA8 4C PYTHIA6 AMBT2b HERWIG++ UE7-2
FIG. 3. Corrected data from the inclusive sample compared to particle-level predictions from various MC models using conven-tional hadronisation algorithms. The top and bottom plots are for the SEand Sηpower spectra, respectively. The error bars correspond to the combined statistical and systematic uncertainties.
All contributions to the systematic uncertainty are combined quadratically. The negative correlation between track recon-struction efficiency and secondary track content is neglected, making the uncertainty estimate more conservative.
VIII. RESULTS
The results of this analysis obtained for pp collisions at√s
= 7 TeV are presented in this section. Results from this analy-sis repeated for√s = 900 GeV are shown in Appendix A. The
corrected data are compared with the predictions of several commonly used MC models: PYTHIA6, PHOJET, PYTHIA8 and HERWIG++.
Figure 3 shows the comparison for the inclusive event se-lection (nch> 10, pT>100 MeV and maximal pT< 10 GeV).
The principal peak structure observed in the power spectra for both SEand Sηis roughly reproduced by PYTHIA and
PHO-JET models and overestimated by HERWIG++. The tail of the
SEdistribution around 0.5 <ω< 1 rad/GeV is not reproduced
by any of the models.
] -1 [GeV ω 0 0.5 1 1.5 2 2.5 3 ) -1 ω (E S -0.2 -0.1 0 0.1 ATLAS = 7 TeV s )<1 GeV T >10, max(p ch n |<2.5 η >100 MeV, | T p Data 2010 PHOJET PYTHIA8 4C PYTHIA6 AMBT2b HERWIG++ UE7-2 ξ 0 1 2 3 4 5 6 ) -1 ξ (η S -0.2 -0.1 0 0.1 0.2 ATLAS = 7 TeV s )<1 GeV T >10, max(p ch n |<2.5 η >100 MeV, | T p Data 2010 PHOJET PYTHIA8 4C PYTHIA6 AMBT2b HERWIG++ UE7-2
FIG. 4. Corrected data from the low-pTenhanced sample compared to particle-level predictions from various MC models using conven-tional hadronisation algorithms. The top and bottom plots are for the SE and Sη power spectra, respectively. The error bars correspond to the combined statistical and systematic uncertainties.
Hadronisation effects should become more evident when measurements are made in regions of the phase space domi-nated by the production of low-pT particles. Figure 4 shows
the power spectra measured in the low-pT enhanced sample
(nch> 10, pT >100 MeV and maximal pT < 1 GeV). A
significant amount of correlations in observed in the data in both SE and Sη distributions compared to the PHOJET and
PYTHIA based models. HERWIG++ gives a seemingly bet-ter description for the SE distribution yet it seems its
predic-tion is more of an artefact of an enhanced single jet structure given the fact the model overestimates the measurements in the inclusive event selection (Fig. 3). The interpretation of this measurement in terms of the azimuthal ordering of hadrons re-lated to the properties of the gluon field is discussed in Section VIII.1.
Figure 5 shows the power spectra SE and Sη for the
cor-rected data and MC predictions in the low-pTdepleted region
(nch> 10, pT >500 MeV and maximal pT < 10 GeV). In
principle, this should be the best understood part of the phase space, with a suppressed diffractive component, lower sensi-tivity to hadronisation effects and best available model tunes.
] -1 [GeV ω 0 0.5 1 1.5 2 2.5 3 ) -1 ω (E S 0 0.2 0.4 ATLAS = 7 TeV s )<10 GeV T >10, max(p ch n |<2.5 η >500 MeV, | T p Data 2010 PHOJET PYTHIA8 4C PYTHIA6 AMBT2b HERWIG++ UE7-2 ξ 0 1 2 3 4 5 6 ) -1 ξ (η S 0 0.2 0.4 0.6 0.8 ATLAS = 7 TeV s )<10 GeV T >10, max(p ch n |<2.5 η >500 MeV, | T p Data 2010 PHOJET PYTHIA8 4C PYTHIA6 AMBT2b HERWIG++ UE7-2
FIG. 5. Corrected data from the low-pT depleted sample compared to particle-level predictions from various MC models using conven-tional hadronisation algorithms. The top and bottom plots are for the SEand Sη power spectra, respectively. The error bars correspond to the combined statistical and systematic uncertainties.
However, we find that all models significantly overestimate the size of the principal peak structure in both SEand Sη.
Comparison of Figs 3, 4 and 5 show that the azimuthal cor-relations are qualitatively different in each subsample, and that the standard MC models fail to reproduce these accu-rately. Similar conclusion can be drawn for the measurement performed at√s = 900 GeV (Appendix A).
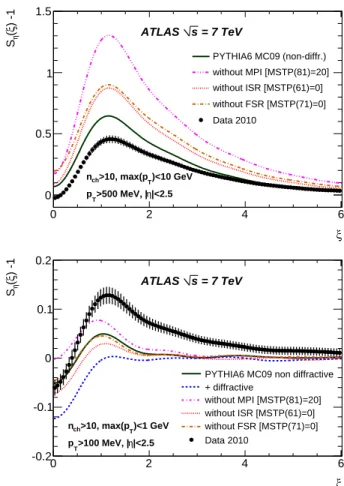
ξ 0 2 4 6 ) -1 ξ (η S 0 0.5 1 1.5 = 7 TeV s ATLAS )<10 GeV T >10, max(p ch n |<2.5 η >500 MeV, | T p PYTHIA6 MC09 (non-diffr.) without MPI [MSTP(81)=20] without ISR [MSTP(61)=0] without FSR [MSTP(71)=0] Data 2010 ξ 0 2 4 6 ) -1 ξ (η S -0.2 -0.1 0 0.1 0.2 = 7 TeV s ATLAS )<1 GeV T >10, max(p ch n |<2.5 η >100 MeV, | T p
PYTHIA6 MC09 non diffractive + diffractive
without MPI [MSTP(81)=20] without ISR [MSTP(61)=0] without FSR [MSTP(71)=0] Data 2010
FIG. 6. Corrected Sη distributions compared with the particle level predictions of PYTHIA6 MC09 for various settings, using the non-diffractive pp scattering (full line) as the baseline. Top: low-pT de-pleted subsample. Bottom: low-pT enhanced subsample. The error bars correspond to the combined statistical and systematic uncertain-ties.
In the frame of the conventional QCD modelling, we have tried to identify the most likely source of the observed discrep-ancies. Figure 6 shows the sensitivity of the Sηdistribution to various components of the QCD modelling implemented in PYTHIA 6, taking as a baseline the non-diffractive pp scatter-ing scenario (indicated by the full line). In the low-pT
de-pleted sample, the size of correlations varies strongly with the amount of multiple parton interactions (MPI), of initial state radiation (ISR) and with the amount of parton showering. The data prefer modelling with enhanced radiation and/or en-hanced MPI rate which can be achieved via careful adjustment of the relevant model parameters.
However, such an adjustment typically creates an even larger discrepancy in the low-pT enhanced region, where the
parton shower and ISR have smaller influence. Inversely, the removal of the MPI and of the diffractive processes increases the size of the peak in the modelling of the low-pT enhanced
region, but none of these rather extreme variations lead to a good agreement with the measured Sη distribution, while creating a huge discrepancy in the low-pT enhanced region.
We conclude that for both measured spectra, the conventional models fail to describe the low-pTenhanced region, where the
data are consistenly showing a larger and broader peak struc-ture.
VIII.1. Alternative fragmentation model
The question of compatibility of the measurements with the azimuthal ordering signal originating from the underly-ing structure of the QCD field is studied usunderly-ing the PYTHIA6-based helix string model implementation [25] of the modi-fied helix string scenario corresponding to the SE definition
(Eq. 2). The comparison of corrected data with the PHOJET
] -1 [GeV ω 0 1 2 3 ) -1 ω (E S 0 0.1 0.2 ATLAS = 7 TeV s nch>10, max(pT)<10 GeV |<2.5 η >100 MeV, | T p Data 2010 PHOJET, std.fragm. PHOJET, helix string fragm.
ξ 0 2 4 6 ) -1 ξ (η S 0 0.2 0.4 0.6 ATLAS = 7 TeV s )<10 GeV T >10, max(p ch n |<2.5 η >100 MeV, | T p Data 2010 PHOJET, std.fragm. PHOJET, helix string fragm.
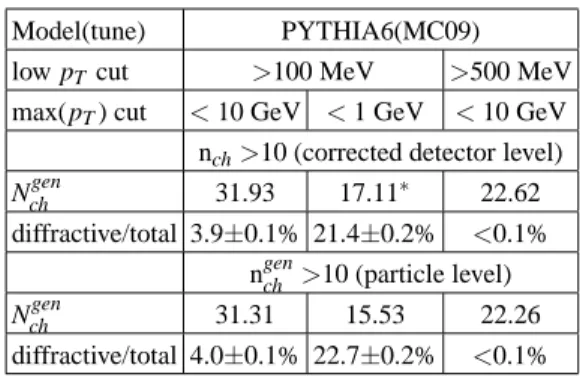
FIG. 7. Corrected SE (top) and Sη (bottom) distributions com-pared with the particle level predictions of PHOJET, interfaced to the PYTHIA6-based alternative fragmentation using helix string model [25] (setting S = 0.7 rad/GeV, see Eq. 2), in the inclusive event se-lection. The error bars correspond to the combined statistical and systematic uncertainties.
modelling of pp interactions, interfaced alternatively with the standard string fragmentation and with the helix string frag-mentation, is shown in Figs 7 and 8. It is seen that the helix-like gluon ordering improves the description of the data in the inclusive sample for SEas it generates higher values in the
re-gion ofω∈ (0.5,1). In the low-pT enhanced sample the data
are more strongly peaked than the model. This indicates the data have a more jet-like structure than predicted by PHOJET which means the model may need readjustment beyond the fragmentation part.
It is possible that the original helix string proposal [12] pro-vides an improved description of the Sηmeasurement but we cannot verify this hypothesis due to the absence of the MC implementation of this variant of the helix string model for parton configurations containing hard gluons.
In principle, the position of the azimuthal ordering signal allows a measurement of the characteristic density of the he-lix string winding (parameter S in Eq. 2 ). The data indicate S in the range 0.5 to 0.9 rad/GeV. However, the interplay be-tween string fragmentation and the other processes (such as
] -1 [GeV ω 0 1 2 3 ) -1 ω (E S -0.2 -0.1 0 0.1 = 7 TeV s ATLAS )<1 GeV T >10, max(p ch n |<2.5 η >100 MeV, | T p Data 2010 PHOJET, std.fragm. PHOJET, helix string fragm.
ξ 0 2 4 6 ) -1 ξ (η S -0.2 -0.1 0 0.1 0.2 = 7 TeV s ATLAS )<1 GeV T >10, max(p ch n |<2.5 η >100 MeV, | T p Data 2010 PHOJET, std.fragm. PHOJET, helix string fragm.
FIG. 8. Corrected SE (top) and Sη (bottom) distributions com-pared with the particle level predictions of PHOJET, interfaced to the PYTHIA6-based alternative fragmentation using helix string model [25] (setting S = 0.7 rad/GeV, see Eq. 2), in the low-pT enhanced subsample. The error bars correspond to the combined statistical and systematic uncertainties.
parton showering, colour reconnection and multiple interac-tions) is not sufficiently understood to allow a more precise estimate (the measurement has to rely on MC description for the correction of the longitudinal boost).
IX. CONCLUSIONS
A measurement of the ordering of charged hadrons in the azimuthal angle with the ATLAS data recorded from proton-proton collisions at√s = 7 TeV and√s = 900 GeV has been
presented.
A spectral analysis of correlations between the opening az-imuthal angle and the longitudinal separation of the charged hadrons was performed by measuring the SE and Sη power
spectra. These measurements were done in three kinematic re-gions (inclusive, low-pT enhanced and low-pT depleted
sam-ples) that were specifically defined to help assess the potential contribution of hadronisation effects to the power spectra by varying the levels of competition between hadronisation and other QCD effects.
The results were compared with the expectations of various MC event generators. Predictions generated by the MC mod-els employing the standard Lund string fragmentation model roughly reproduce the data in the inclusive sample.
The models systematically overestimate the size of corre-lations in the low-pT depleted sample, where the observables
are sensitive to the multiple jet structure of events (due to the presence of underlying event and/or parton showering).
For observables measured in the low-pT enhanced
sam-ple, none of the models investigated describes the data ade-quately. A study showing the impact of extreme variations in MC model parameters that are known to contribute to soft-QCD effects demonstrates that, although some improvement of predictions for SE and Sη can be achieved in the low-pT
enhanced sample, it is still far from satisfactory.
The measurement of SEin the kinematic region dominated
by low-pT particles shows features similar to those seen in
models in which the fragmenting QCD strings are represented by helix-like ordered gluon chains. These measurements sug-gest that the inclusion of such azimuthally-ordered fragmen-tation effects could be one factor in improving current models of soft particle production and hadronisation.
ACKNOWLEDGMENTS
We thank CERN for the very successful operation of the LHC, as well as the support staff from our institutions without whom ATLAS could not be operated efficiently.
We acknowledge the support of ANPCyT, Argentina; Yer-PhI, Armenia; ARC, Australia; BMWF, Austria; ANAS, Azerbaijan; SSTC, Belarus; CNPq and FAPESP, Brazil; NSERC, NRC and CFI, Canada; CERN; CONICYT, Chile; CAS, MOST and NSFC, China; COLCIENCIAS, Colombia; MSMT CR, MPO CR and VSC CR, Czech Republic; DNRF, DNSRC and Lundbeck Foundation, Denmark; ARTEMIS, European Union; IN2P3-CNRS, CEA-DSM/IRFU, France;
GNAS, Georgia; BMBF, DFG, HGF, MPG and AvH Foun-dation, Germany; GSRT, Greece; ISF, MINERVA, GIF, DIP and Benoziyo Center, Israel; INFN, Italy; MEXT and JSPS, Japan; CNRST, Morocco; FOM and NWO, Nether-lands; RCN, Norway; MNiSW, Poland; GRICES and FCT, Portugal; MERYS (MECTS), Romania; MES of Russia and ROSATOM, Russian Federation; JINR; MSTD, Serbia; MSSR, Slovakia; ARRS and MVZT, Slovenia; DST/NRF, South Africa; MICINN, Spain; SRC and Wallenberg Founda-tion, Sweden; SER, SNSF and Cantons of Bern and Geneva, Switzerland; NSC, Taiwan; TAEK, Turkey; STFC, the Royal Society and Leverhulme Trust, United Kingdom; DOE and NSF, United States of America.
The crucial computing support from all WLCG partners is acknowledged gratefully, in particular from CERN and the ATLAS Tier-1 facilities at TRIUMF (Canada), NDGF (Den-mark, Norway, Sweden), CC-IN2P3 (France), KIT/GridKA (Germany), INFN-CNAF (Italy), NL-T1 (Netherlands), PIC (Spain), ASGC (Taiwan), RAL (UK) and BNL (USA) and in the Tier-2 facilities worldwide.
APPENDIX A
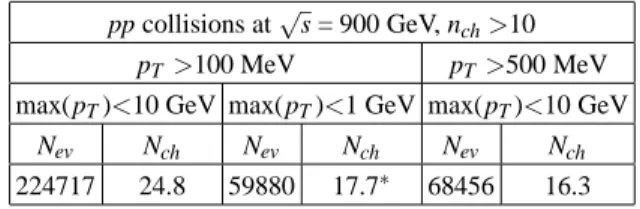
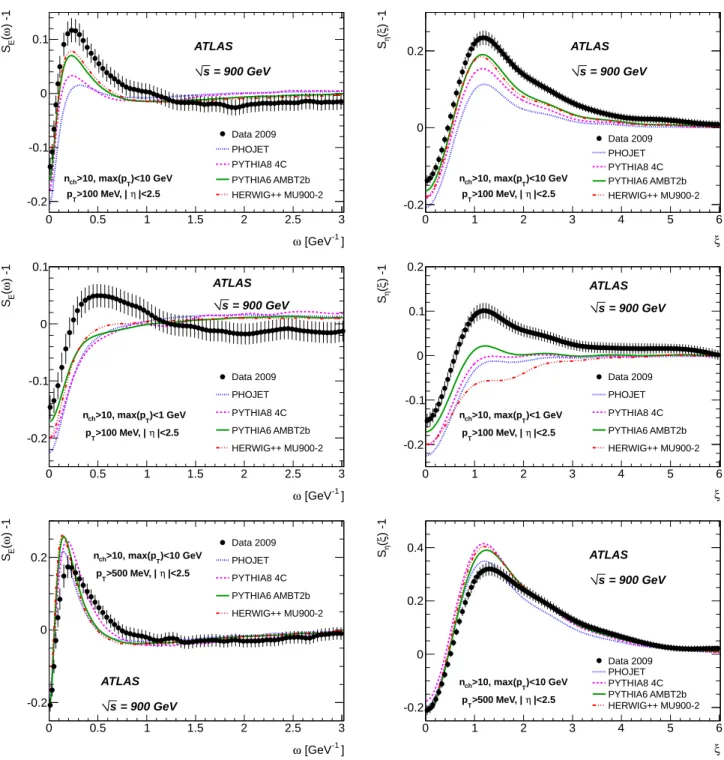
The analysis is repeated for ATLAS data collected at√s= 900 GeV. The number of selected events and the average corrected charged-track multiplicity are shown in Table IV. For comparison, the average charged-particle multiplicity of PYTHIA6 MC09 samples is shown in Table V, together with the fraction of diffractive events in the sample (the estimate is based on the nominal cross section obtained from the gen-erator). The corrected data are compared to the particle level prediction of various models in Fig. 9.
pp collisions at√s = 900 GeV, nch>10 pT>100 MeV pT>500 MeV max(pT)<10 GeV max(pT)<1 GeV max(pT)<10 GeV
Nev Nch Nev Nch Nev Nch
224717 24.8 59880 17.7∗ 68456 16.3
TABLE IV. Number of selected events and average corrected charged-track multiplicity, per sample (∗ indicates before the max(pT) cut correction).
APPENDIX B
The deconvolution technique employed in this analysis is a model-independent procedure suitable for observables with linear dependence on the track reconstruction efficiency. The dependence of the shape of the measured distribution on the fraction of reconstructed tracks is studied by convolution with the track reconstruction efficiency matrix (“double-folding”): the reconstructed tracks are randomly rejected from the sam-ple according to the parametrised reconstruction efficiency
] -1 [GeV ω 0 0.5 1 1.5 2 2.5 3 ) -1 ω (E S -0.2 -0.1 0 0.1 ATLAS = 900 GeV s )<10 GeV T >10, max(p ch n |<2.5 η >100 MeV, | T p Data 2009 PHOJET PYTHIA8 4C PYTHIA6 AMBT2b HERWIG++ MU900-2 ξ 0 1 2 3 4 5 6 ) -1 ξ (η S -0.2 0 0.2 ATLAS = 900 GeV s )<10 GeV T >10, max(p ch n |<2.5 η >100 MeV, | T p Data 2009 PHOJET PYTHIA8 4C PYTHIA6 AMBT2b HERWIG++ MU900-2 ] -1 [GeV ω 0 0.5 1 1.5 2 2.5 3 ) -1 ω (E S -0.2 -0.1 0 0.1 ATLAS = 900 GeV s )<1 GeV T >10, max(p ch n |<2.5 η >100 MeV, | T p Data 2009 PHOJET PYTHIA8 4C PYTHIA6 AMBT2b HERWIG++ MU900-2 ξ 0 1 2 3 4 5 6 ) -1 ξ (η S -0.2 -0.1 0 0.1 0.2 ATLAS = 900 GeV s )<1 GeV T >10, max(p ch n |<2.5 η >100 MeV, | T p Data 2009 PHOJET PYTHIA8 4C PYTHIA6 AMBT2b HERWIG++ MU900-2 ] -1 [GeV ω 0 0.5 1 1.5 2 2.5 3 ) -1 ω (E S -0.2 0 0.2 ATLAS = 900 GeV s )<10 GeV T >10, max(p ch n |<2.5 η >500 MeV, | T p Data 2009 PHOJET PYTHIA8 4C PYTHIA6 AMBT2b HERWIG++ MU900-2 ξ 0 1 2 3 4 5 6 ) -1 ξ (η S -0.2 0 0.2 0.4 ATLAS = 900 GeV s )<10 GeV T >10, max(p ch n |<2.5 η >500 MeV, | T p Data 2009 PHOJET PYTHIA8 4C PYTHIA6 AMBT2b HERWIG++ MU900-2
FIG. 9. Corrected data compared to particle level predictions from various MC models using conventional hadronisation algorithms. The left and right plots are for the SEand Sη power spectra, respectively. Top: inclusive event selection (pT>100 MeV, max(pT) <10 GeV). Middle: event selection with enhanced soft component (pT>100 MeV, max(pT) <1 GeV). Bottom: event selection with reduced soft component (pT>500 MeV, max(pT) <10 GeV). ATLAS data collected at√s = 900 GeV and selected with nch> 10. The error bars correspond to the combined statistical and systematic uncertainties.
Model(tune) PYTHIA6(MC09)
low pT cut >100 MeV >500 MeV
max(pT) cut < 10 GeV < 1 GeV < 10 GeV nch>10 (corrected detector level)
Nchgen 21.91 15.28∗ 15.2
diffractive/total 3.8(±0.1)% 14.7(±0.2)% <0.01% ngench >10 (particle level)
Nchgen 21.45 15.47 15.75
diffractive/total 3.7(±0.1)% 13.8(±0.2)% <0.01% TABLE V. Average charged-particle multiplicity Nchgen and rela-tive fraction of diffracrela-tive events for the fully simulated PYTHIA6 (MC09) MC sample at √s= 900 GeV. Results are shown for events selected with the corrected charged-track multiplicity cut-off nch>10 (detector level) and n
gen
ch >10 (particle level) (∗ indicates before the max(pT) cut correction).
and the power spectra are recalculated. The procedure is re-peated two more times, so that a sequence of three folding iter-ations is available for each measured distribution. The folding iterations, together with the measured distribution and the de-convoluted (MC truth) distribution, obey simple scaling rules: • the size of correlations (along the S-1 axis) scales lin-early with the multiplicity (physically it depends on the fraction of correlated pairs which have quadratic mul-tiplicity dependence, partially compensated by the nor-malisation factor in Eqs.1 and 4).
• the shape of the power spectrum SE scales linearly in
ω with the fraction of energy removed from the hadron chain (in Sη, the position of the peak stays nearly con-stant).
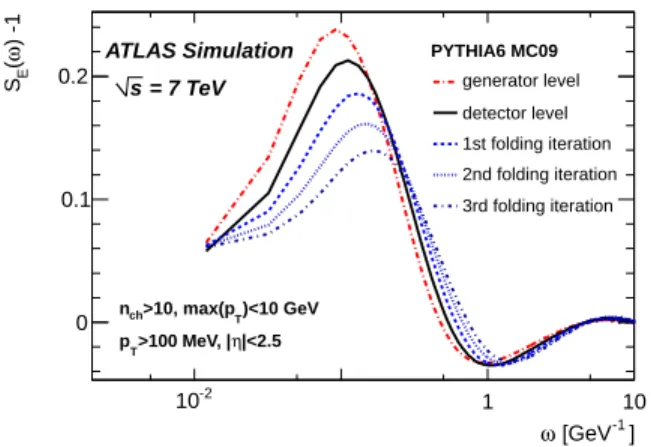
A typical example of the variation of the power spectrum with the number of applied folding iterations is shown in Fig. 10 on a PYTHIA6 sample with inclusive event selection. For better
] -1 [GeV ω -2 10 1 10 ) -1 ω ( E S 0 0.1 0.2 PYTHIA6 MC09 generator level detector level 1st folding iteration 2nd folding iteration 3rd folding iteration ATLAS Simulation = 7 TeV s )<10 GeV T >10, max(p ch n |<2.5 η >100 MeV, | T p
FIG. 10. Power spectrum calculated at the generator level, detector level and following three folding iterations as described in the text. Secondary tracks are removed from the samples in Figs 10-11.
illustration of the scaling symmetry, secondary tracks are re-moved from the sample using the generator level information. The deconvolution of the power spectrum requires finding a set of scaling factors fy, fx(x =ω,ξ) which fullfil the
require-ment Si−1(x) − 1 = 1 fy [Si( x fx) − 1] , 0 < x < 10 , 0 < i < 4. (B1)
where Si designates the i-th folding iteration of the power
spectrum (i=0 for uncorrected data, -1 for corrected data). The origin of observed correlations may be diverse, with variable dependence on the track reconstruction efficiency. A better precision can therefore be obtained by splitting the ob-served distribution empirically into components and by esti-mating the scaling factors per component.
The power spectra calculated in this paper can, to good ap-proximation, be fit with a combination of a Landau distribu-tion [29] (to describe the resonant peak structure), an expo-nentially falling background (driven by local momentum con-servation of adjacent hadron pairs) and a polynomial of first or second degree to describe the upper tail of the distribution. In practice, the subtraction of a single background term and determination of 2-3 effective scaling factors is sufficient to describe the difference between a pair of folding iterations; the replacement of the fx with an attenuated scaling factor
fx→ f
′
x= ( fx+ x)/(1 + x) helps smooth the transition into
the upper part of the spectrum.
The knowledge of a single pair of consecutive iterations is sufficient to calculate the scaling factors. Typically, they are determined using the difference between uncorrected data and the 1st folding iteration (1→0). The stability of the scaling factors is verified by applying them on the folding iterations of higher orders (2→1,3→2) while the residual discrepancies serve as a basis for the estimate of the associated systematic uncertainty (Fig. 11). The deconvoluted power spectrum is obtained with the help of Eq. B1 as the extrapolated (0→-1) member of the sequence of folding iterations.
] -1 [GeV ω 0 1 2 3 4 5 E S δ -0.02 -0.01 0 0.01 0.02 PYTHIA6 MC09
systematic error (scaling)
iter2 - scaled iter3 iter1 - scaled iter2 iter0 (measured) - scaled iter1 MC truth - scaled iter0 ATLAS Simulation = 7 TeV s )<10 GeV T >10, max(p ch n |<2.5 η >100 MeV, | T p
FIG. 11. The closure test of the scaling deconvolution method. Follow-up of the scaling precision over several folding iterations al-lows to verify the stability and to estimate the associated systematic error.
[1] ATLAS Collaboration, Phys. Lett. B 688, 21 (2010). [2] ATLAS Collaboration, New J. Phys. 13, 053033 (2011). [3] ALICE Collaboration, Eur. Phys. J. C 65, 111 (2010). [4] ALICE Collaboration, Eur. Phys. J. C 68, 89 (2010). [5] ALICE Collaboration, Eur. Phys. J. C 68, 345 (2010). [6] CMS Collaboration, J. High Energy Phys. 02, 041 (2010). [7] CMS Collaboration, Phys. Rev. Lett. 105, 022002 (2010). [8] CMS Collaboration, J. High Energy Phys. 01, 079 (2011). [9] Y. I. Azimov et al., Z. Phys. C 27, 65 (1985).
[10] B. Andersson et al., Phys. Rept. 97, 31 (1983). [11] B. R. Webber, Nucl. Phys. B 238, 492 (1984).
[12] B. Andersson et al., J. High Energy Phys. 09, 014 (1998). [13] The ATLAS reference system is a right-handed coordinate
sys-tem with its origin at the nominal interaction point at the cen-tre of the detector. Cylindrical coordinates (r,φ) are used in the transverse plane,φ being the azimuthal angle around the beam axis. The pseudorapidity is defined in terms of the polar angle
θasη= −ln tan (θ/2).
[14] ˇS. Todorova, in Proceedings of the XL International Sympo-sium on Multiparticle Dynamics, Antwerp, 2010, edited by P.van Mechelen and N.van Remortel, published by Uitgeverij UPA University Press Antwerp (2011).
[15] ATLAS Collaboration, JINST 3, S08003 (2008).
[16] T. Sj¨ostrand, S. Mrenna, and P. Z. Skands, J. High Energy Phys. 05, 026 (2006).
[17] ATLAS Collaboration, (2010),
Report No. ATL-PHYS-PUB-2010-002, https://cdsweb.cern.ch/record/1247375..
[18] GEANT4 Collaboration, Nucl. Instr. Meth. A506, 250 (2003). [19] ATLAS Collaboration, Eur. Phys. J. C 70, 823 (2010). [20] R. Engel, Z. Phys. C 66, 203 (1995).
[21] M. Bahr et al., Eur. Phys. J. C 58, 639 (2008).
[22] http://projects.hepforge.org/herwig/trac/wiki/MB UE tunes. [23] T. Sj¨ostrand, S. Mrenna, and P. Z. Skands, Comput. Phys.
Comm. 178, 852 (2008).
[24] ATLAS Collaboration, ATL-PHYS-PUB-2011-009, (2011), https://cdsweb.cern.ch/record/1363300.
[25] http://projects.hepforge.org/helix/.
[26] Primary particles are defined as all particles with lifetime longer than 0.3×10⁻¹⁰s originating from the primary interaction or from subsequent decay of particles with shorter lifetime. [27] The track reconstruction efficiency is parametrised as a function
of track pT and pseudorapidityη.
[28] J. W. Monk and C. Oropeza-Barrera, arXiv:1111.4896v2 [NIM (to be published)].
[29] Landau(MPV,σ) = 1
πR0∞e−ulnu−λu sin π u du, where λ =
ω−MPV
The ATLAS Collaboration
G. Aad48, B. Abbott110, J. Abdallah11, A.A. Abdelalim49, A. Abdesselam117, O. Abdinov10, B. Abi111, M. Abolins87, O.S. AbouZeid157, H. Abramowicz152, H. Abreu114, E. Acerbi88a,88b, B.S. Acharya163a,163b, L. Adamczyk37, D.L. Adams24, T.N. Addy56, J. Adelman174, M. Aderholz98, S. Adomeit97, P. Adragna74, T. Adye128, S. Aefsky22, J.A. Aguilar-Saavedra123b,a,
M. Aharrouche80, S.P. Ahlen21, F. Ahles48, A. Ahmad147, M. Ahsan40, G. Aielli132a,132b, T. Akdogan18a, T.P.A. ˚Akesson78, G. Akimoto154, A.V. Akimov93, A. Akiyama66, M.S. Alam1, M.A. Alam75, J. Albert168, S. Albrand55, M. Aleksa29, I.N. Aleksandrov64, F. Alessandria88a, C. Alexa25a, G. Alexander152, G. Alexandre49, T. Alexopoulos9, M. Alhroob20, M. Aliev15, G. Alimonti88a, J. Alison119, M. Aliyev10, P.P. Allport72, S.E. Allwood-Spiers53, J. Almond81, A. Aloisio101a,101b, R. Alon170, A. Alonso78, B. Alvarez Gonzalez87, M.G. Alviggi101a,101b, K. Amako65, P. Amaral29, C. Amelung22,
V.V. Ammosov127, A. Amorim123a,b, G. Amor´os166, N. Amram152, C. Anastopoulos29, L.S. Ancu16, N. Andari114, T. Andeen34, C.F. Anders20, G. Anders58a, K.J. Anderson30, A. Andreazza88a,88b, V. Andrei58a, M-L. Andrieux55,
X.S. Anduaga69, A. Angerami34, F. Anghinolfi29, A. Anisenkov106, N. Anjos123a, A. Annovi47, A. Antonaki8, M. Antonelli47, A. Antonov95, J. Antos143b, F. Anulli131a, S. Aoun82, L. Aperio Bella4, R. Apolle117,c, G. Arabidze87, I. Aracena142, Y. Arai65, A.T.H. Arce44, J.P. Archambault28, S. Arfaoui147, J-F. Arguin14, E. Arik18a,∗, M. Arik18a, A.J. Armbruster86, O. Arnaez80, C. Arnault114, A. Artamonov94, G. Artoni131a,131b, D. Arutinov20, S. Asai154, R. Asfandiyarov171, S. Ask27, B. ˚Asman145a,145b,
L. Asquith5, K. Assamagan24, A. Astbury168, A. Astvatsatourov52, B. Aubert4, E. Auge114, K. Augsten126, M. Aurousseau144a, G. Avolio162, R. Avramidou9, D. Axen167, C. Ay54, G. Azuelos92,d, Y. Azuma154, M.A. Baak29, G. Baccaglioni88a,
C. Bacci133a,133b, A.M. Bach14, H. Bachacou135, K. Bachas29, G. Bachy29, M. Backes49, M. Backhaus20, E. Badescu25a, P. Bagnaia131a,131b, S. Bahinipati2, Y. Bai32a, D.C. Bailey157, T. Bain157, J.T. Baines128, O.K. Baker174, M.D. Baker24, S. Baker76, E. Banas38, P. Banerjee92, Sw. Banerjee171, D. Banfi29, A. Bangert149, V. Bansal168, H.S. Bansil17, L. Barak170, S.P. Baranov93, A. Barashkou64, A. Barbaro Galtieri14, T. Barber48, E.L. Barberio85, D. Barberis50a,50b, M. Barbero20,
D.Y. Bardin64, T. Barillari98, M. Barisonzi173, T. Barklow142, N. Barlow27, B.M. Barnett128, R.M. Barnett14, A. Baroncelli133a, G. Barone49, A.J. Barr117, F. Barreiro79, J. Barreiro Guimar˜aes da Costa57, P. Barrillon114, R. Bartoldus142, A.E. Barton70, V. Bartsch148, R.L. Bates53, L. Batkova143a, J.R. Batley27, A. Battaglia16, M. Battistin29, F. Bauer135, H.S. Bawa142,e, S. Beale97, B. Beare157, T. Beau77, P.H. Beauchemin160, R. Beccherle50a, P. Bechtle20, H.P. Beck16, S. Becker97,
M. Beckingham137, K.H. Becks173, A.J. Beddall18c, A. Beddall18c, S. Bedikian174, V.A. Bednyakov64, C.P. Bee82, M. Begel24, S. Behar Harpaz151, P.K. Behera62, M. Beimforde98, C. Belanger-Champagne84, P.J. Bell49, W.H. Bell49, G. Bella152,
L. Bellagamba19a, F. Bellina29, M. Bellomo29, A. Belloni57, O. Beloborodova106, f, K. Belotskiy95, O. Beltramello29, S. Ben Ami151, O. Benary152, D. Benchekroun134a, C. Benchouk82, M. Bendel80, N. Benekos164, Y. Benhammou152, E. Benhar Noccioli49, J.A. Benitez Garcia158b, D.P. Benjamin44, M. Benoit114, J.R. Bensinger22, K. Benslama129,
S. Bentvelsen104, D. Berge29, E. Bergeaas Kuutmann41, N. Berger4, F. Berghaus168, E. Berglund104, J. Beringer14, P. Bernat76, R. Bernhard48, C. Bernius24, T. Berry75, C. Bertella82, A. Bertin19a,19b, F. Bertinelli29, F. Bertolucci121a,121b, M.I. Besana88a,88b,
N. Besson135, S. Bethke98, W. Bhimji45, R.M. Bianchi29, M. Bianco71a,71b, O. Biebel97, S.P. Bieniek76, K. Bierwagen54, J. Biesiada14, M. Biglietti133a, H. Bilokon47, M. Bindi19a,19b, S. Binet114, A. Bingul18c, C. Bini131a,131b, C. Biscarat176, U. Bitenc48, K.M. Black21, R.E. Blair5, J.-B. Blanchard135, G. Blanchot29, T. Blazek143a, C. Blocker22, J. Blocki38, A. Blondel49, W. Blum80, U. Blumenschein54, G.J. Bobbink104, V.B. Bobrovnikov106, S.S. Bocchetta78, A. Bocci44, C.R. Boddy117, M. Boehler41, J. Boek173, N. Boelaert35, S. B¨oser76, J.A. Bogaerts29, A. Bogdanchikov106, A. Bogouch89,∗, C. Bohm145a, V. Boisvert75, T. Bold37, V. Boldea25a, N.M. Bolnet135, M. Bona74, V.G. Bondarenko95, M. Bondioli162, M. Boonekamp135, G. Boorman75, C.N. Booth138, S. Bordoni77, C. Borer16, A. Borisov127, G. Borissov70, I. Borjanovic12a, S. Borroni86, K. Bos104, D. Boscherini19a, M. Bosman11, H. Boterenbrood104, D. Botterill128, J. Bouchami92, J. Boudreau122, E.V. Bouhova-Thacker70, D. Boumediene33, C. Bourdarios114, N. Bousson82, A. Boveia30, J. Boyd29, I.R. Boyko64,
N.I. Bozhko127, I. Bozovic-Jelisavcic12b, J. Bracinik17, A. Braem29, P. Branchini133a, G.W. Brandenburg57, A. Brandt7, G. Brandt117, O. Brandt54, U. Bratzler155, B. Brau83, J.E. Brau113, H.M. Braun173, B. Brelier157, J. Bremer29, R. Brenner165, S. Bressler170, D. Breton114, D. Britton53, F.M. Brochu27, I. Brock20, R. Brock87, T.J. Brodbeck70, E. Brodet152, F. Broggi88a, C. Bromberg87, J. Bronner98, G. Brooijmans34, W.K. Brooks31b, G. Brown81, H. Brown7, P.A. Bruckman de Renstrom38, D. Bruncko143b, R. Bruneliere48, S. Brunet60, A. Bruni19a, G. Bruni19a, M. Bruschi19a, T. Buanes13, Q. Buat55, F. Bucci49, J. Buchanan117, N.J. Buchanan2, P. Buchholz140, R.M. Buckingham117, A.G. Buckley45, S.I. Buda25a, I.A. Budagov64, B. Budick107, V. B¨uscher80, L. Bugge116, O. Bulekov95, M. Bunse42, T. Buran116, H. Burckhart29, S. Burdin72, T. Burgess13, S. Burke128, E. Busato33, P. Bussey53, C.P. Buszello165, F. Butin29, B. Butler142, J.M. Butler21, C.M. Buttar53,
J.M. Butterworth76, W. Buttinger27, S. Cabrera Urb´an166, D. Caforio19a,19b, O. Cakir3a, P. Calafiura14, G. Calderini77,
P. Calfayan97, R. Calkins105, L.P. Caloba23a, R. Caloi131a,131b, D. Calvet33, S. Calvet33, R. Camacho Toro33, P. Camarri132a,132b, M. Cambiaghi118a,118b, D. Cameron116, L.M. Caminada14, S. Campana29, M. Campanelli76, V. Canale101a,101b, F. Canelli30,g,
A. Canepa158a, J. Cantero79, L. Capasso101a,101b, M.D.M. Capeans Garrido29, I. Caprini25a, M. Caprini25a, D. Capriotti98, M. Capua36a,36b, R. Caputo80, C. Caramarcu24, R. Cardarelli132a, T. Carli29, G. Carlino101a, L. Carminati88a,88b, B. Caron84, S. Caron103, G.D. Carrillo Montoya171, A.A. Carter74, J.R. Carter27, J. Carvalho123a,h, D. Casadei107, M.P. Casado11, M. Cascella121a,121b, C. Caso50a,50b,∗, A.M. Castaneda Hernandez171, E. Castaneda-Miranda171, V. Castillo Gimenez166, N.F. Castro123a, G. Cataldi71a, F. Cataneo29, A. Catinaccio29, J.R. Catmore29, A. Cattai29, G. Cattani132a,132b, S. Caughron87,
D. Cauz163a,163c, P. Cavalleri77, D. Cavalli88a, M. Cavalli-Sforza11, V. Cavasinni121a,121b, F. Ceradini133a,133b, A.S. Cerqueira23b, A. Cerri29, L. Cerrito74, F. Cerutti47, S.A. Cetin18b, F. Cevenini101a,101b, A. Chafaq134a, D. Chakraborty105, K. Chan2,
B. Chapleau84, J.D. Chapman27, J.W. Chapman86, E. Chareyre77, D.G. Charlton17, V. Chavda81, C.A. Chavez Barajas29, S. Cheatham84, S. Chekanov5, S.V. Chekulaev158a, G.A. Chelkov64, M.A. Chelstowska103, C. Chen63, H. Chen24, S. Chen32c, T. Chen32c, X. Chen171, S. Cheng32a, A. Cheplakov64, V.F. Chepurnov64, R. Cherkaoui El Moursli134e, V. Chernyatin24, E. Cheu6, S.L. Cheung157, L. Chevalier135, G. Chiefari101a,101b, L. Chikovani51a, J.T. Childers29, A. Chilingarov70,
G. Chiodini71a, M.V. Chizhov64, G. Choudalakis30, S. Chouridou136, I.A. Christidi76, A. Christov48, D. Chromek-Burckhart29, M.L. Chu150, J. Chudoba124, G. Ciapetti131a,131b, K. Ciba37, A.K. Ciftci3a, R. Ciftci3a, D. Cinca33, V. Cindro73,
M.D. Ciobotaru162, C. Ciocca19a, A. Ciocio14, M. Cirilli86, M. Citterio88a, M. Ciubancan25a, A. Clark49, P.J. Clark45, W. Cleland122, J.C. Clemens82, B. Clement55, C. Clement145a,145b, R.W. Clifft128, Y. Coadou82, M. Cobal163a,163c,
A. Coccaro171, J. Cochran63, P. Coe117, J.G. Cogan142, J. Coggeshall164, E. Cogneras176, J. Colas4, A.P. Colijn104, N.J. Collins17, C. Collins-Tooth53, J. Collot55, G. Colon83, P. Conde Mui˜no123a, E. Coniavitis117, M.C. Conidi11, M. Consonni103, V. Consorti48, S. Constantinescu25a, C. Conta118a,118b, F. Conventi101a,i, J. Cook29, M. Cooke14,
B.D. Cooper76, A.M. Cooper-Sarkar117, K. Copic14, T. Cornelissen173, M. Corradi19a, F. Corriveau84, j, A. Cortes-Gonzalez164, G. Cortiana98, G. Costa88a, M.J. Costa166, D. Costanzo138, T. Costin30, D. Cˆot´e29, R. Coura Torres23a, L. Courneyea168, G. Cowan75, C. Cowden27, B.E. Cox81, K. Cranmer107, F. Crescioli121a,121b, M. Cristinziani20, G. Crosetti36a,36b,
R. Crupi71a,71b, S. Cr´ep´e-Renaudin55, C.-M. Cuciuc25a, C. Cuenca Almenar174, T. Cuhadar Donszelmann138, M. Curatolo47, C.J. Curtis17, C. Cuthbert149, P. Cwetanski60, H. Czirr140, P. Czodrowski43, Z. Czyczula174, S. D’Auria53, M. D’Onofrio72, A. D’Orazio131a,131b, P.V.M. Da Silva23a, C. Da Via81, W. Dabrowski37, T. Dai86, C. Dallapiccola83, M. Dam35,
M. Dameri50a,50b, D.S. Damiani136, H.O. Danielsson29, D. Dannheim98, V. Dao49, G. Darbo50a, G.L. Darlea25b, C. Daum104, W. Davey20, T. Davidek125, N. Davidson85, R. Davidson70, E. Davies117,c, M. Davies92, A.R. Davison76, Y. Davygora58a, E. Dawe141, I. Dawson138, J.W. Dawson5,∗, R.K. Daya-Ishmukhametova22, K. De7, R. de Asmundis101a, S. De Castro19a,19b, P.E. De Castro Faria Salgado24, S. De Cecco77, J. de Graat97, N. De Groot103, P. de Jong104, C. De La Taille114,
H. De la Torre79, B. De Lotto163a,163c, L. de Mora70, L. De Nooij104, D. De Pedis131a, A. De Salvo131a, U. De Sanctis163a,163c, A. De Santo148, J.B. De Vivie De Regie114, S. Dean76, W.J. Dearnaley70, R. Debbe24, C. Debenedetti45, D.V. Dedovich64, J. Degenhardt119, M. Dehchar117, C. Del Papa163a,163c, J. Del Peso79, T. Del Prete121a,121b, T. Delemontex55, M. Deliyergiyev73, A. Dell’Acqua29, L. Dell’Asta21, M. Della Pietra101a,i, D. della Volpe101a,101b, M. Delmastro4, N. Delruelle29, P.A. Delsart55, C. Deluca147, S. Demers174, M. Demichev64, B. Demirkoz11,k, J. Deng162, S.P. Denisov127, D. Derendarz38, J.E. Derkaoui134d, F. Derue77, P. Dervan72, K. Desch20, E. Devetak147, P.O. Deviveiros104, A. Dewhurst128, B. DeWilde147, S. Dhaliwal157, R. Dhullipudi24,l, A. Di Ciaccio132a,132b, L. Di Ciaccio4, A. Di Girolamo29, B. Di Girolamo29, S. Di Luise133a,133b,
A. Di Mattia171, B. Di Micco29, R. Di Nardo47, A. Di Simone132a,132b, R. Di Sipio19a,19b, M.A. Diaz31a, F. Diblen18c, E.B. Diehl86, J. Dietrich41, T.A. Dietzsch58a, S. Diglio85, K. Dindar Yagci39, J. Dingfelder20, C. Dionisi131a,131b, P. Dita25a, S. Dita25a, F. Dittus29, F. Djama82, T. Djobava51b, M.A.B. do Vale23c, A. Do Valle Wemans123a, T.K.O. Doan4, M. Dobbs84, R. Dobinson29,∗, D. Dobos29, E. Dobson29,m, J. Dodd34, C. Doglioni49, T. Doherty53, Y. Doi65,∗, J. Dolejsi125, I. Dolenc73, Z. Dolezal125, B.A. Dolgoshein95,∗, T. Dohmae154, M. Donadelli23d, M. Donega119, J. Donini33, J. Dopke29, A. Doria101a, A. Dos Anjos171, M. Dosil11, A. Dotti121a,121b, M.T. Dova69, J.D. Dowell17, A.D. Doxiadis104, A.T. Doyle53, Z. Drasal125, J. Drees173, N. Dressnandt119, H. Drevermann29, C. Driouichi35, M. Dris9, J. Dubbert98, S. Dube14, E. Duchovni170, G. Duckeck97, A. Dudarev29, F. Dudziak63, M. D¨uhrssen29, I.P. Duerdoth81, L. Duflot114, M-A. Dufour84, M. Dunford29, H. Duran Yildiz3a, R. Duxfield138, M. Dwuznik37, F. Dydak29, M. D¨uren52, W.L. Ebenstein44, J. Ebke97, S. Eckweiler80, K. Edmonds80, C.A. Edwards75, N.C. Edwards53, W. Ehrenfeld41, T. Ehrich98, T. Eifert142, G. Eigen13, K. Einsweiler14, E. Eisenhandler74, T. Ekelof165, M. El Kacimi134c, M. Ellert165, S. Elles4, F. Ellinghaus80, K. Ellis74, N. Ellis29, J. Elmsheuser97, M. Elsing29, D. Emeliyanov128, R. Engelmann147, A. Engl97, B. Epp61, A. Eppig86, J. Erdmann54, A. Ereditato16, D. Eriksson145a, J. Ernst1, M. Ernst24, J. Ernwein135, D. Errede164, S. Errede164, E. Ertel80, M. Escalier114, C. Escobar122, X. Espinal Curull11, B. Esposito47, F. Etienne82, A.I. Etienvre135, E. Etzion152, D. Evangelakou54, H. Evans60, L. Fabbri19a,19b, C. Fabre29, R.M. Fakhrutdinov127, S. Falciano131a, Y. Fang171, M. Fanti88a,88b, A. Farbin7, A. Farilla133a, J. Farley147, T. Farooque157, S.M. Farrington117, P. Farthouat29, P. Fassnacht29, D. Fassouliotis8, B. Fatholahzadeh157, A. Favareto88a,88b, L. Fayard114, S. Fazio36a,36b, R. Febbraro33, P. Federic143a, O.L. Fedin120, W. Fedorko87,
M. Fehling-Kaschek48, L. Feligioni82, D. Fellmann5, C. Feng32d, E.J. Feng30, A.B. Fenyuk127, J. Ferencei143b, J. Ferland92, W. Fernando108, S. Ferrag53, J. Ferrando53, V. Ferrara41, A. Ferrari165, P. Ferrari104, R. Ferrari118a, A. Ferrer166, M.L. Ferrer47, D. Ferrere49, C. Ferretti86, A. Ferretto Parodi50a,50b, M. Fiascaris30, F. Fiedler80, A. Filipˇciˇc73, A. Filippas9, F. Filthaut103, M. Fincke-Keeler168, M.C.N. Fiolhais123a,h, L. Fiorini166, A. Firan39, G. Fischer41, P. Fischer20, M.J. Fisher108, M. Flechl48, I. Fleck140, J. Fleckner80, P. Fleischmann172, S. Fleischmann173, T. Flick173, L.R. Flores Castillo171, M.J. Flowerdew98, M. Fokitis9, T. Fonseca Martin16, D.A. Forbush137, A. Formica135, A. Forti81, D. Fortin158a, J.M. Foster81, D. Fournier114, A. Foussat29, A.J. Fowler44, K. Fowler136, H. Fox70, P. Francavilla11, S. Franchino118a,118b, D. Francis29, T. Frank170, M. Franklin57, S. Franz29, M. Fraternali118a,118b, S. Fratina119, S.T. French27, F. Friedrich43, R. Froeschl29, D. Froidevaux29, J.A. Frost27, C. Fukunaga155, E. Fullana Torregrosa29, J. Fuster166, C. Gabaldon29, O. Gabizon170, T. Gadfort24,
S. Gadomski49, G. Gagliardi50a,50b, P. Gagnon60, C. Galea97, E.J. Gallas117, V. Gallo16, B.J. Gallop128, P. Gallus124, K.K. Gan108, Y.S. Gao142,e, V.A. Gapienko127, A. Gaponenko14, F. Garberson174, M. Garcia-Sciveres14, C. Garc´ıa166,
![FIG. 7. Corrected SE (top) and S η (bottom) distributions com- com-pared with the particle level predictions of PHOJET, interfaced to the PYTHIA6-based alternative fragmentation using helix string model [25] (setting S = 0.7 rad/GeV, see Eq](https://thumb-eu.123doks.com/thumbv2/9libnet/4057111.57461/8.918.488.831.462.952/corrected-distributions-particle-predictions-phojet-interfaced-alternative-fragmentation.webp)