T.C
ISTANBUL MEDIPOL UNIVERSITY INSTITUTE OF HEALTH SCIENCES
MASTER THESIS
THE COMPARISON OF PERIPHERAL DOSE IN
STEREOTACTIC BRAIN IRRADIATION WITH THE USE OF
DIFFERENT TREATMENT TECHNIQUES
HANİEH MABHOUTI
DEPARTMENT OF MEDICAL PHYSICS
SUPERVISOR
Doç. Dr. HİLAL ACAR DEMİR
iii
ACKNOWLEDGEMENTS
It would not have been possible to complete this work without the help of many people. This integrated position provided me with insight into the power and usefulness of research and development. I would like to thank Dr. Hilal Acar Demir for supporting this initial attempt, and for her support as my supervisor throughout my Master’s degree. Thank you for seeing such great potential in me.
I would especially like to appreciate our amazing head of department Prof.Dr Hale Başak Çağlar for providing us all the facilities and her extraordinary support. She genuinely cares about her students and believes that they can succeed.
This thesis would not have been possible without the support, and encouragement I have received from my educators Esra Küçükmorkoç, Mine Doyuran, Hande Sertkaya, Reshad Rızazadeh, Doğu Canoğlu, Yasin Ceylan and Sercan Güneş.
I have always been strongly aware of the sacrifices my parents have made so that I would have the opportunity to pursue an advanced degree. I do not have words to adequately describe my deep thanks for all that my dad has provided me with both financially and morally over the course of my life, though I hope to show him in the years to come.
I have benefited greatly from the many great friendships I have made over these two years actively working in Medipol University.Thank you to Mehmet Sıddık Cebe, Pelin Paçacı, Esra Serin, Emre Şanlı, Sevtap Yıldırım, Dursun İşitmez for all their help and consultations.
And finally, I would like to thank and dedicate this thesis to my dear educator Nadir Küçük for all his encouragement, support, and endless enthusiasm for life. His patience and motivation during my Masters have been incredible. I am so grateful to know you. You are so enthusiastic about what you do and so knowledgeable too.
iv
CONTENTS
Page number
THESIS APPROVAL FORM ... i
DECLARATION ... ii
ACKNOWLEDGEMENTS ... iii
ABBREVIATIONS AND SYMBOLS ... vii
LIST OF TABLES... ix
LIST OF FIGURES ... x
LIST OF PHOTOGRAPHS ... xii
1. ABSTRACT ... 1 2. ÖZET ... 2 3. INTRODUCTION ... 3 4. GENERAL DEFINITIONS ... 5 4.1.Stereotactic Radiotherapy ... 5 4.1.1. Rigid Immobilization ... 6
4.1.2. Conformal Dose Distribution ... 7
4.1.3. Different types of treatment planning evaluation parameter ... 8
4.1.3.1.Conformity Index ... 8
4.1.3.1.1 Paddick Description ... 9
4.1.3.1.2 ICRU Description ... 9
4.1.3.2 Gradient Index ...10
4.1.3.3 Homogeneity Index ...11
4.1.4 Three-dimensional positioning accuracy ...11
4.1.5 Real-time tumor tracking ...12
4.1.6 Varian Eclipse 13.0.26 Treatment Planning System ...13
4.1.6.1 Analytical Anisotropic Algorithm (AAA) ...16
4.1.6.2 Acuros XB Algorithm(AXB) ...17
4.1.7 MultiPlan Treatment Planning System ...19
4.1.7.1 Beam Targeting ...21
4.1.7.1.1 Isocentric Targeting ...21
4.1.7.1.2 Conformal Targeting ...21
4.1.7.1.3 Manual Beam Placement ...21
v
4.1.7.2.1 Simplex Optimization ...22
4.1.7.2.2 Iterative Optimization ...22
4.1.7.2.3 Sequentional Optimization ...23
4.1.7.3 Dose Calculation Algorithm ...23
4.1.7.3.1 Ray-Tracing Dose Calculation Algorithm...23
4.1.7.3.2 Monte Carlo Dose Calculation Algorithm ...24
4.1.7.3.3 Finite Size Pencil Beam Dose Calculation Algorithm ...24
5. MATERIALS AND METHOD ... 26 5.1.MATERİALS ...26
5.1.1 Philips Gemini TF PET-CT 16 ...26
5.1.2 Varian Truebeam 2.0 Stx Linear Accelerator...27
5.1.3 CyberKnife M6 ...29
5.1.4 Atom Dosimetry Verification Phantoms ...31
5.1.5 Film Dosimetry ...32
5.1.6 PTW Farmer Type Chamber TN30013 ...33
5.1.7 RW3 Slab Phantoms ...33
5.2.METHOD ...34
5.2.1 A CT Simulation of the Phantoms ...34
5.2.2 Exporting Data into the Treatment Planning System ...35
5.2.3 Contouring ...35
5.2.4 Treatment Planning in Eclipse Treatment Planning System ...36
5.2.5 Treatment Planning in Multiplan ...37
5.2.6 Preparation of Gafchromic EBT 3 Films ...39
5.2.6.1 Scanner Orientation ...39
5.2.6.2 Preparation and Irradiation of Films ...40
5.2.6.3 Scanning of EBT3 Films ...41
5.2.7. Ion chamber measurement ...42
5.2.8 Set up of CIRS Phantom ...42
5.2.8.1. Irradiation of Truebeamstx plans ...44
5.2.8.2. Irradiation of MultiPlan TPS plans ...44
5.2.8.3. Evaluation of irradiated Gafchromic EBT3 films ...44
6. RESULTS ...46
6.1 Film Calibration Curve ...46
6.2 Peripheral Dose Calculation Difference in TPS ...47
vi
6.4. MU comparison in TB and CK ...51
6.5. Peripheral Dose Measurements in Truebeam STx ...52
6.6. Peripheral Dose Measurements in CyberKnife M6 ...55
6.7. Comparison of Peripheral Doses in Different Modalities ...59
7. DISCUSSION ...65
8. CONCLUSION ...68
9. REFERENCES ...69 10. CURRICULUM VITAE ... 78
vii
ABBREVIATIONS AND SYMBOLS
PD : Peripheral Dose
TPS : Treatment Planning System
SRS : Stereotactic Radiosurgery LQM : Linear-Quadratic Model CI : Conformity Index GI : Gradient Index HI : Homogeneity Index MV : MegaVoltage KV : KiloVoltage
CBCT : Cone-Beam Computed Tomography
CT : Computed Tomography
MVCBCT : MegaVoltage Cone-Beam Computed Tomography
KVCBCT : KiloVoltage Cone-Beam Computed Tomography
IMRT : Intensity Modulated Radiation Therapy
VMAT : Volumetric Modulated Arc Therapy
DVO : Dose Volume Optimization
PGO : Plan Geometry Optimization
PRO : Progressive Resolution Optimizer
MRDC : Multi-Resolution DOse Optimization
MU : Monitor Unit
DVH : Dose Volume Histogram
AAA : Analytical Anisotropic Algorithm
AXB : Acuros XB
LBTE : Linear Boltzmann Transport Equation
RT : Ray-Tracing
MC : Monte Carlo
FSPB : Finite Size Pencil Beam
VIO : Volume Of Intrest
MLC : Multi Leaf Collimator
viii
FFF : Flattening Filter Free
TB : TrueBeam
CK : CyberKnife
PDD : Percentage Depth Dose
HDMLC : High Definition Multi Leaf Collimator
DCA : Dynamic Conformal Arc
3DCRT : Three-Dimensional Conformal Radiation Therapy
OAR : Organ At Risk
PTV : Planning Target Volume
GTV : Gross Tumor Volume
CTV : Clinical Target Volume
TLD : ThermoLuminescent Detector
DICOM : Digital Imaging and Communications in Medicine
V : Vertex
NC : NAsal Cavity
ix
LIST OF TABLES
Page number
Table 6.2.1: Results of PD Differences Between AAA and AXB Algorithms in Eclipse TPS. ...48 Table 6.2.2: Results of PD Differences Between Ray-Tracing and MC Algorithms in Multiplan TPS. ...49 Table 6.3.1: Evaluation of Irradiated Volumes Using Gamma Index Score for Truebeam STx ...50 Table 6.3.2: Evaluation of Irradiated Volumes Using Gamma Index Score for Cyberknife ..50
Table 6.4.1: Calculated MU values for different tumor size and various tumor location in the brain for AAA and AXB algorithms in Eclipse TPS
...51 Table 6.4.2: Calculated MU values for different tumor size and various tumor location in the brain for RT, MC and FSPB algorithms in Multiplan TPS
x
LIST OF FIGURES
Page number
Fig.4.1.2. Example of non-coplanar beams used in SRS treatments ... 8
Fig.4.1.3.1. Description of Conformity Index Value Parameters ... 9
Fig.4.1.5. Real-time tumor tracking for Cyberknife ...13
Fig.4.1.6. Control points of VMAT optimization ...15
Fig.4.1.6.1. Example of AAA dose calculation result ...17
Fig.4.1.6.2. Example of AXB Dose Calculation Result ...18
Fig.4.1.7. Multiplan Treatment Planning System ...20
Fig.5.1.3. Skull Tracking Method ...31
Fig.5.2.3.1. 4 Different PTV Volumes in Vertex Region ...35
Fig.5.2.3.2. 4 Different PTV Volumes in NC Region ...36
Fig.5.2.3.3. 4 Different PTV Volumes in PF Region ...36
Fig.5.2.5.1.Calculated dose distribution with Ray-Tracing Algorithm ...38
Fig.5.2.5.2.Calculated dose distribution with Monte Carlo Algorithm ...38
Fig.5.2.5.3. Calculated dose distribution with FSPB Algorithm ...39
Fig.5.2.6.1. Scanner Orientation ...40
Fig.5.2.8.3: Evaluation of an irradiated plan in SNC patient software; Upper left section represents dose distribution of irradiated plan, upper right section represents dose distribution of the slice of the irradiated plan, lower left section represents superposition of the both dose distributions with the best alignment, lower right section represents dose agreement graphically ...45
Fig 6.1.1: Film Calibration Curve for Truebeamstx with 6MV FFF Beam ...46
Fig 6.1.2: Film Calibration Curve for Cyberknife with 6 MV FFF Beam ...47
Fig 6.5.1: Tumors located in heterogeneous medium ...52
Fig 6.5.2: Comparison of calculated PD with AAA in Eclipse and measured using TB for all tumor size in V region ...53
Fig 6.5.3: Comparison of calculated PD with AXB in Eclipse and measured using TB for all tumor size in V region ...53
Fig 6.5.4: Comparison of calculated PD with AAA in Eclipse and measured using TB for all tumor size in NC region. ...54
Fig 6.5.5: Comparison of calculated PD with AXB in Eclipse and measured Using TB for all tumor size in NC region ...55
Fig 6.6.1: Comparison of calculated PD with RT in Multiplan and measured using CK for all tumor size in V region ...56
xi Fig 6.6.2: Comparison of calculated PD with MC in Multiplan and measured using CK for
all tumor size in V region ...56
Fig 6.6.3: Comparison of calculated PD with FSPB in Multiplan and measured using CK for all tumor size in V region ...57
Fig 6.6.4: Comparison of calculated PD with RT in Multiplan and measured using CK for all tumor size in NC region ...58
Fig 6.6.5: Comparison of calculated PD with MC in Multiplan and measured using CK for all tumor size in NC region...58
Fig 6.6.6: Comparison of calculated PD with FSPB in Multiplan and measured using CK for all tumor size in NC region...59
Fig 6.7.1 Calculated PD for small 0,6 cm tumor size in V region. ...60
Fig 6.7.2 Measured PD for small 0,6 cm tumor size in V region. ...60
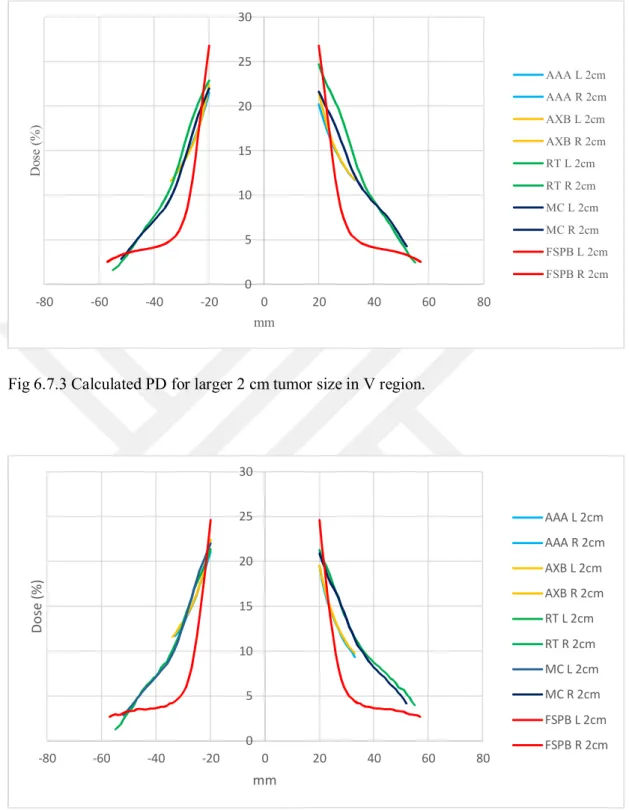
Fig 6.7.3 Calculated PD for larger 2 cm tumor size in V region. ...61
Fig 6.7.4 Measured PD for larger 2 cm tumor size in V region. ...61
Fig 6.7.5 Calculated PD for 1 cm tumor size in NC region. ...62
Fig 6.7.6 Measured PD for 1 cm tumor size in NC region. ...63
Fig 6.7.7 Calculated PD for 2 cm tumor size in NC region. ...63
xii
LIST OF PHOTOGRAPHS
Page number
Photo.4.1.1. a) Thermoplastic mask, b) Head frame ... 7
Photo.5.1.1. GEMINI TF 16 PET/CT system ...27
Photo.5.1.4. Cirs Atom Phantom ...32
Photo.5.2.1. Phantom Position During CT Simulation ...34
Photo.5.2.6.2. EBT3 Gafchromic film for calibration ...41
Photo.5.2.6.3. Scanning of Films ...42
Photo.5.2.8.1.position of film in vertex part of Phantom ...43
1
1. ABSTRACT
THE COMPARISON OF PERIPHERAL DOSE IN STEREOTACTIC BRAIN
IRRADIATION WITH THE USE OF DIFFERENT TREATMENT
TECHNIQUES
Brain stereotactic radiosurgery involves the use of precisely directed, single session radiation to create a desired radiobiologic response within the brain target with acceptable minimal effects on surrounding tissues. In this study, the comparison of peripheral dose (PD) was made for Truebeam STx and Cyberknife M6 treatment plans. For Truebeam STx, treatment planning was done using VMAT technique with 6 FFF beam in Vertex, Nasal Cavity, and Posterior fossa regions. The dose distribution was calculated using Eclipse Treatment Planning System (TPS) with AAA and AXB dose calculation algorithms. The treatment plans of the same targets were also done for Cyberknife M6 with Multiplan TPS using Ray-Tracing, Monte Carlo, and Finite Size Pencil Beam dose calculation algorithms. Using the same film batch, the net OD to dose calibration curves were obtained for plans which were done for both devices. Dose distributions of each plan for target site and its periphery were measured using EBT3 film and compared with TPS calculations. For cyberknife plans, the gamma analysis passing rates between measured and calculated dose distributions ranged between 92% and 99.9%. For Truebeam plans, the gamma analysis passing rates ranged between 93.8% and 100%. Although target dose distribution calculated more accurately by Acuros XB and Monte Carlo dose calculation algorithms, Finite Size Pencil Beam algorithm predicted dose distribution around the peripheral region of target lower than the other algorithms.
2
2. ÖZET
STEROTAKTİK BEYİN IŞINLAMALARINDA KRİTİK ORGANLARIN ALDIĞI DOZLARIN FARKLI TEDAVİ TEKNİKLERİ KULLANILARAK KARŞILAŞTIRILMASI
Beyin stereotaktik radyocerrahisi, tek fraksiyonda beyindeki bir hedefe kesin doğrulukta yönlendirilmiş radyasyonun hedefte istenilen radyobiyolojik etkiyi oluşturması ve hedefi çevreleyen dokularda oluşacak etkiyi minimal seviyede tutmayı içerir. Bu çalışmada Truebeam STx ve CyberKnife M6 cihazlarında ışınlanan tedavi planlarında periferik dozlar karşılaştırıldı. Truebeam STx cihazı için, verteks, nazal kavite ve posterior fossa yerleşimli hedefler için 6FFF foton demetleri kullanılarak VMAT tekniği ile tedavi planları oluşturuldu. Oluşturulan planların doz dağılımları Eclipse TPS’ de AAA ve AXB doz hesaplama algoritmaları kullanılarak hesaplandı. Aynı hedeflerin CyberKnife M6 cihazında ışınlanması için Multiplan TPS’ de Ray Tracing, Monte Carlo ve Finite Size Pencil Beam doz hesaplama algoritmaları kullanılarak tedavi planları oluşturuldu. Aynı seriden alınmış filmler kullanılarak her bir cihaz için “Net OD – Doz” kalibrasyon eğrileri elde edildi. Oluşturulan planların doz dağılımları EBT3 film dozimetrisi ile ölçüldü. Her bir planın hedef ve hedefin periferindeki doz dağılımları EBT3 film kullanılarak ölçüldü ve TPS hesaplamaları ile karşılaştırıldı. CyberKnife planlarında gama indeks analizi geçme oranları %92 – 99.1 aralığında oldu. Truebeam planlarının gama indeks analizi geçme oranları ise %93.8 – 100 aralığında oldu. Acuros XB ve Monte Carlo algoritmaları kullanılan diğer algoritmalara göre hedefte daha doğru hesaplama gerçekleştirirken, Finite Size Pencil Beam algoritması periferal bölgede diğer algoritmalara göre daha düşük doz dağılım hesabı gerçekleştirdi.
3
3. INTRODUCTION
Wilhelm Conrad Roentgen discovered X-rays in 1895. It was one of the major revolutions of that century. After the discovery of X-rays, it was shown that radiation could be used for diagnostic purposes. One year later, kidney stone and a penny in the throat of a child was shown by X-rays in one of the first radiology departments at the Glasgow Royal Infirmary. Hall-Edwards became one of the first people who used an X-ray to diagnose and discovered a needle embedded in a woman's hand. Scientists continued to find out how radiation works and how to measure the dose accurately between World War I and II(1).
It was eventually recognized that not only in diagnostic but also it can be used in the therapeutic field to treat malign lesions in the body. As the time progressed, especially computer and other new technologies were rapidly developed, and new treatment modalities were implemented to treat cancer patient(2). Nowadays it continues as a treatment for cancer in radiation therapy, where it is applied with strict safety precautions(3).
The primary goals of radiation therapy are to shrink tumors and kill cancer cells. The use of radiation therapy for the control of malignant diseases results in both normal and malignant tissues being irradiated and damaged. By using new radiation therapy techniques such as IMRT, Volumetric Arc Therapy or Stereotactic Radiation Therapy, we can concentrate precisely on the dose within target sparing the surrounding normal tissues(4).
Stereotactic Radiosurgery is a different aspect of radiotherapy that refers to the focused delivery of high dose in a single fraction. It works the same as another form of radiation treatment and directly affects the DNA of the tumor cells. It is essential to achieve a high conformity and steep dose gradient to reduce organ at risks exposure while using this technique. Several studies have been carried out with the aim of identifying and measuring doses to be deposited outside the treatment volume(5).
4
The peripheral dose (PD) is defined as the dose outside of the therapeutic radiation field edge. Three components affect PD. These are:
• Internally scattered radiation from within the treatment field • Leakage from the linac head
• Scattered radiation from the collimators
The amount of PD is crucial since it increases the probability of secondary cancer risk in the patient. Some anatomic sites such as breast and thyroid could be effected from the PD more than the others and result in increasing secondary cancer risk probability. Some studies have shown that radiation-induced cancer risk increases linearly with increasing dose(6).
The main purpose of this study was to investigate the accuracy of dose calculation algorithms of Eclipse and Multiplan Treatment Planning System (TPS) for out of field doses. The calculated PD were compared with that of measured by the film.
5
4. GENERAL DEFINITIONS
4.1.Stereotactic Radiotherapy
Stereotactic Radiosurgery (SRS) is a particular type of radiation therapy that is most commonly used to treat tumors in the brain in which focused type of radiation are given to stereotactically determined tumor volume in one to five treatment sessions. SRS is not a form of unlike open surgery, and there is not any incision. It can deliver exactly-targeted radiation within narrow margins in fewer high-dose treatment fractions than conventional radiation therapy which can spare as much as possible healthy tissues according to the highly sophisticated computer-based radiation delivery system by using 3D imaging(7).
SRS works by damaging the DNA of the tumor. Therefore, the affected cells then lose the ability to reproduce which causes to slow or stop tumor growth. Radiobiological principles of SRS are currently not well understood. However, attempts have been made to rationalize the delivery of a single large fraction of dose to a small circumscribed lesion in the brain(8). It has been shown that irradiation with high doses, in a single fraction causes severe vascular damage in human tumor xenografts or animal tumors(9). High dose radiation such as >10–12 Gy in a single exposure is likely to cause significant vascular damage followed by indirect cell death. Some clinical studies have demonstrated that SRS of cranial tumors with high-dose lower fractions is very effective in achieving local tumor control. Linear Quadratic Model (LQM) is one of the best models for comparing different fractionated radiotherapy protocols in conventional radiation therapy, but there have been still some discussions if this model is applicable for SRS treatments. In 2008, Brenner et all showed that LQM could be used up to 15-18 Gy, but need to be aware that it has been progressively less accurate at doses above 10 Gy(10).
6
SRS treatment steps are different than conventional radiation therapy. It needs to work precisely and accurately in all steps. Critical steps in SRS treatment are listed below:
Rigid immobilization of the patient Highly conformal dose distribution
Different type of treatment planning evaluation parameters Three-dimensional positioning accuracy
Real-time tumor tracking
4.1.1. Rigid Immobilization
Rigid immobilization of patients and accurate positioning of their targets have long been recognized as critically important aspects of quality of SRS treatment. Accurate positioning combined with strict immobilization permit reduced margins around the target, resulting in a decrease in dose to healthy tissue and a potential increase in dose to the target. The increasing use of computed tomography-based three-dimensional treatment planning programs has made highly conformal dose distributions possible, thus further emphasizing the need for accurate positioning. Special immobilization techniques for SRS treatment may allow reducing margin even zero for intracranial lesions(11). Thermoplastic mask and stereotactic head frames are commonly used for intracranial SRS treatments (Photo 4.1.1). Thermoplastic masks are the most simple and standard immobilization method in SRS treatment in all over the world. Immobilize patient with the stereotactic head frame is more rigid way than using the thermoplastic mask. Patient has local anesthesia during the procedure and frames are fixed to the cranial bone by using small screws(12).
7
Photo.4.1.1. a) Thermoplastic mask b) Head frame
4.1.2. Conformal Dose Distribution
One of the essential functions of SRS is to achieve highly conformal dose distribution. In order to get it, many steps should be done. These steps are;
Use a rigid/nonrigid immobilization device Determine accurate location of lesion
Contouring lesion and adjacent anatomy from different imaging platforms Using multiple planar/non-coplanar beam arrangement
Verify correct position of the lesion in a machine and accurately delivery of a conformal plan.
The beam geometry used in radiosurgery is very different from that used in conventional radiotherapy, in which a large number of beams spread with various angles as shown in (Fig 4.1.2). It could be obtained a very high maximum relative dose in the central part of the target and sharp dose gradients at field edges by using non-coplanar beam arrangement. A high maximum dose in the central parts of the target may be beneficial if the tumor contains anoxic, more radioresistant, cells in the central parts. A high dose in the anoxic cells will thus increase the chance of killing more the clonogenic tumor cells(13).
8 Fig.4.1.2. Example of non-coplanar beams used in SRS treatments
4.1.3. Different types of treatment planning evaluation parameter
The assessment of SRS treatment plans is entirely different from conventional ones. There are some additional criteria which must be checked to make sure if plans quality are acceptable for delivery. Also, dose constraints are entirely different from the conventional scheme because of the high dose and low fraction. The treatment planning indices which are used in SRS plan listed and discussed below:
Conformity Index Gradient Index Homogeneity Index
4.1.3.1.Conformity Index
Radiosurgical targets are typically nonspherical, except for brain metastases. Some tumors exhibit more complex shapes than others(14). One goal of radiosurgery is to design a treatment plan in which the prescription isodose line covers the target with a minimal excess volume as shown in (Fig 4.1.3.1). To facilitate comparison and to evaluate compliance with clinical trial protocols, some of the plan conformity indexes has been proposed(15). Each index takes factors such as the overlap and size of the dose and target volumes into account. Several different conformity index
9
formulas have been reported to describe the conformity of the prescription isodose to the target volume(16). Two of them are commonly used for evaluating SRS plans, these are;
Paddick Formula ICRU Formula
Fig.4.1.3.1. Description of Conformity Index Value Parameters
4.1.3.1.1 Paddick Description Paddick CI =
2 TVPIV TV PIVTVPIV=Target Volume covered by PIV TV = Target Volume
10 4.1.3.1.2 ICRU Description TV CI PTV TV=Treated volume
PTV=Planning target volume
4.1.3.2 Gradient Index
A dose gradient index (Cozzi et al.) can be utilized to analyze treatment plans with equivalent conformities. The sharp dose gradient out of the radiosurgical target is one of the variables that makes radiosurgery achievable. Thus it is reasonable to quantify this variable and utilize it to make comparison between rival treatment plans explore optimum prescription isodoses, or make comparison of treatment modalities(14). The GI is explained as the ratio of the volume of half the prescription isodose to the volume of the prescription isodose. For a plan normalized to 100% isodose line, it is the ratio of 50% isodose volume to that of 100% isodose volume. Paddick determines GI formula like below:
half
PIV GI
PIV
PIVhalf = Prescription isodose volume, at half the prescription isodose (e.g. at 25%) PIV = Prescription isodose volume (e.g. at 50%)
11
4.1.3.3 Homogeneity Index
Homogeneity Index (HI) is an objective tool to analysis the uniformity of dose distribution in the target volume. In SRS treatment, we could create heterogeneity inside target volume. It is very useful for most cases to increase target dose and creates a strict dose drop off after the boundary of a target(17). RTOG prescribed HI index like below;
MD HI
PD
MD = Maximum Dose within Target Volume PD = Prescribed Dose to the Target
4.1.4 Three-dimensional positioning accuracy
Accurate and reproducible patient setups can potentially reduce harm to critical organs during radiation treatment. Patient set-up accuracy is especially critical for high -intensity treatments, such as SRS. Linear accelerator linac-based SRS treatments have been performed for over 25 years, however, treatment verification was indigent because of invisibility of megavoltage portal images(MV) and the unavailability of high-contrast kilovoltage (kV) imaging devices in the treatment room until last decade. Cone-beam computed tomography (CBCT) imaging is a relatively new capability in the treatment room for image-guided patient treatment that can be potentially used for high-precision SRS patient setup and treatment verification(18). The initial use of daily computed tomography (CT) has been for assessing internal organ position and defining the subsequent isocenter shifts to be performed at the treatment unit. CBCT is now one of the most common tools in the clinics to determine where the tumor is and how accurately can treat patients in the linear accelerators(19).
12
Megavoltage cone-beam CT (MVCBCT) uses the treatment beam of the accelerator and its portal imaging system to provide volumetric datasets with sufficient contrast for image-guidance. High energy photon beams are used to create MVCBCT in the machine. Clinical implementation of both kV-CBCT and MVCBCT systems make users to treat the patient safer than before(19). Increasing clinical evidence suggests that 6 degrees of freedom couch used in conjunction with cone-beam computed tomography(CBCT) may reduce patient set-up errors and improve target positioning for high-dose SRS treatments(20).
4.1.5 Real-time tumor tracking
High dose is delivered within a very short time in SRS treatment. Therefore intrafraction motion of tumor in SRS is more critical than conventional therapies. In recent years, some companies have produced a different type of tumor tracking methods which encompass tumor movement during the treatment. Immobilization of cranium is easier than another part of the body, but still, real-time tumor tracking is essential(21).
Both linac and robotic systems have different types of tumor tracking systems. Linacs use kV imaging or some software to track tumors. For example, imaging system could be utilized in fluoroscopic mode during the treatment and see real time if targets are inside irradiation volume. Cyberknife uses 6D Skull tracking algorithm which has frameless tracking of bony anatomy of the skull (Fig 4.1.5)(20). Users define alignment center during treatment planning, and the system generates DRRs to correlate with acquired images within treatment delivery. During the treatment, initial alignment performed by adjusting patient and couch then corrections applied to robot throughout treatment. The system assumes fixed relationship between target, align center and bony anatomy of the skull. 6D Skull tracking algorithm correlates acquired images of skull with DRRs. Correlation is based on pixel similarity criteria. The algorithm is used for intracranial, head and neck and some upper spine(C1-2) lesions (22).
13 Fig.4.1.5. Real-time tumor tracking for Cyberknife
4.1.6 Varian Eclipse 13.0.26 Treatment Planning System
Varian's Eclipse treatment planning system optimizes a radiotherapy treatment plan based on instructions, and information about the size, shape, and location of the tumor to be treated with radiation. The treatment plan tells the radiotherapy machine how to deliver the treatment, what gantry angles to use, how much radiation dose to deliver from each angle, and how the treatment beam should be shaped to create proper dose distribution. Such a sophisticated treatment technique like Intensity Modulated Radiation Therapy, Volumetric Modulated Arc Therapy, etc. Could be easily calculated by this software. It offers users a set of treatment plan templates that make the process efficient for creating a personalized plan for each patient.
Different types of algorithm are used for dose optimization and calculation. The planning system chooses dose optimization algorithm according to treatment technique which is decided at the beginning of the treatment plan(24). Dose Volume Optimization (DVO), Plan Geometry Optimization (PGO), Progressive Resolution Optimizer (PRO) and Multi-Resolution Dose Calculation (MRDC) are used in the system.
14
The algorithm used in Eclipse IMRT, DVO, determines the optimal field shape and intensity by iteratively conforming the dose distribution to the desired objectives until an optimum solution is reached. This algorithm based on convolution-superposition principle. The DVO algorithm can use a calculated plan dose as an intermediate dose when optimizing a plan. The DVO algorithm calculates the difference between the intermediate dose and the first round optimization result and uses this difference to compensate the optimization lead to the consequent iterations(25).
PGO algorithm enables the Eclipse Beam Angle Optimization, an integrated optimization option for the Eclipse treatment planning system. Beam Angle Optimization is an automated tool for selecting the suitable beam angles based on user-defined dose-volume objectives that speed up the planning process and is performed with the PGO algorithm, which relies on the Eclipse DVO algorithm. Global optimization creates the new field geometry, which can be either coplanar or non-coplanar, depending on user-defined optimization parameters. The PGO uses a fixed isocenter, which means that all fields in the initial field distribution share the same isocenter. The initial number of fields in both geometries is controlled with a parameter. You can also control the offset for the gantry angles in the coplanar field geometry with the coplanar offset angle parameter. This parameter does not affect the non-coplanar initial field distribution. In the non-coplanar field geometry, you can enter a limit for the elevation angle of the fields from the coplanar plan. The fields in the initial field distribution do not have elevation angle values higher than the specified limit.
PRO algorithm creates VMAT (RapidArc) plans based on dose-volume objectives. VMAT fields use Dynamic MLC, variable dose rate and variable gantry speeds(23). The PRO algorithm generates a sequence of control points which define MLC leaf positions and MU/deg as a function of gantry angle. MU/deg is encoded in dicom and the Varian system database with the cumulative meter set weight, which defines the increase in MU between control points about the total MU in the field. The initial conditions for the PRO algorithm are determined using control points to
15
represent each VMAT field (Fig 4.1.6) The PRO algorithm uses multi-resolution approach to optimize the plan. It means that the dose is modeled using first a lower number of dose calculation segments that are distributed evenly in each field(25). The number of dose calculation segments increases when moving from one multi-resolution level to another.
Fig.4.1.6. Control points of VMAT optimization
MRDC algorithm is used for fast dose estimation inside the DVO, PRO and PGO algorithms to improve the optimization accuracy, which can be seen as a good agreement between the optimization Dose Volume Histograms (DVH) and the last DVHs. The high speed of the MRDC algorithm allows the optimization algorithms to perform full dose computation during each iteration(26). The MRDC algorithm is based on the convolution superposition principle, and it uses 3D convolution scattering calculation. The scattering model is based on the 3D superposition of point spread functions in the patient model. The point spread functions are built from Monte Carlo calculations.
Eclipse treatment planning system uses different algorithms during the dose calculation. These are:
16
4.1.6.1 Analytical Anisotropic Algorithm (AAA)
Analytical Anisotropic Algorithm (AAA) is immensely utilized as a part of clinical practice. The AAA dose calculation model is a 3D pencil beam convolution superposition algorithm. The algorithm has seperated models for initial photons, secondary central photons which are scattered, and electrons scattered from collimation systems. Tissue heterogeneities are considered as anisotropic in the whole 3D neighborhood using 13 lateral photons scatter kernels. The final dose distribution is obtained by superposition of the doses from the photon and electron convolution(27).
The AAA dose calculation model is comprised of two main components: Configuration Algorithm
Actual Dose Calculation Algorithm.
The configuration algorithm is utilized to obtain physical parameters needed to characterise the fulence and the energy spectra of the photons and electrons that present in the clinical beam and their essential scattering characteristics in water equivalent media (28). Even though some parameters used for the dose calculation algorithm can be derived for acceptable accuracy from basic measurements of depth dose and lateral dose profile water equivalent phantoms, in practise exprerimental determination of whole parameters is impossible. This is settled in AAA model via all pre-computed parameters using MC simulations and modificated parameters in order to agree with real measured clinical beam data in the course of beam data configurations (29). Once machine specific datas are determined according to proper procedures during the beam configuration phase, all parameters are stored. All these parameters are retrieved during the actual dose calculation process.
The broad clinical beam is divided into small, finite-sized beamlets to which the convolutions are applied. The final dose distribution in (Fig 4.1.6.1) is obtained by the superposition of the dose calculated with photon and electron convolutions for the individual beamlets. AAA accounts for tissue heterogeneity anisotropically
17
within interaction site in 3D volume. This is performed by the use of radiological scaling of the dose deposition functions and the electron density based scaling of the photon scatter kernels independently in four lateral directions(30).
Fig.4.1.6.1. Example of AAA dose calculation result
4.1.6.2 Acuros XB Algorithm(AXB)
Another important algorithm which is used in Eclipse planning system is AXB. AXB algorithm was developed to provide accurate and rapid dose calculations for treatments ranging from 4-25 MV. It utilizes advanced techniques in order to find the solution of Linear Boltzmann Transport Equation (LBTE). It also directly takes impact of heterogeneities into account of patient dose calculations (31). Diffent materials such as air, bone, lung and implants that are composing heterogeneities considerably effects the dose distribution within patient. This effect may be more important particularly when there are irregular or small fields. AXB can also obtain datas from source model of AAA and utilize them for its beam model in order to adopt it for the calculation (25). It supplies similar accuracy with MC for treatment planning in the full range of X-ray beams (Fig 4.1.6.2).
18
Fig.4.1.6.2. Example of AXB Dose Calculation Result
The LBTE is the essential equation describing macroscopic characteristic of particles when they move through a matter. For a specified portion of matter which is exposed to radiation, the solution of the equation can give the exact explanation of the dose inside the portion. There are two main way to obtain open for solution of LBTE: the first was is MC method. The second way is finding solution of LBTE with explicit numerical methods. MC and explicit LBTE are both convergent. The potential of accuracy for both ways is the same and converge on the same solution (32). But in practical terms neither of the two ways are precise and both ways generate errors. AXB of Eclipse Source Model have four constituents:
Primary Source: User defined annular or elliptic source placed on the target plane that models bremsstrahlung x-ray photons produced within the target which doesnt have interaction with the treatment head.
Extra Focal Source: Gaussian plane source placed below the flattenin filter that models x-ray photons as a result of interaction within the treatment head out of the target (primary within FF, primary collimators, and secondary jaws).
Electron Contamination: Accounts for the dose stored in build up area that is not explained by primary and extra-focal source constituents.
19
Photons Scattered From Wedge: Accounts for scattering from hard wedges. Carried out with dual Gaussian model that gaussian kernel width get bigger as the distance to the wedge increase.
The Acuros XB patient transport have four individual courses:
Transport of source model fluence into the patient Calculation of scattered photon fluence in the patient Calculation of scattered electron fluence in the patient Dose calculation
Application of courses from course 1 to course 3 is used to calculate the electron beam fulence of each voxel within the patient. When energy dependent electron fulence is solved the intended dose amount ( dose to medium or dose to water) is computed in the course 4. Only course 1 is repeated for each beam and course 2 and course 4 applied only once despite number of beams. When it comes to VMAT, each beam has important number of orientations and Course 1 will be repeated for each orientation and from course 2 to course 4 will be applied only once. In course 1 the machine sources are modeled as external sources and ray tracing is implemented for calculation of collided x-ray photon fluence and electron fluence within the patient. In course 2 and course 3 AXB decomposes in space, angle, and energy, and iteratively find the solution of LBTE. In course 4 dose of any voxel in the probem is determined by the application of an energy dependent fluence to dose response function to the local energy dependen electron fluence in that voxel (32).
4.1.7 MultiPlan Treatment Planning System
The MultiPlan Treatment Planning System is a highly interactive, workflow-based software application designed for radiosurgery and high precision radiation therapy planning. The MultiPlan System provides tools necessary to generate quality treatment plans for delivery using the CyberKnife. It enables the creation of treatment plans using all tracking algorithm which is defined in CK system. It could
20
automatically generate precise contours for intracranial and pelvic anatomy using both model-based and atlas-based delineation methods. It has a Sequential Optimization Algorithm which provides an intuitive and intelligent plan optimization algorithm for rapidly developing custom-tailored treatment plans specific to the unique clinical objectives for each patient(33).
Multiplan uses different algorithms during the dose calculation. Ray tracing is one of the common algorithms which is used Multiplan calculations except for heterogeneity areas. It is a simple pencil beam algorithm, and it calculates dose in the ray of the beam. Monte Carlo (MC) algorithm which is often considered the gold standard for dose calculation produces results in minutes. The Finite Size Pencil Beam(FSPB) algorithm for photon consists of decomposing a radiation field into small beamlets. The FSPB algorithm is based on an analytical kernel describing the dose distribution of each beamlet. The parameters of this kernel are determined from the dose of broad beams, and total dose is calculated by summing the dose contributions for each beamlet. (Fig 4.1.7)(34)
21
4.1.7.1 Beam Targeting
Treatment planning process has various step in Multiplan. After the collimator size has been selected, beams must be directed at the treatment target. The system includes three methods for beam targeting(35).
4.1.7.1.1 Isocentric Targeting
Treatment planning system permits the user to target beams isocentrically. For each defined isocenter, a single beam from each treatment robot node is directed toward the specified isocenter. For multiple or single isocenter treatments, you can reduce the treatment time by only using beams from 1 or 2 paths to treat a defined isocenter(36).
4.1.7.1.2 Conformal Targeting
Treatment planning system includes algorithms to target beams conformally based on the shape of the tumor. To select the MC Dose Calculation as the input to a conformal treatment optimization procedure, an existing optimized treatment plan based on the Ray-Tracing (RT) dose calculation algorithm must first exist.
Only those beams with at least one Monitor Unit in the treatment plan that was generated initially using the RT dose calculation algorithm will be recalculated using the MC algorithm and be available for re-optimization(36).
4.1.7.1.3 Manual Beam Placement
Treatment planning system allows the user to place beam manually if needed.
4.1.7.2 Dose Optimization Algorithm
After beam targeting process, the optimization algorithms could be chosen, and calculation step started. This is performed in the two-step process. First, candidate beams are generated, and their dose distribution is calculated. Second, the
22
relative weight of each beam is optimized by minimizing a cost function defined by the similarity of the resulting dose distribution to dosimetric and MU goals specified by the use three algorithms are available for second part of the procedure(36).
4.1.7.2.1 Simplex Optimization
Simplex optimization is a standard linear algebra method for solving optimization problems. Considering the set of beams identified with subscript j and a set of volumes of interest (VOI) identified with subscript i. For each target VOI, and organ at risk VOI system creates a formula and solve it according to which was entered(36)(35).
4.1.7.2.2 Iterative Optimization
The difficulty of impracticability was coped with the introduction of the Iterative Optimization algorithm by annuling settled restraints. In this approach, the cost capacity is calculated as a weighted sum of the maximum and minimum dose deviations from user defined goals. The optimum set of bar weights is achieved through an iterative hunt technique similar to slope plummet. Initially, each candidate beam is assigned an MU setting based on the ratio of the total dose it delivers to all points within the target volume about to all points within the patient (the larger this ratio, the greater the initial MU setting). The iterative calculation then takes the effect of increasing and decreasing the MU setting into consideration by a fixed increment of each beam in turn and retains the setting that gives the largest reduction in the cost function. When no further reduction is possible by altering any beam weight, the increment is reduced, and the process repeats. The calculation also incorporates beam retargeting, where a proportion of the candidate beams with zero MU are retargeted at areas of low dose within the target volume to form new candidate beams. In common with the Simplex calculation, though, the reliance on simultaneous optimization of multiple conflicting dose objectives requires the use of non-intuitive manual weighting factors (36)(35).
23
4.1.7.2.3 Sequentional Optimization
Optimization approaches where multiple objectives are grouped in a single cost function and optimized simultaneously. The Sequential Optimization algorithm is executed sequentially as a series of individual optimization steps. Each step performs a linear programming optimization applied to a single objective cost function, designed to correspond to a particular clinical purpose(35). The available objectives include maximization of target volume coverage by a defined dose level, target volume dose homogeneity, conformity of the dose distribution around the target volume, minimization of maximum or mean dose for critical structures, minimize the volume of critical structures that exceed a dose, maximize the volume of target structures that exceed a dose, and minimization of total monitor units. The sequence of steps is defined by the user to match the overall clinical goals(36).
4.1.7.3 Dose Calculation Algorithm
MultiPlan Treatment Planning System (Accuray) is based on inverse planning using linear optimization. Dose calculation algorithm of this treatment planning system are:
Ray-Tracing Dose Calculation Algorithm Monte Carlo Dose Calculation Algorithm
Finite Size Pencil Beam Dose Calculation Algorithm
4.1.7.3.1 Ray-Tracing Dose Calculation Algorithm
A Ray-tracing algorithm provides a fast dose calculation method based on measured beam data look up. Heterogeneity correction is performed using effective path length, and obliquity correction is carried out by casting multiple rays within each beam. The RT dose calculation algorithm uses 3 system-specific beam description comprised of data measured in water using a water phantom. Measured data are Tissue Phantom Ratio, Off-Center Ratio, and Output Factor. The effective depth is determined by summing the contribution of each voxel along the ray from
24
the source to plane containing the target voxel using the CT electron density about water(35).
4.1.7.3.2 Monte Carlo Dose Calculation Algorithm
The Monte Carlo dose calculation algorithm samples the interactions of photons entering the patient. To provide an accurate calculation of the dose deposited in the patient, sufficient photons are sampled. The algorithm includes 2 models: first, a source model that describes the distribution of the energies and second trajectories of photons exiting the linac. The patient geometry is modeled as 3D arrays of mass density and material type. Photons interact with the patient volume to form particles, such as electrons and positrons, and deposit energy. Each particle is tracked and, for each voxel, the deposition of its energy is calculated(35). The total dose recorded at each voxel is an estimate of the dose deposited by all photons in the original treatment beam. The Monte Carlo dose calculation algorithm carries out the necessary computations in a matter of minutes rather than hours without compromising dose calculation accuracy. The algorithm uses a beam commissioning procedure which requires several days of computation time to derive source model parameters automatically based on measured beam data; however, it is only performed during the commissioning process and can be broken up into a few hours at a time. The Monte Carlo dose calculation can be enabled for both fixed collimators and the Iris Collimator(34).
4.1.7.3.3 Finite Size Pencil Beam Dose Calculation Algorithm
Dose calculation for Multileaf Collimator plans is performed using a finite size pencil beam. Dose optimization for small field beamlets requires the computation of a large number of slight fields of typically a few mm to 1 cm in size. Some dose calculation methods based on analytical kernels such as FSPB were specifically designed for the purpose of beamlet-based. A beamlet corresponds to a complex fluence distribution: all particles that pass through a small rectangular opening in the field in a given plane. It becomes apparent that in the presence of collimator scatter, the fluence distribution of a beamlet depends on the position of all
25
collimators, usually multi-leaf collimators (MLCs) and jaws. Consequentially, the interpretation of a beamlet as a ‘unit fluence element’ is to some extent over-simplified, and in any case rather unwieldy for direct dose computation(34).
One of the marks of FSPB is that, can be a beam edge anywhere in the field, in particular, if the projections of organs of risks and the target overlap. Many MLC segments are used to irradiate the target volume. As a consequence, the dose, especially in the mostly shielded organs at risk, stems from out-of-field penumbra dose (leakage, scatter) to a large degree, rather than primary fluence. Here, it is essential to use the correct measure of the beam penumbra during the dose optimization to facilitate the accurate placement of dose gradients.
26
5. MATERIALS AND METHOD
5.1.Materials
This study has been done in Istanbul Medipol University Radiation Oncology Department. All the machines and other materials in this thesis belong to this institute which is listed below:
Philips Gemini TF PET/CT16
Varian truebeam 2.0 STx linear accelerator CyberKnife M6
Atom dosimetry verification phantoms Film dosimetry
PTW Farmer-type chamber TN30013 RW3 slab phantoms
5.1.1 Philips Gemini TF PET-CT 16
CT scanner is widely used in radiation oncology clinics to simulate patient anatomy and preparation of treatment plan before delivery. The Gemini TF 16 is a diagnostic imaging system for fixed or mobile installations that combine Positron Emission Tomography (PET) and X-ray (CT) system (Photo 5.1.1). The CT subsystem produces cross-sectional images of the body by computer reconstruction of X-ray transmission data. Both subsystems (PET and CT) can also be operated independently as fully functional, diagnostic imaging systems including an application of CT scanner as a radiation therapy simulation scanner. CT scanner has connectivity to Aria (Varian) Oncology Information system and Eclipse treatment planning system.
27
Photo.5.1.1. GEMINI TF 16 PET/CT system
5.1.2 Varian Truebeam 2.0 Stx Linear Accelerator
Varian has recently presented a new class of linear accelerator referred to as TrueBeam linear accelerator(TB-LINAC). This platform delivers both traditionally flattened photon beams and flattening-filter-free (FFF) photon beams. The TB-LINAC is equipped with a newly designed waveguide, carousel assembly, monitoring control, and integrated imaging systems(37).
TB-LINAC is digital in design and in energy switch that is continuously adjustable to allow more beam energies, Ionization chamber with additional segments to allow better beam monitoring of flatness (or beam profile for FFF beams) and symmetry. The dose rates can be up to 1400 MU/min for 6MV FFF and 2400 MU/min for 10 MV FFF, respectively, which can significantly reduce the beam-on time, thereby limiting the dosimetric impact of intrafraction tumor motion. TB-LINAC is capable of delivering photon beams with 6 MV, 6 MV FFF, 10 MV,10 MV FFF, 15 MV as well as electron beams(38).
Dosimetric characteristics of the TB-LINAC treatment units are systematically measured for commissioning terms of their percentage depth dose (PDD) curves, beam profiles, relative scatter factors, dosimetric leaf gaps, output
28
factors, and MLC leakage. High-resolution diode detectors and ion chambers are used to measure dosimetric data for a range of field sizes from 0.5x0.5 to 40x40 cm2.
The FFF modality has been introduced to increase dose rate and reduce leaf transmission, head scatters, and leakage radiation with the removal of the flattening filters. There is a noticeable dose reduction outside of the field in FFF beams compared to FF beams, which can improve the target conformity and have sharper dose drop-off to limit radiation to distant organs(30). However, to achieve uniform dose to the tumor, in particular for the large tumors, it needs the distance-dependent modulation, since the intensity of the beam decreases sharply with the off-axis distance. This could increase MU and offset the advantage of using FFF beams(38).
Both Millenium and High Definition Multileaf Collimator (HDMLC) with 120 leaves can be installed on TB-LINAC. The tongue and groove and rounded leaf edges of Millennium MLC are still used in the updated design. In new design HDMLC, innermost 32 pairs of tungsten leaves are 2.5 mm wide, and the 28 outer pairs of leaves are 5.0 mm wide, as projected to isocenter. When the HDMLC is in use, irregularly shaped fields up to 40 cm wide and 22 cm long can be generated. Both dynamic and conformal arc treatments can be used with the TrueBeam STx, as well as static and step and shoot treatments(29).
Patient respiratory motion is monitored using an integrated 3D tracking system consisting of a stereo-view infrared video camera installed above the couch. A respiratory signal obtained from the RPM™ system (Varian Medical Systems, Inc) showing the vertical motion of an optical marker is placed on a patient's chest wall versus time(39).
Truebeam offers different types of treatment modality for the patients. Dynamic Conformal Arc(DCA), Intensity Modulated Radiation Therapy(IMRT) and Volumetric Arc Technique(VMAT) are commonly used in stereotactic treatments in Truebeam. Treatment is delivered continuously as the gantry rotates around the patient in DCA technique. However, during this rotation, the leaves simply conform to the shape of the target. IMRT is an advanced form of three-Dimensional
29
conformal radiotherapy (3DCRT). It uses sophisticated software and hardware to vary the shape and create the intensity of radiation delivered to different types of tumor in the body. VMAT is a different type of IMRT. The machine rotates around the patient and continuously reshapes and changes the intensity of the radiation beam. MLC is used to create a beam intensity according to tumor shapes(40).
5.1.3 CyberKnife M6
The CyberKnife (CK) Robotic Radiosurgery System is a medical device designed for SRS and SBRT treatments. It enables the delivery of radiation from multiple beams with stereotactic precision provided by image guidance. Throughout the treatment, target localization is achieved by automatic registration of two orthogonal live X-ray images with a library of digitally reconstructed radiographs generated from the patient’s planning CT. There are different types of image registration methods in CK. Image registration has been used by gold markers which are implanted in soft tissue such as prostate cancer, however, skull or vertebral bodies based on bony anatomical landmarks and for lung tumors center of mass of lung lesions are used(41).
Cyberknife consist of a linac mounted on a robot. The robot has an arm which can move 6 degrees of freedom. The robot corrects translation errors. Rotational errors are displayed on the monitor and can be fixed by rotating the treatment couch. In a typical CK plan, hundreds of nonisocentric and noncoplanar radiation beams are pointed to the target, creating a highly conformal dose distribution with sharp dose drop-off at its periphery and low dose to adjacent organs at risk (OARs)(33). These characteristics make CK an ideal machine for treatments that require high spatial accuracy and high conformity, such as SRS and SBRT treatments. Targeting accuracy is within 1 mm for both static targets such as cranial or spinal tumors, as well as dynamic targets such as lung tumors. High targeting accuracy allows smaller planning target volume (PTV) margins(21)(42).
30
The treatment delivery system consists of a 6 MV linear accelerator mounted on a robotic arm that can deliver radiation from hundreds of robot positions spaced uniformly around the target. Three types of collimator system are used to control beam size. Fixed collimator system and a variable aperture Iris collimator, both with the choice of 12 circular beams of diameters ranging from 5-60 mm. Fixed collimators can be changed to vary the beam size as generated by the treatment plan. For each fixed collimator, the manipulator traverses a separate path. The Iris Collimator creates beams with characteristics virtually identical to those of fixed collimators. It consists of two banks of 6 tungsten segments each with each bank forming a hexagonal aperture. The two are offset by 30˚ about each other resulting in a dodecahedral (12-sided) aperture when viewed from one end of the collimator to the other. Incise MLC system is newly introduced in the latest model of CK. The MLC includes 52 flat-sided leaves, each of which is 90 mm tall and projects 3.85 mm width at the nominal treatment distance of 800 mm SAD. The design allows full overtravel and unrestricted interdigitation It is a secondary collimator whose aperture is adjustable under computer control. Using tungsten leaves to adjust the aperture rapidly, the MLC can deliver variable shaped beams from each LINAC position. Leaf position is determined by primary motor encoders and is checked with a secondary optical camera system. It is exchangeable with the alternate fixed and variable circular aperture collimator systems(43).
The algorithm which is used to treat intracranial tumors called Skull Tracking Algorithm in CK. It is a frameless tracking of bony anatomy of the skull. It can be used intracranial, head and neck and some upper spine lesions. The system assumes fixing the relationship between target align center and bony anatomy of the skull. The user defines align center during treatment planning. The system generates DRRs to correlate with acquired images during treatment delivery. The correlation as based on pixel similarity criteria. The corrections are applied to robot throughout treatment. (Fig 5.1.3)
31
Lesions which are located in the body (except brain/head and neck), target tracking can be carried out different types of a tracking system. Fiducials could be used for soft tissue tumors. X-Sight Spine Tracking System can be used for targets in the spine. For moving targets, X-Sight Lung Algorithm utilized with Synchrony Respiratory Tracking System. The Synchrony Respiratory Tracking System continuously synchronizes treatment beam delivery to the motion of a target that is moving with respiration.
Fig.5.1.3. Skull Tracking Method
5.1.4 Atom Dosimetry Verification Phantoms
CIRS ATOM phantoms are a full line of an anthropomorphic phantom. It is a cross-sectional dosimetry phantom and possible to investigate organ dose, whole body effective dose or verification of delivery of therapeutic radiation doses. Phantom is sectional in design with traditional 25 mm thick sections. The sectional surfaces are extremely flat and smooth and do not require any special coatings or treatment. Tissue-equivalent epoxy resins are used in all aspects of the phantom.
32
CIRS technology offers superior tissue simulation for Dosimetry Verification Phantoms by covering a wider range of energy levels from diagnostic to therapeutic. Also, all bones are homogeneous, average bone composition. CIRS bone formulations offer distinct advantages over natural skeletons and other types of simulated bone. (Photo 5.1.4)
Photo.5.1.4. Cirs Atom Phantom
5.1.5 Film Dosimetry
The film we used for this study was GAFCHROMIC EBT3 (Lot number 11031501). Dimensions of each sheet were 20.3 × 25.4 cm2. The development in EBT3 is the symmetric structure which can prevent the possible errors in measurements of optical density due to scan side in EBT2. GAFCHROMIC EBT3 radiochromic dosimetry film is composed of a single active layer, 27 μm thickness, comprising the active constituent, marker dye, stabilizers, and other admixtures that makes the film’s energy dependence low. The yellow marker dye reduce the ultraviole or light sensitivity and used together with an Red Green Blue film scanner which allows advantage of multichannel dosimetry. The active layer is placed between two, 120
33
μm thick transparent polyester substratums; the symmetric structure excludes the requirement of side selection of the film according to light source of the scanner. The polyester substratum has a particular surface consisting microscopic silica particles which creates a gap between the film surface and the glass window in a flatbed scanner. When this gap is about 10 times of visible light’s wavelength it will prevent the flatbed scanner to form Newton’s Rings interference patterns in acquired images.(49)
5.1.6 PTW Farmer Type Chamber TN30013
The 30013 Farmer chamber is the standard ionization chamber for absolute dose measurements in radiation therapy. Correction factors needed to determine absorbed dose to water or air kerma are published in the various dosimetry protocols. Its waterproof design allows the chamber to be used in water or solid state phantoms. The product’s type is vented cylindrical ionization chamber, and its Sensitive Volume is 0.6 cm3. The type of central electrode is Aluminum, and the acrylic walls are made of graphite(50)(51).
5.1.7 RW3 Slab Phantoms
The slab phantom is designed for the use with photon radiation. The phantoms are used for monitor unit calibration and quality assurance measurements. Depth dose measurements are made by varying the measuring depth. The size of the complete phantoms is 30 cm x 30 cm x 30 cm. Adapter plates for some of the detector types are available for the Phantom. Each plate is precisely machined to a thickness tolerance of only ± 0.1 mm(52).
34
5.2. METHOD
5.2.1 A CT Simulation of the Phantoms
Head of CIRS phantom was used in this study. The thermoplastic mask was used to eliminate potential submillimetric movement of head phantom during the scan. Also, Portrait Type-S™ mounted to couch to prevent movement during the procedure. Initial alignment was conducted by manually aligning the built-in planar positioning lasers, to intersect at the phantom’s brain center (Photo.5.2.1) Once positioning was satisfactory, a full helical CT scan of the head at 120 kVp and 500 mA at 1,25 mm increments was performed. A total of 250 images were collected in a time of 46 seconds through a 17.5 mm cone beam, and the thickness of the slices are 1mm. 3D image is created from the reconstruction of x-ray images acquired during the simulation(53).
35
5.2.2 Exporting Data into the Treatment Planning System
The imaging DICOM data from the CT scan was then sent to the Varian Medical Systems, Inc. (Palo Alto, CA) Eclipse treatment planning system 13.0. This system allowed for the automatic identification of the scanned object in all three planes: axial, coronal, and sagittal. Once the appropriate body contour had been identified, the center of the dosimeter was set to the origin of the planes
5.2.3 Contouring
In the planning process of SRS, Gross Tumor Volume (GTV)/Clinical Target Volume (CTV) are determined by the physician. GTV was contoured in all cases and to account for set-up errors the 0.1cm margin was added to create PTV for simulating real patient situation. Because of single fraction and rigid frame fixation, uncertainties are thought to be close to zero in all our cases.
Brain part of Phantom was divided into three section in this study called Vertex (V), Nasal Cavity(NC) and Posterior Fossa(PF) regions. Vertex region was chosen because of the thinner region of cranium and beams passes very short distances to create conformal dose distribution. NC was chosen due to the heterogeneity of that region and to see the accuracy of the TPS for calculating dose distribution in heteregeneous medium. And at last the reason for choosing PF is the proximity of critical organs in that region, and some beams passes longer distances (especially in CK) to produce high conformity in the tumor. In every region, 4 PTV was contoured in Eclipse Treatment Planning System with the diameter of 3cm, 2cm, 1cm, 0.6cm as shown in photo (Fig 5.2.1-3).
36 Fig.5.2.3.2. 4 Different PTV Volumes in NC Region
Fig.5.2.3.3. 4 Different PTV Volumes in PF Region
5.2.4 Treatment Planning in Eclipse Treatment Planning System
12 PTV was created for 3 different anatomical sites in the brain. 5 Gy dose was prescribed for all tumors. Prescription dose was slightly lower than real SRS dose in order not to exceed linear dose response of EBT Gafchromic EBT3 films. 6FFF photon beam with 1400 MU/min dose rate was used in all plans. VMAT treatment delivery technique was employed in all TB plans. After arcs had been placed by designating the couch angles and gantry angles without the risk of collision, the jaw positions and collimator angles of each arc were adjusted to cover the combined PTV. To minimize the impact of interleaf leakage and tongue and Groove effect, the collimator angles were set to non-zero values and adjusted to