Abstract. The electrodeposition of CdS and CdTe is in-vestigated to improve the stoichiometric properties of CdS/CdTe layers on ITO-glass substrates for solar cell ap-plications. X-ray photoelectron spectroscopy is utilized for the characterization of the CdS and CdTe layers. The influence of the electrodeposition potential, the pH and the thiosulfate concentration on the stoichiometry of CdS and CdTe layers are discussed.
Introduction
Thin films of CdS/CdTe can be used in solar cells with ac-ceptable efficiency and costs because of their optimal band-gap of 1.45 eV [1.2]. Methods of preparation of such thin films include vacuum evaporation, sublimation, spray pyrolysis, molecular beam epitaxy, as well as, elec-trodeposition. However, for thin film applications large area production methods are needed to achieve significant saving in fabrication costs. Electrodeposition is such a technique and some properties of electrodeposited CdTe based solar cells have been published [3–5]. Influence of the electrodeposition potential on the optical, photoelec-trochemical and structural properties of deposited CdTe has been described [6]. The aim of the present study is to investigate the stoichiometry of the electrodeposited CdS and CdTe on an ITO glass electrode using X-ray photo-electron spectroscopy (XPS).
Experimental
Electrochemical measurements were done using a double wall thermostated cell at 90° C. The working electrode was a rotating
ITO-glass electrode, the counter electrode was a gold layer and for reference a saturated calomel electrode (SCE) was used. Cyclic and programmed potential voltammetry were used throughout this study. CdS is cathodically deposited from a solution containing 0.2 mol/l CdCl2and S2O32–, the concentration of which is varied from
0.01 to 0.05 mol/l. Deposition potentials of –0.6 and –0.7 V/SCE and pH values of 2 and 4 were used. CdTe films were deposited at –0.5 and –0.65 V/SCE using aqueous 0.001 mol/l CdSO4 and
0.0003 mol/l TeO2electrolytes at pH = 2 for 30 min. In some cases
CdTe is deposited after initial deposition of CdS on ITO. XPS measurements were performed on a KRATOS ES 300 spectrome-ter using AlKαexcitation (hν= 1486.3 eV). The C1s line (binding energy (B.E.) = 285.0 eV) from the residual hydrocarbons de-posited on the surface of the sample was used as reference with an overall accuracy of 0.1 eV in binding energies. The samples were investigated after heat treatment at 400° C for 10 min.
Results
Figure 1 displays part of the photoelectron spectra of the indium-tin-oxide (ITO) glass before and after
electro-Șefik Süzer · Șana Kutun · Figen Kadırgan
Electron spectroscopic investigations of CdS
and CdTe electrochemically coated on glass
Fresenius J Anal Chem (1996) 355 : 384–386 © Springer-Verlag 1996
Received: 25 September 1995 / Accepted: 26 October 1995
P O S T E R
Șefik Süzer(Y)
Chemistry Department, Bilkent University, 06533 Ankara, Turkey
Șana Kutun · Figen Kadırgan
Chemistry Department, Istanbul Technical University, 80286 Maslak, Istanbul, Turkey
Fig. 1 AlKαX-ray photoelectron spectra of ITO glass before and after coating with CdS and CdTe
385
chemical coating with CdS and CdTe. The most promi-nent features belong to the strong 3d and 4d photolines of Cd, In, Sn and Te as well as others like the O1s, C1s, Cl, S and Si 2s and 2p photo and Na Auger lines. Binding en-ergies of Cd in all cases are close to that of the +2 and those of Cl to the –1 oxidation states. For both S and Te, however, two peaks with varying intensity are observed. The lower binding energies at 162.2 and 573.2 eV can be assigned to S2–and Te2–, respectively, but the higher ones
at 169.0 and 577.0 correspond to SOx2–and TeOx2–(x = 3 or 4), respectively. As can be inferred from the figure, in the case of CdS coated glass no feature (except maybe for the Na Auger line) belonging to the ITO glass surface can be observed. In the CdTe case, however, features of ITO are still observable. Quantitative information can be ob-tained from the observed intensities using the formula [7]: [A]/[B] = (IA/IB) × (σB/σA) × ((Ek(B)/Ek(A))3/2 where I represents the observed intensity as calculated from the area of the peak, σis the tabulated photoelectron cross sec-tion [8] and Ekis the kinetic energy (1486.3 – B.E.). Al-though any line corresponding to an element can be used for this calculation, large uncertainties may result if the photo-electron lines are very far apart (large kinetic energy differ-ences) and/or if their cross-sections are widely different.
Thiosulfate ions disproportionate in acidic solutions affecting the deposition of CdS according to: Cd2+ + S2O32– + 2e– → CdS + SO32–. A voltammetric curve of CdS coated on ITO at –0.7 V and pH = 4 is shown in Fig. 2. The anodic peak at 0.3 V (which does not depend on pH and/or deposition potential) corresponds to the oxida-tion reacoxida-tion: CdS + 4H2O →Cd2++ SO42–+ 8H++ 8e–. Figure 3 shows the region of the photoelectron spectra where Cl, S 2s and 2p peaks and Cd and In 4d peaks are present for the various CdS coated glasses obtained under different pH, deposition potential, and concentration of S2O32–. Other preparation parameter as concentrations, deposition times etc. are the same for all these samples. Table 1 gives the data obtained from the spectra of these and other samples as well as the calculated atomic ratios using Cl 2p, S 2p and Cd 4d lines. As it can be inferred from the figures and Table 1 the surface composition is never free of Cl–but nearly a stoichiometric CdS surface is obtained at pH = 4 and –0.6 V. Figure 4 shows the Te, Sn, In, and Te 3d and S 2p regions of the CdTe and CdS + CdTe coated glasses. Since the photoelectron cross sec-tion as well as the binding energies are close to each other, the 3d photolines of Te, Sn, In and Cd are used for the cal-culation of the atomic ratios in Table 2. For S again the 2p lines are used.
Table 1 XPS data of CdS coated on ITO glass under different pH, deposition potential and thiosulfate concentrations
Conditions Binding energy (eV) (Area) Area ratio Atomic ratio Formula
O1s Cd3d5/2 Cl2p S2p Si2p Cd4d Cl2p/ S2p/ Cl/Cd S/Cd Cd4d Cd4d pH = 4, E = –0.6 V 532.8 405.8 199.3 162.3 99.4 11.9 0.788 0.311 0.80 0.41 CdS0.41Cl0.80 0.01 mol/l S2O32– (8 337) (80 549) (7 841) (3 100) (804) (9 951) pH = 4, E = –0.6 V 532.8 405.6 199.1 162.2 101.2 11.8 0.403 0.566 0.41 0.75 CdS0.75Cl0.41 0.05 mol/l S2O32– (11 203) (23 039) (1 158) (1 628) (526) (2 877) pH = 4, E = –0.7 V 532.7 405.4 199.0 162.1 100.3 11.8 0.264 0.504 0.27 0.67 CdS0.67Cl0.27 0.05 mol/l S2O32– (9 679) (63 200) (2 382) (4 549) (439) (9 023) pH = 2, E = –0.6 V 532.7 405.9 199.4 162.4 101.8 11.8 1.125 0.310 1.14 0.41 CdS0.41Cl1.14 0.01 mol/l S2O32– (6 692) (40 427) (5 429) (1 496) (447) (4 827) pH = 2, E = –0.6 V 532.7 405.6 198.7 162.3 102.4 11.9 0.426 0.508 0.43 0.67 CdS0.67Cl0.43 0.05 mol/l S2O32– (8 934) (65 795) (3 905) (4 655) (414) (9 167) pH = 2, E = –0.7 V 532.7 405.8 199.1 162.2 99.9 12.0 0.754 0.454 0.76 0.60 CdS0.60Cl0.76 0.05 mol/l S2O32– (11 662) (57 898) (5 561) (3 350) (128) (7 378)
Fig. 2 Voltammetric curve of
CdS coated on ITO glass elec-trode at pH = 4 and E = –0.7 V/MSE
Fig. 3 0–250 eV region of the photoelectron spectra of CdS coated
on ITO at various pH, deposition potential and thiosulfate concen-trations
386
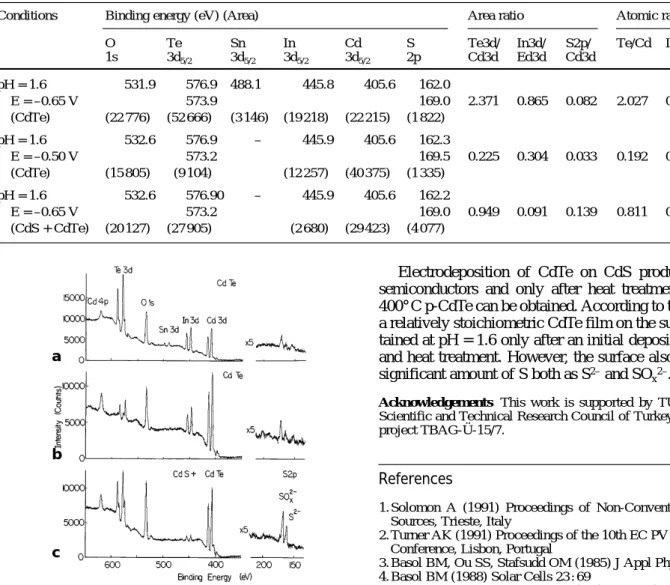
Electrodeposition of CdTe on CdS produces n-type semiconductors and only after heat treatment in air at 400° C p-CdTe can be obtained. According to these results a relatively stoichiometric CdTe film on the surface is ob-tained at pH = 1.6 only after an initial deposition of CdS and heat treatment. However, the surface also contains a significant amount of S both as S2–and SO
x2–.
Acknowledgements This work is supported by TUBITAK, the
Scientific and Technical Research Council of Turkey, through the project TBAG-Ü-15/7.
References
1. Solomon A (1991) Proceedings of Non-Conventional Energy Sources, Trieste, Italy
2. Turner AK (1991) Proceedings of the 10th EC PV Solar Energy Conference, Lisbon, Portugal
3. Basol BM, Ou SS, Stafsudd OM (1985) J Appl Phys 58 : 3809 4. Basol BM (1988) Solar Cells 23 : 69
5. Morris GC, Tottszer A, Das SK (1991) Forum 15 : 164
6. Kampmann A, Cowashe P, Vedel J, Lincot D (1995) J Elec-troanal Chem 387 : 53
7. Chastain J (1992) Handbook of X-Ray Photoelectron Spec-troscopy, Perkin-Elmer Co.
8. Scofield JH (1976) J Elect Spect 8 : 129
Table 2 XPS data of some CdTe coated ITO glasses
Conditions Binding energy (eV) (Area) Area ratio Atomic ratio
O Te Sn In Cd S Te3d/ In3d/ S2p/ Te/Cd In/Cd S/Cd
1s 3d5/2 3d5/2 3d5/2 3d5/2 2p Cd3d Ed3d Cd3d pH = 1.6 531.9 576.9 488.1 445.8 405.6 162.0 E = –0.65 V 573.9 169.0 2.371 0.865 0.082 2.027 0.820 0.728 (CdTe) (22 776) (52 666) (3 146) (19 218) (22 215) (1 822) pH = 1.6 532.6 576.9 – 445.9 405.6 162.3 E = –0.50 V 573.2 169.5 0.225 0.304 0.033 0.192 0.288 0.293 (CdTe) (15 805) (9 104) (12 257) (40 375) (1 335) pH = 1.6 532.6 576.90 – 445.9 405.6 162.2 E = –0.65 V 573.2 169.0 0.949 0.091 0.139 0.811 0.086 1.23 (CdS + CdTe) (20 127) (27 905) (2 680) (29 423) (4 077)
Fig. 4 a–c Parts of the photoelectron spectra of CdTe coated on
ITO at pH = 1.6, deposition potential a –0.65 V, b –0.50 V, c –0.65 V after an initial deposition of CdS, the y-axis in the region be-tween 0–250 eV is multiplied by 5 for better comparison
a
b