Journal of Parenteral and Enteral Nutrition
Volume 38 Number 8 November 2014 960 –965 © 2014 American Society for Parenteral and Enteral Nutrition DOI: 10.1177/0148607113517266 jpen.sagepub.com
hosted at online.sagepub.com Brief Communication
Clinical Relevancy Statement
Malnutrition is common in maintenance hemodialysis (MHD) patients and adversely affects their prognosis. Most patients on dialysis have a lower than normal dietary energy and protein intake. Renal-specific oral nutrition supplements (RS-ONS) are required to achieve intake recommendations. The present study clearly indicates that long-term RS-ONS improves the nutrition status of MHD patients with malnutrition.
Introduction
Malnutrition is common in patients with chronic kidney dis-ease (CKD) and adversely affects their prognosis.1-3
Some patients on dialysis have a lower than normal dietary energy intake (DEI) and dietary protein intake (DPI), and oral nutrition supplements (ONS) are required to achieve intake rec-ommendations.4 Clinical guidelines and literature reviews sup-port enteral nutrition (EN) in patients with renal failure who were diagnosed with malnutrition,5 but there is no consensus on the type, time of initiation, or duration of use. In addition, the benefit of renal-specific ONS (RS-ONS) support in patients without clinical evidence of malnutrition is still unclear.
There are limited ONS clinical trials for dialysis patients.6-14 In most of these studies, enteral therapy was associated with
improved nutrition status. The aim of this study was to evalu-ate the nutrition effects of RS-ONS on various outcomes in maintenance hemodialysis (MHD) patients. Based on the hypothesis that daily RS-ONS would prevent or reduce further deterioration of nutrition status of these patients, the present study was designed to compare the effects of RS-ONS and a standard recommended nutrition regime on biochemical and nutrition markers in malnourished patients with CKD on MHD.
From 1Department of Nephrology, Baskent University Faculty of
Medicine, Ankara, Turkey.
Financial disclosure: Funding for editorial support was provided by an educational grant from Abbott, Turkey (ANITR-12-ANCL009). Abbott had no input into the design of the study or interpretation of results. Received for publication September 10, 2013; accepted for publication November 25, 2013.
This article originally appeared online on January 16, 2014. Corresponding Author:
Siren Sezer, MD, Department of Nephrology, Baskent University Faculty of Medicine, 5. Sokak No: 48 06490 Bahcelievler-Ankara, Turkey. Email: [email protected]
Long-Term Oral Nutrition Supplementation Improves
Outcomes in Malnourished Patients With Chronic Kidney
Disease on Hemodialysis
Siren Sezer, MD1; Zeynep Bal, MD1; Emre Tutal, MD1; Mehtap Erkmen Uyar, MD1;
and Nurhan Ozdemir Acar, MD1
Abstract
Background: There is no consensus on the type, time of initiation, or duration of use of enteral nutrition in patients with chronic kidney disease (CKD). This study aimed to compare the effects of a renal-specific oral nutrition supplement (RS-ONS) and a standard recommended nutrition regime on biochemical and nutrition markers in malnourished patients with CKD on hemodialysis. Methods: Sixty-two malnourished patients with CKD, divided into experimental (RS-ONS; n = 32; mean [SD] age, 62.0 [11.3] years; 55.2% female) and control (CON; n = 30; mean [SD] age, 57.2 [12.3] years; 31% female) groups, were evaluated for anthropometric, biochemical, and inflammatory parameters. Results: Mean (SD) serum albumin levels were significantly increased in the RS-ONS group from 3.5 (0.3) g/ dL at baseline to 3.7 (0.2) g/dL at 6 months (P = .028). Significantly fewer patients had serum albumin levels of <3.5 g/dL after month 6. Dry weight of patients significantly increased in the RS-ONS but decreased in the CON groups (P < .001 for each). Percent change from baseline revealed negative results for bioelectrical impedance analysis (P < .001) in the CON group. Malnutrition inflammation score at 6 months (P = .006) and erythropoietin (EPO) dose requirements were higher in the CON group (P = .012). Conclusions: Our findings indicate that consuming RS-ONS improves serum albumin and anthropometric measures, as well as reduces EPO dose, in patients with CKD. (JPEN J Parenter Enteral Nutr. 2014;38:960-965)
Keywords
Materials and Methods
Study Population
Among 286 MHD patients, 62 who were diagnosed as mal-nourished (serum albumin concentration <4 g/dL and/or a loss of ≥5% dry weight [DW] over the past 3 months) were fol-lowed up for 6 months between January and July 2011. Exclusion criteria were as follows: acute infection; chronic inflammatory disease of unknown origin; recent surgery within 3 months or during follow-up; hospitalization, major cardio-vascular event, or death during follow-up; nephrotic syndrome; malignancy history; and chronic liver disease.
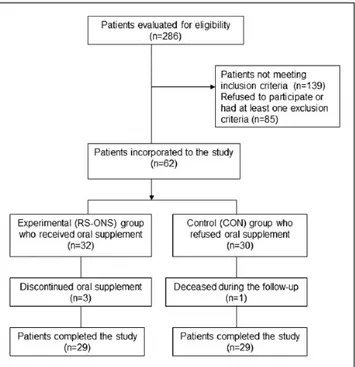
All inpatients were recommended to use ONS. Nutrition data of patients who agreed to use ONS (n = 32; RS-ONS study group) and those who chose to increase their dietary intake instead (n = 30; control [CON] group) were analyzed (Figure 1). Twenty-nine patients in each group completed the study. Demographic data were obtained from patient files.
Each serving (200 mL) of RS-ONS preparation (Nutrena; Abbott Nutrition, Zwolle, Holland) contained 400 kcal, 14 g protein, 41.3 g carbohydrate, and 19.2 g fat and had lower con-centrations of sodium, potassium, and phosphorus than standard ONS. In the RS-ONS group, 24 patients took 2 daily servings of RS-ONS, whereas 5 patients took 3 daily servings for 6 months. At each dialysis session, RS-ONS consumption and compliance were recorded. A snack providing approximately 300 kcal, 14 g protein, 55 g carbohydrate, and 10 g fat was served to patients during the sessions. Each patient consulted monthly with a dieti-tian to achieve the target calorie intake of 35 kcal/kg/d.
Written informed consent was obtained from each subject following a detailed explanation of the protocol of the study conducted in accordance with the ethical principles stated in the Declaration of Helsinki and approved by Baskent University Institutional Review Board (project no. KA11/253).
Anthropometric Measurements
DW and intradialytic weight gain (IDWG) were measured at every MHD session, and monthly average for each patient was recorded. Body mass index (BMI) was calculated at the begin-ning and end of follow-up period. Triceps skinfold thickness (TSFT)15 was measured from the arm without an arteriovenous fistula and at half-distance between the acromion and the olec-ranon with a Harpenden caliper (Holtain, Chymycin, UK). Anthropometric and bioelectrical impedance analysis (BIA)16 measurements were performed within 30 minutes after dialy-sis. Body composition (fat mass [FM], fat-free mass [FFM], muscle mass [MM], and bone mass [BM]) was measured using the Tanita BC-420MA Body Composition Analyzer (Tanita, Tokyo, Japan). For the BIA measurements, the subject stood upright with bare feet on the analyzer footpads. The impedance between the feet was measured while an alternating current (50 kHz and ~200 µA) passed through the lower body. FM, FFM, MM, and BM were computed with this impedance value.
Clinical and Biochemical Measurements
Predialysis serum concentrations of hemoglobin; creatinine; intact parathyroid hormone; total, low-density lipoprotein (LDL), and high-density lipoprotein (HDL) cholesterol; tri-glyceride; serum albumin; C reactive protein (CRP); and trans-ferrin saturation levels were assessed and mean erythropoietin dose received was recorded monthly. Each patient’s malnutri-tion and inflammamalnutri-tion score17 (MIS), which was created using the 7 components of the conventional Subjective Global Assessment (SGA) and combined with 3 new elements—body mass index (BMI), serum albumin, and total iron-binding capacity (TIBC) and normalized protein catabolic rate18 (nPCR)—were calculated at baseline and at the end of the follow-up.
Statistical Analysis
Statistical Package for Social Sciences (version 14.0; SPSS, Inc, an IBM Company, Chicago, IL) was used. The sample size of the study was based on the MHD patients (n = 286) in our center. Data were submitted to a frequency distribution analy-sis by the Kolmogorov-Smirnov test. Values displaying normal distribution were expressed as mean (standard deviation [SD]), and values with skewed distribution were expressed as median (interquartile range [IQR]). No method was defined for miss-ing data. Normally distributed numeric variables were ana-lyzed by independent samples t or 1-way analysis of variance
Figure 1. Study flowchart. RS-ONS, renal-specific oral nutrition supplement.
(ANOVA) (post hoc Tukey) tests according to distribution nor-mality. Skew distributed numeric variables were compared using Mann-Whitney U and Kruskal-Wallis tests according to distribution normality. Related data were compared with paired samples t or Wilcoxon tests. Categorical data were compared by χ2 test, and P < .05 was considered statistically significant.
Results
Baseline Characteristics
Mean (SD) age in the RS-ONS group was 62.0 (11.3) years (55.2% female) in the RS-ONS group and 57.2 (12.3) years (31% female) in the CON group. No significant differences were found in age, sex, duration of MHD, basal urea reduction ratio (URR), MIS, and BMI (Table 1).
Biochemical Findings
Mean (SD) levels of serum albumin were significantly increased in the RS-ONS group from 3.5 (0.3) g/dL at baseline to 3.7 (0.2) g/dL at 6 months (P = .028) but not changed in the CON group. Serum albumin levels at 6 months were signifi-cantly higher in the RS-ONS group compared with the CON group (3.7 [0.2] vs 3.5 [0.3] g/dL; P = .012) (Table 2).
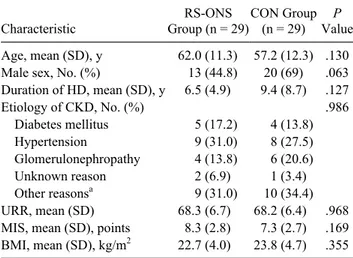
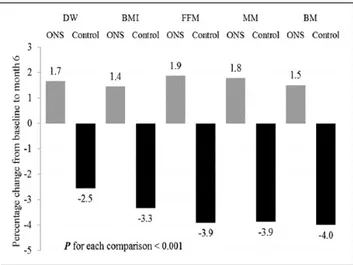
Following RS-ONS initiation, there was a significant increase in serum albumin from months 1–6 (P = .012) (Figure 2). Although RS-ONS and CON groups were similar in terms of the percentage of patients with serum albumin levels <3.5 g/dL at baseline (48.3% vs 58.6%, respectively; P = .430), the
RS-ONS group had significantly fewer such patients at month 6 compared with the CON group (17.2% vs 48.3%; P = .012) (Figure 3).
Considering lipid only, mean (SD) serum LDL-cholesterol levels were higher in the RS-ONS group (93.4 [30.1] mg/dL) at the end of the study (P = .028) but still within normal limits (<160.0 mg/dL). The CON group had a significant accretion in mean (SD) transferrin saturation ratios from 36.8% (26.7%) at baseline to 55.6% (48.1%) at month 6 (P = .049). Dialysis adequacy did not differ between groups at any time (P = .968 and P = .567, respectively) (Table 2).
Anthropometrical Measurements
At baseline, DW in the RS-ONS group was significantly lower than that in the CON group (P = .034), but at 6 months, a sig-nificant increase in the RS-ONS but a decrease in the CON group was observed (P < .001 for each) (Table 2).
BMI of the 2 groups was similar at baseline (P = .355); the CON group exhibited a significant decrease from baseline to month 6 (P < .001), while BMI remained stable in the RS-ONS group. The RS-ONS group’s TSFT significantly increased at the end of the study, but the CON group had a significant decline from 12.6 (5.4) to 11.3 (5.5) cm (P < .001 for both). At baseline, the CON group had significantly higher levels of FFM, MM, and BM. During the 6 months of the study, FFM, MM, and BM remained stable in the RS-ONS group while the CON group experienced significant declines in all (P < .001 for each) (Table 2).
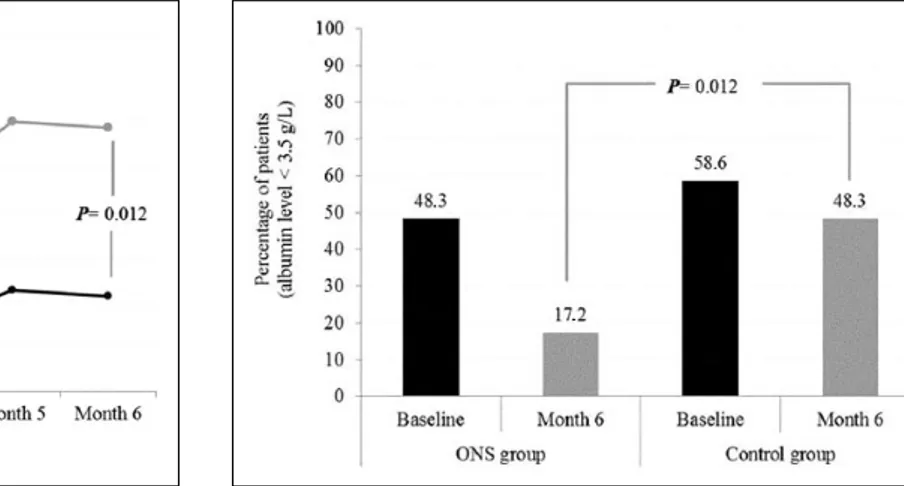
Percent changes from baseline values in DW, BMI, and BIA measurements, including FFM, MM, and BM, were negative in the CON group (P < .001 for each) (Figure 4).
Malnutrition and inflammation scores were similar in both groups at baseline (P = .682) but increased significantly in the CON group at month 6 (P = .006) while remaining stable in the RS-ONS group. nPCR was similar between the 2 groups at baseline (P = .487). Although there were numerical decreases in the nPCR level during the study period in the CON group, the change did not reach statistical significance (P = .097). Although hemoglobin levels of both groups did not show sta-tistically significant changes during the study, the CON group required significantly higher erythropoietin doses compared with the RS-ONS group (P = .012) to maintain steady hemo-globin levels (Table 2).
Adverse Events
The most frequent adverse events in the RS-ONS group were digestive symptoms, mainly diarrhea, nausea, and abdominal distention, as observed in 5 patients. They were recommended to decrease the dose of RS-ONS to 1 can/d, and in 3 cases, RS-ONS was discontinued. In addition, 1 patient in the CON group died of an acute cerebrovascular event.
Table 1. Demographical and Clinical Characteristics of All Subjects at Baseline. Characteristic RS-ONS Group (n = 29) CON Group (n = 29) P Value Age, mean (SD), y 62.0 (11.3) 57.2 (12.3) .130
Male sex, No. (%) 13 (44.8) 20 (69) .063
Duration of HD, mean (SD), y 6.5 (4.9) 9.4 (8.7) .127 Etiology of CKD, No. (%) .986 Diabetes mellitus 5 (17.2) 4 (13.8) Hypertension 9 (31.0) 8 (27.5) Glomerulonephropathy 4 (13.8) 6 (20.6) Unknown reason 2 (6.9) 1 (3.4) Other reasonsa 9 (31.0) 10 (34.4) URR, mean (SD) 68.3 (6.7) 68.2 (6.4) .968
MIS, mean (SD), points 8.3 (2.8) 7.3 (2.7) .169
BMI, mean (SD), kg/m2 22.7 (4.0) 23.8 (4.7) .355
BMI, body mass index; CKD, chronic kidney disease; CON, control; HD, hemodialysis; MIS, malnutrition and inflammation score; RS-ONS, renal-specific oral nutrition supplementation; SD, standard deviation; URR, urea reduction ratio.
aIncludes nephrolithiasis, polycystic kidney disease, renal artery stenosis,
systemic lupus erythematosus, tubulointerstitial nephritis, vesicoureteral reflux, familial Mediterranean fever, and Fabry disease.
Table 2. Laboratory Findings, Anthropometric Indicators, MIS, nPCR, and Erythropoietin Requirement in RS-ONS and CON Groups: Baseline and 6-Month Comparison Between and Within Groups.
RS-ONS Group CON Group
Measurement Baseline 6 Months Baseline 6 Months P Value
Hemoglobin, g/dL 11.1 (1.2) 11.3 (1.2) 10.7 (1.7) 10.7 (1.5) — Creatinine, mg/dL 7.5 (2.0) 7.5 (1.8) 8.8 (2.3) 8.4 (2.5) .031a Intact PTH, pg/mL 652.1 (688.1) 546.0 (519.3) 770.6 (738.8) 694.3 (638.6) — Total cholesterol, mg/dL 160.1 (34.9) 164.2 (39.0) 149.9 (41.9) 148.1 (34.2) — LDL-cholesterol, mg/dL 89.3 (30.1) 93.4 (30.1) 76.9 (24.0) 76.1 (28.4) .028b HDL-cholesterol, mg/dL 38.9 (15.4) 39.6 (9.5) 34.8 (10.1) 37.1 (10.6) — Triglyceride, mg/dL 125.0 (64.0) 119.6 (59.7) 120.1 (72.9) 112.2 (50.6) — Serum albumin, g/dL 3.5 (0.3) 3.7 (0.2) 3.4 (0.3) 3.5 (0.3) .012,b .028c CRP, g/dL 6.0 (21.6) 7.4 (12.0) 6.1 (27.5) 11.0 (22.0) — Lymphocyte, mm3 1410 (625) 1330 (755) 1500 (1000) 1670 (940) —
White blood cells, mm3 7219.7 (2253.2) 6724.8 (2427.6) 7014.5 (1809.1) 6568.6 (2082.0) —
Transferrin saturation, % 47.82 (65.1) 54.4 (34.4) 36.8 (26.7) 55.6 (48.1) .049d
URR 68.3 (6.7) 68.2 (6.4) 70.7 (6.6) 69.7 (5.6) —
Dry weight, kg 58.1 (10.3) 59.0 (10.4) 65.5 (15.2) 63.9 (15.0) .034,a <.001c,d
Intradialytic weight gain, kg 2.9 (0.6) 3.1 (0.6) 3.0 (0.9) 3.0 (0.8) —
BMI, kg/m² 22.7 (4.0) 22.9 (3.7) 23.8 (4.7) 23.0 (4.5) <.001d
Triceps skinfold thickness, cm 10.5 (5.0) 11.9 (5.0) 12.6 (5.4) 11.3 (5.5) <.001c,d
Fat mass, kg 14.8 (8.8) 15.0 (8.9) 14.7 (10.1) 14.6 (9.8) —
Fat-free mass, kg 43.5 (6.8) 44.3 (6.9) 51.0 (9.1) 49.0 (9.2) <.001,a,d .030b
Muscle mass, kg 41.3 (6.5) 42.0 (6.4) 48.4 (8.6) 46.5 (8.8) <.001,a,d .028b
Bone mass, kg 2.2 (0.3) 2.3 (0.3) 2.6 (0.4) 2.5 (0.4) <.001,a,d .037b
MIS, score 8.3 (2.8) 8.2 (3.0) 7.3 (2.7) 8.8 (3.4) <.006d
nPCR, g/kg/d 0.91 (0.17) 0.93 (0.17) 0.94 (0.18) 0.89 (0.17) —
rHuEPO dose change, % –14.77 (35) 1.38 (24.14) .012b
Values are expressed as mean (SD). CON, control; CRP, C-reactive protein; HDL, high-density lipoprotein; LDL, low-density lipoprotein; PTH, parathyroid hormone; URR, urea reduction ratio; BMI, body mass index; MIS, malnutrition and inflammation score; nPCR, normalized protein catabolic rate; rHuEPO, recombinant human erythropoietin; IQR, interquartile range; RS-ONS, renal-specific oral nutrition supplementation; —, p >.05.
aP values for baseline comparison between groups. bP values for 6-month comparison between groups.
cP values for baseline vs 6-month comparison in the RS-ONS group. dP values for baseline vs 6-month comparison in the CON group.
Figure 2. Mean serum albumin concentration (g/dL) in oral nutrition supplementation (ONS) and control groups during the study period.
Figure 3. Percentage of patients with serum albumin level of <3.5 g/dL in oral nutrition supplementation (ONS) and control groups at baseline and month 6 of the study.
Discussion
Our findings revealed that RS-ONS significantly improved nutrition parameters in malnourished patients with CKD, simi-lar to a previous prospective study.11 Notably, several clinically undiagnosed nutrition parameters deteriorated in patients who declined nutrition supplementation.
Hypoalbuminemia is most likely the strongest predictor of mortality among MHD patients.19 Seven randomized and non-randomized trials with ONS reported significant improvements in serum albumin levels.6-10,12,14 In our study population, a sig-nificant increase in serum albumin was observed only in the RS-ONS group and a significant reduction in the percentage of patients with serum albumin <3.5 g/dL at the end of the follow-up period. Therefore, it seems reasonable to consider the sig-nificant improvement in serum albumin as well as nutrition status in patients receiving RS-ONS to result in lower inflam-matory status.
Considering the suggested relation of anthropometrics,19-21 it is worth noting that a significant increase in DW, BMI, and TSFT was evident in the RS-ONS group, while the CON group showed a significant decline.
BIA is an easy-to-implement and a useful nutrition assess-ment tool to monitor health status, determine long-term fol-low-up, and detect early losses of lean body mass in MHD patients.6 In this study, both groups were similar in terms of demographic and clinical data, and baseline and 6-month BIA values were higher in the CON group. The possible explana-tion of this result may be that patients in the CON group might have been feeling better at the initiation of the study, with bet-ter appetite and nutrition intake. But at the end of the study, while BIA values of the CON group significantly decreased, an increase of 1%–2% was observed in the experimental group.
Exploring the relationship between measures of body com-position and anemia, we observed a 14.8% decrease in EPO dose for patients receiving RS-ONS.
The present study clearly indicates that RS-ONS improves the nutrition status of patients in MHD patients with malnutri-tion. Albeit no relationship was determined between body composition and markers of inflammation, improvement of MIS and EPO requirement in the RS-ONS group seems notable.
Previously, our clinical approach was to advise an increase in nutrition intake when minor signs of malnutrition were detected in our patients. However, the present findings suggest that earlier introduction of RS-ONS improves nutrition status.
One of the limitations of this study is the higher baseline and 6-month BIA values in the CON group. The total daily protein/calorie intake was not assessed, and we did not use a more sensitive reference method to estimate body composition (like dual-energy x-ray absorptiometry).
Conclusion
In conclusion, our findings indicate that consuming RS-ONS at home improves the nutrition and inflammatory status of patients with CKD, which suggests development of a rational approach to detect minor signs of malnutrition early as well as a reasonable treatment strategy.
References
1. Kovesdy CP, Kalantar-Zadeh K. Why is protein-energy wasting associ-ated with mortality in chronic kidney disease? Semin Nephrol. 2009;9: 3-14.
2. Lowrie EG, Lew LN. Death risk in hemodialysis patients: the predictive value of commonly measured variables and an evaluation of death rate differences between facilities. Am J Kidney Dis. 1990;15:458-482. 3. Combe C, Chauveau P, Laville M, et al; French Study Group Nutrition in
Dialysis. Influence of nutritional factors and hemodialysis adequacy on the survival of 1.610 French patients. Am J Kidney Dis. 2001;37:81-88. 4. Dukkipati R, Kopple JD. Causes and prevention of protein-energy wasting
in chronic kidney failure. Semin Nephrol. 2009;29:39-49.
5. Cano N, Fiaccadori E, Tesinsky P, Toigo G, Druml W; DGEM (German Society for Nutritional Medicine); ESPEN (European Society for Parenteral and Enteral Nutrition). ESPEN guidelines on enteral nutrition: adult renal failure. Clin Nutr. 2006;25:295-310.
6. Sharma M, Rao M, Jacob S, Jacob CK. A controlled trial of intermittent enteral nutrient supplementation in maintenance hemodialysis patients. J
Ren Nutr. 2002;12:229-237.
7. Cano NJ, Fouque D, Roth H, et al; French Study Group for Nutrition in Dialysis. Intradialytic parenteral nutrition does not improve survival in malnourished hemodialysis patients: a 2 year multicenter, prospective, randomized study. J Am Soc Nephrol. 2007;18:2583-2591.
8. Moretti HD, Johnson AM, Keeling-Hathaway TJ. Effects of protein sup-plementation in chronic hemodialysis and peritoneal dialysis patients. J
Ren Nutr. 2009;19:298-303.
9. Beutler KT, Park GK, Wilkowski MJ. Effect of oral supplementation on nutrition indicators in hemodialysis patients. J Ren Nutr. 1997;7:77-82. 10. Kuhlmann MK, Schmidt F, Köhler H. High protein/energy vs. standard
protein/energy nutritional regimen in the treatment of malnourished hemodialysis patients. Miner Electrolyte Metab. 1999;25:306-310.
Figure 4. Percent change in dry weight (DW), body mass index (BMI), fat-free mass (FFM), muscle mass (MM), and bone mass (BM) at the end of the study oral nutrition supplementation (ONS) and control groups.
11. Caglar K, Fedje L, Dimmitt R, Hakim RM, Shyr Y, Ikizler TA. Therapeutic effects of oral nutritional supplementation during hemodialysis. Kidney
Int. 2002;62:1054-1059.
12. Holley JL, Kirk J. Enteral tube feeding in a cohort of chronic hemodialysis patients. J Ren Nutr. 2002;12:177-182.
13. Kalantar-Zadeh K, Braglia A, Chow J, et al. An anti-inflammatory and antioxidant nutritional supplement for hypoalbuminemic hemodialysis patients: a pilot/feasibility study. J Ren Nutr. 2005;15:318-331.
14. Scott MK, Shah NA, Vilay AM, Thomas J III, Kraus MA, Mueller BA. Effects of peridialytic oral supplements on nutritional status and quality of life in chronic hemodialysis patients. J Ren Nutr. 2009;19:145-152. 15. Frisancho AR. Triceps skin fold and upper arm muscle size norms for
assessment of nutrition status. Am J Clin Nutr. 1974;27(10):1052-1058. 16. Nuñez C, Gallagher D, Visser M, Pi-Sunyer FX, Wang Z, Heymsfield SB.
Bioimpedance analysis: evaluation of leg-to-leg system based on pressure contact footpad electrodes. Med Sci Sports Exerc. 1997;29(4):524-531.
17. Kalantar-Zadeh K, Kopple JD, Block G, Humphreys MH. A malnu-trition-inflammation score is correlated with morbidityand mortal-ity in maintenance hemodialysis patients. Am J Kidney Dis. 2001;38: 1251-1263.
18. Lightfoot BO, Caruana RJ, Mulloy LL, Fincher ME. Simple formula for calculating normalized protein catabolic rate (NPCR) in hemodialysis (HD) patients (abstract). J Am Soc Nephrol. 1993;4:363.
19. Leavey SF, Strawderman RL, Jones CA, Port FK, Held PJ. Simple nutri-tional indicators as independent predictor of mortality in hemodialysis patients. Am J Kidney Dis. 1998;31:997-1006.
20. Kopple JD, Zhu X, Lew NL, Lowrie EG. Body weight-for-height relation-ships predict mortality in maintenance hemodialysis patients. Kidney Int. 1999;56:1136-1148.
21. Kalantar-Zadeh K, Streja E, Kovesdy CP, et al. The obesity paradox and mortality associated with surrogates of body size and muscle mass in patients receiving hemodialysis. Mayo Clin Proc. 2010;85:991-1001.