Introduction
Anchovy represents 63.4% of the total fishing from marine resources in Turkey and is caught between November and March. The production was reported as 350,000t in 1999 (1). It is marketed either fresh or processed into fishmeal and oil in Turkey because of its seasonal catch for a short period of time. About 25% of anchovy goes to fish meal factories while seafood consumption is very low, 8 kg per person/year, in this country. Although anchovy is perishable, it is commonly marketed throughout Turkey fresh, without being chilled, frozen, or preserved in any other way. Only a small proportion is marketed during the off-season in frozen, canned and salted form (1).
Demand for high-quality chilled seafood has increased over the past decade in Turkey and elsewhere. Most studies on the shelf life of this species have been carried out with fish in ice or at ambient temperatures (2-6). Several different chilling methods have been suggested to increase shelf life (6-8). In Turkey, as in many other countries, the retail sale of fish may occur in cold storage, refrigerated without ice, or even at ambient temperatures.
Despite the commercial importance of the species, very few studies have investigated the changes that occur in anchovy during the course of typical handling, distribution, and storage in Turkey and in other countries in which similar methods are used. The purpose of this
An Investigation of Quality Changes in Anchovy
(Engraulis encrasicolus, L. 1758) Stored at Different Temperatures
Sevim KÖSE
Marine Sciences Faculty, Karadeniz Technical University, 61530, Trabzon - TURKEY [email protected] or [email protected]
Mehmet Emin ERDEM
Faculty of Fisheries Science, Karadeniz Technical University, 53100, Rize - TURKEY
Received: 27.01.2003
Abstract: Quality changes in anchovy caught at different times during storage at ambient and refrigerated temperatures were
investigated in 3 different batches. Sampling was carried out each day during storage. The results showed no significant differences among the anchovy batches except for bacteriological counts and trimethylamine (TMA) values at refrigerated temperatures. Storage time and temperature had a significant effect (P < 0.001, P < 0.05) on sensory, bacteriological and chemical values. Bacteriological counts and chemical values increased significantly (P < 0.05, P < 0.001) depending on time, while sensory results decreased (P < 0.05). According to sensory results, samples were acceptable for 1 day at ambient temperatures and for 2 days refrigerated. This study showed that refrigeration did not extend the shelf-life of fresh anchovies by more than a day compare to ambient temperature. Key Words: Anchovy, shelf life, cold storage, ambient temperature
Hamsinin (Engraulis encrasicolus, L. 1758) Farkl› Depolama S›cakl›klar›ndaki Kalite De¤iflimleri Üzerine Bir Araflt›rma
Özet: Hamsinin oda s›cakl›¤› ve buzdolab› koflullar›nda depolanmas› esnas›ndaki kalite de¤iflimleri farkl› zamanda avlanan üç grup
örnekle incelendi. Depolama esnas›nda günlük örnekleme yap›ld›. Araflt›rma sonuçlar› üç grup aras›nda, buzdolab› koflullar›nda depolanan örneklerde bakteriyolojik ve TMA de¤erleri haricinde önemli bir farkl›l›k bulunmad›¤›n› gösterdi. Ancak, tüm örneklerde elde edilen duyusal, bakteriyolojik ve kimyasal de¤erlerde depolama s›cakl›¤› ve zaman›na ba¤›ml› olarak önemli ölçüde de¤iflim oldu¤u saptand› (P < 0.001, P < 0.05). Bakteri say›s› ve kimyasal de¤erler zamana ba¤›ml› olarak art›fl gösterirken (P < 0.05, P < 0.001), duyusal de¤erlerde önemli derecede azalma gözlendi (P < 0.05). Duyusal analizlere göre hamsinin raf ömrü oda s›cakl›¤›nda bir gün, buzdolab›nda ise iki gün olmufltur. Böylece, buzdolab› koflullar›nda ürünün raf ömrünün oda s›cakl›¤›na göre sadece bir gün uzat›labildi¤i tespit edilmifltir.
study is to determine the rate and type of processes of deterioration that occur in anchovy both refrigerated and under ambient storage conditions, using sensory, bacteriological, physical and chemical assays. Furthermore, the investigation seeks to identify analyses that may be used to monitor quality changes in anchovy during its shelf life at refrigerated and ambient temperatures.
Materials and Methods
Anchovies used in this study were caught in the eastern Black Sea between December and March by a commercial fishing vessel using a purse seine net. Two different methods of transport and storage were used after the fish were caught. In the first method, the fish were transported and stored under ambient temperature conditions, as is popular among regional fishermen. In this traditional method, the fish were transported in wooden boxes at ambient temperatures and sold without being cooled. In the second method, the fish were stored in crushed ice (0 ± 1 °C, 3:2 ice/fish w/w) immediately after being caught, and then packed in polystyrene boxes and transported to the laboratory. After that they were stored refrigerated (4 ± 1 °C) on trays without ice. This method is used in some parts of Turkey, especially for valuable fish species.
Each method of storage and transport was tested on 3 separate batches. The fish samples that were caught in
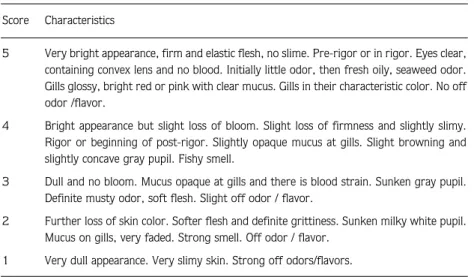
December, January and March represent the first, second and third batches, respectively. The fish arrived at the laboratory approximately 3 h after being caught. Samples were taken for analysis at daily intervals and sampling was performed in triplicate for each analysis. Eight experienced assessors judged the overall acceptability of samples using a five-point quality scale modified from Huss (9), Pedrosa-Menabrito and Regenstein (10), Plahar et al. (11) and Özogul et al. (12). The scale points were: Very good, 5; Good, 4; Acceptable, 3; Poor, 2; Very poor, 1 (Table 1)
Bacterial counts were performed on samples of muscle plus skin. Twenty-five grams of samples were aseptically weighed into a sterile blender containing 225 ml of sterile peptone water (PW, 0.1% w/v) and blended for 2 min at low speed. Further decimal dilutions were prepared in PW (13). Counts of total aerobic mesophilic and psychrophilic microorganisms were determined using plate count agar (PCA) incubated at 37 °C for 72 h for mesophilic microorganisms and at 6 °C for 10 days for psychrophilic microorganisms (14).
TVB-N content was determined by the method described by ‹nal (15). Progression of rancidity was estimated by TBA values, expressed in mg malonaldehyde/kg. All TBA values were estimated using the method described by Smith et al. (16). The method of Boland and Paige (17) was used for trimethylamine nitrogen (TMA-N) analysis. The pH was detected according to Curran et al. (18). The colorimetric method
Table 1. The scheme for freshness assessment. Score Characteristics
5 Very bright appearance, firm and elastic flesh, no slime. Pre-rigor or in rigor. Eyes clear, containing convex lens and no blood. Initially little odor, then fresh oily, seaweed odor. Gills glossy, bright red or pink with clear mucus. Gills in their characteristic color. No off odor /flavor.
4 Bright appearance but slight loss of bloom. Slight loss of firmness and slightly slimy. Rigor or beginning of post-rigor. Slightly opaque mucus at gills. Slight browning and slightly concave gray pupil. Fishy smell.
3 Dull and no bloom. Mucus opaque at gills and there is blood strain. Sunken gray pupil. Definite musty odor, soft flesh. Slight off odor / flavor.
2 Further loss of skin color. Softer flesh and definite grittiness. Sunken milky white pupil. Mucus on gills, very faded. Strong smell. Off odor / flavor.
1 Very dull appearance. Very slimy skin. Strong off odors/flavors. Very good 5: good, 4: acceptable, 3: poor, 2: very poor, 1.
of Köse and Hall (19) was used to analyze histamine. All the chemical analyses were conducted on samples taken from a pool of 3 fish for each storage time and were carried out in triplicate. Analyses were carried out after 24 h from the time of catching. Data were evaluated using analysis of variance (20).
The water and air temperatures at the time the fish were caught were 10.4, 13.4, and 11.8 and 9.4, 12.6 and 10.3 ºC for the first, second, and third batches, respectively.
Results
Figures 1 and 2 show mesophilic and psychrophilic bacterial counts. The lowest mesophilic bacterial counts at ambient temperatures were observed after 24 h in storage to be 1.9 x 10⁴ (cfu/g) and the highest counts were taken after 3 days in storage at 2.95 x 10⁹(cfu/g). These values increased significantly (P < 0.001) depending on time. A significant variation existed between batches (P < 0.001). The lowest psychrophilic bacterial counts for the samples stored at ambient and refrigerator temperatures were taken on the first day of storage at 2.29 x 10⁴ and 4.89 x 10³ (cfu/g), respectively. These values increased significantly with time for both storage temperatures (P < 0.001). On the third day of storage, the bacterial counts ranged between
1.2 x 10⁸and 8.9 x 10⁸(cfu/g) at ambient temperatures, and between 2.57 x 10⁶ and 1.78 x 10⁷ (cfu/g) at refrigerated temperatures. The highest result among the refrigerated batches was 8.9 x 10⁸ (cfu/g) for the 2nd refrigerated batch on the 5thday of storage. The samples stored at ambient temperatures were not analyzed for psychrophilic bacterial counts after the 3rdday of storage because a high sensory spoilage rate was observed. Storage temperature had a significant effect on psychrophilic bacterial counts (P < 0.05).
Tables 2, 3 and 4 show the results of the physical, sensory and chemical analyses. It is clear that the physical and chemical values increased significantly (P < 0.05) with time. The lowest values were found after 1 day of storage and the highest were found on the last day of storage for both temperatures, for all physical and chemical analyses. The lowest and highest pH values were 6.18 and 7.14 for ambient temperatures, and 6.07 and 6.97 for refrigerated temperatures. There were no significant differences between the batches except for some of the samples stored at ambient and refrigerator temperatures on the 2nd
day. Storage temperature had no significant effect on pH values.
As shown in Table 2, sensory values decreased significantly with increasing chemical spoilage (P < 0.05). Overall scores were higher for refrigerated samples. Anchovy samples became unacceptable on the second day
1 2 3 4 5 6 7 8 9 10 1 2 3
Storage time (days)
Bacterial counts (log cfu/g)
M 1st M 2nd M 3rd P 1st P 2nd P 3rd
P = Psychrophilic bacteria M = Mesophilic bacteria Figure 1. Results of mesophilic and psychrophilic bacterial counts of
samples stored at ambient temperatures.
3 5 7 9
1 2 3 4 5
Storage time (days)
Bacterial count (log cfu/g)
P 1st batch P 2nd P 3rd batch
P: Psychrophilic bacterial counts
Figure 2. Results of psychrophilic bacterial counts of samples stored at refrigerated temperatures.
of storage at ambient temperatures and on the 3rdday of storage at refrigerator temperatures. Therefore, the samples had a shelf life of 1 day at ambient temperatures and 2 days at refrigerated temperatures.
TBA values were higher for samples stored at ambient temperatures compared to refrigerated samples. The
lowest TBA values were 1.22 to 1.36 mg malonaldehyde/kg for ambient temperatures and 0.67 to 0.92 mg malonaldehyde/kg at refrigerated temperatures. After 3 days in storage, the values were 8.43 to 9.32 and 6.08 to 6.22 mg malonaldehyde/kg, respectively. The highest TBA values for longer storage under refrigeration
Table 2. Results for pH analysis and sensory values.
pH Sensory
Batches
Days I II III I II III
Initial * * * 5 5 5 1 6.22 (±0.02) 6.18 (±0.01) 6.24 (±0.02) 4 4 4 A 2 6.78 (±0.04) 6.67 (±0.03) 6.85 (±0.01) 2 2 2 3 7.04 (±0.02) 7.14 (±0.05) 7.05 (±0.03) 0 0 0 1 6.18 (±0.04) 6.07 (±0.02) 6.14 (±0.06) 4 4 4 2 6.44 (±0.01) 6.23 (±0.04) 6.28 (±0.01) 3 3 3 R 3 6.68 (±0.03) 6.54 (±0.03) 6.53 (±0.03) 2 2 2 4 6.83 (±0.05) 6.71 (±0.02) 6.70 (±0.08) 2 2 2 5 6.97 (±0.03) 6.88 (±0.02) 6.92 (±0.05) 0 0 0 *not detected. Initial: Immediately after fish were caught. A: Ambient Temperature R: Refrigerated Temperature. Analyses were carried out 24 h after fish were caught, except for sensory values. Each number shows the mean value of triplicate results for pH and 8 results for sensory values. Numbers in parentheses represent standard deviations.
Table 3. Results of chemical analysis for ambient temperatures.
TBA mg malonaldehyde/kg TVBN (mg/100 g) TMA (mg/100 g) Histamine (mg/100 g)
Batches Batches Batches Batches
Days I II III I II III I II III I II III
1 1.36 1.27 1.22 7.3 9.1 8.4 3.21 3.45 3.53 8.91 13.16 8.32 (±0.12) (±0.32) (±0.25) (±0.83) (±0.05) (±0.56) (±0.13) (±0.70) (± 0.18) (±0.11) (±0.72) 2 4.56 4.17 5.84 26.6 19.6 21.0 4.15 4.89 4.25 15.32 16.55 14.44 (±0.11) (±0.41) (±0.05) (±4.01) (±0.63) (±0.73) (±0.18) (±0.09) (± 0.25) (±0.23) (±0.26) (±0.69) 3 8.43 8.91 9.32 39.2 36.3 43.2 8.85 8.63 9.05 20.53 21.59 23.14 (±0.05) (±0.08) (±0.16) (±1.03) (±1.74) (±1.12) (±0.08) (±0.15) (± 0.36) (±0.73) (±0.21) (±0.81) Each number shows the mean value of triplicate results. Numbers in parentheses represent standard deviations. Analyses were carried out 24 h after fish were caught.
were 9.30 mg malonaldehyde/kg on the 5th day of storage with the 3rd batch. Variation in TBA values was significant only between the 1stand 3rdbatches on the 2nd day of storage under refrigeration (P < 0.05). Storage temperature had a significant effect on TBA values (P < 0.05).
TVB-N values increased for both ambient and refrigerated temperatures depending on time (P < 0.001). The lowest and highest TVB-N values for ambient temperatures were 7.3 and 43.2 mg/100 g on the 1stand 3rd days in storage, respectively. After 1 day of refrigerated storage, the lowest TVB-N value was calculated to be 4.8 mg/100 g for the 1stbatch, and the highest value was calculated to be 38.8 mg/100 g after 5 days of storage. Variation between batches was insignificant except for between certain batches on the 2nd day of storage at both temperatures. Storage temperature had a significant effect on TVB-N values (P < 0.05).
Histamine values under refrigerated conditions were lower than for the samples stored at ambient temperatures, and increased significantly with time (P < 0.001). The lowest histamine values for ambient and
refrigerator temperatures were 8.32 and 3.68 mg/100 g, respectively after 1 day of storage. After 3 days of storage, the highest values were 23.14 mg/100 g for ambient temperatures and 13.65 mg/100 g for refrigerated temperatures. Histamine values increased to 33.39 mg/100 g for refrigerator temperature for longer storage times. Variation between batches was insignificant for ambient temperatures except on the 1st day of storage between the 2ndbatch and the others (P < 0.05). There was some variation among batches stored at refrigerated temperatures. Variation was significant between the 2ndand 3rdbatch on the first day (P < 0.05). Variation was also significant for extended storage between the 1st batch and the others (P < 0.05, P < 0.001). Storage temperature had a significant effect on histamine values (P < 0.001).
Although storage temperatures affected TMA values (P < 0.05) significantly, there was no significant variation between batches at either storage temperature. The lowest TMA values at ambient and refrigerated temperatures were found at the beginning of storage to be 3.21 and 2.91 mg/100 g, respectively. These values increased significantly at each temperature (P < 0.001) with time.
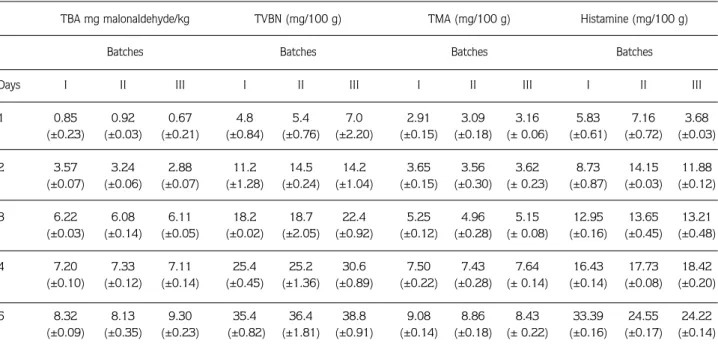
Table 4. Results of chemical analysis for refrigerated conditions.
TBA mg malonaldehyde/kg TVBN (mg/100 g) TMA (mg/100 g) Histamine (mg/100 g)
Batches Batches Batches Batches
Days I II III I II III I II III I II III
1 0.85 0.92 0.67 4.8 5.4 7.0 2.91 3.09 3.16 5.83 7.16 3.68 (±0.23) (±0.03) (±0.21) (±0.84) (±0.76) (±2.20) (±0.15) (±0.18) (± 0.06) (±0.61) (±0.72) (±0.03) 2 3.57 3.24 2.88 11.2 14.5 14.2 3.65 3.56 3.62 8.73 14.15 11.88 (±0.07) (±0.06) (±0.07) (±1.28) (±0.24) (±1.04) (±0.15) (±0.30) (± 0.23) (±0.87) (±0.03) (±0.12) 3 6.22 6.08 6.11 18.2 18.7 22.4 5.25 4.96 5.15 12.95 13.65 13.21 (±0.03) (±0.14) (±0.05) (±0.02) (±2.05) (±0.92) (±0.12) (±0.28) (± 0.08) (±0.16) (±0.45) (±0.48) 4 7.20 7.33 7.11 25.4 25.2 30.6 7.50 7.43 7.64 16.43 17.73 18.42 (±0.10) (±0.12) (±0.14) (±0.45) (±1.36) (±0.89) (±0.22) (±0.28) (± 0.14) (±0.14) (±0.08) (±0.20) 5 8.32 8.13 9.30 35.4 36.4 38.8 9.08 8.86 8.43 33.39 24.55 24.22 (±0.09) (±0.35) (±0.23) (±0.82) (±1.81) (±0.91) (±0.14) (±0.18) (± 0.22) (±0.16) (±0.17) (±0.14) Each number shows the mean value of triplicate results. Numbers in parentheses represent standard deviations. Analyses were carried out 24 h after fish were caught.
Discussion
Many factors such as species, size, temperature, physical condition, and methods of catching and handling can affect the shelf life of fish during storage (9). Several methods are available for assessing fish quality and deterioration. However, there is much interspecies variation with respect to chemical, bacteriological and sensory changes, depending on storage temperature, whether the product is fresh or processed, and the method of processing. Therefore, acceptable limits for each quality criterion may vary greatly between different species (9,11).
Köse et al. (21) carried out a similar study with anchovy. In that study, fish samples were brought to the laboratory without ice and stored refrigerated. Türker et al. (22) investigated the effect of changes in the catching season on various quality values and on the shelf life of anchovy (Engraulis encrasicolus, L. 1758) at ambient temperatures (17 ± 1 °C). It was observed in that study that anchovy samples became spoiled on the second day of storage, in agreement with results for ambient temperature in this study. Careche et al. (6) found that less spoilage occurred with anchovy distributed in ice in expanded polystyrene boxes in comparison to in wooden boxes.
The pH of fish immediately after being caught was reported to be between 6.0 and 6.5. The fish were acceptable up to a pH of 6.8 but were considered to be spoiled above a pH of 7.0 (9). According to these criteria, anchovy samples stored at refrigerated temperatures were of acceptable quality and at ambient temperature they were near to acceptable level during the storage. However, sensory values did not support these results. Köse et al. (21) obtained similar results for refrigerated samples. Türker et al. (22) did not observe seasonal variation in pH values. Their results were similar to those obtained in this study for anchovy samples stored at ambient temperature.
An acceptability limit of 106 colonies per gram (6.0 log cfu/g), based on chemical and organoleptic properties, has been proposed for fresh fish products (9,23). Despite wide variation between batches, levels of bacteria exceeded acceptable limits after 24 h at ambient temperatures and after 48 h for refrigerated temperatures, for both mesophilic and psychrophilic bacterial counts. These results correlated well with the
sensory values. In the studies carried out by Köse et al. (21) and Türker et al. (22), microbial changes in anchovy samples were not investigated.
TMAO is generally present in seawater fish and it is the most commonly used chemical method for assessing fish quality (24). It has been recommended that high-quality cold-water fish contain less than 1.5 mg TMA-N/100 g fish, and 10-15 mg TMA-TMA-N/100 g is generally regarded as the limit of acceptability for human consumption (9). Magnússon and Martinsdóttir (24) did not find TMA useful for evaluating spoilage of thawed whole cod, cod fillet or ocean perch. According to TMA criteria, our results did not exceed the limit for the samples at either temperature during storage. Therefore these results did not agree with sensory observations. According to sensory analysis, the suitable limits of acceptability for TMA can be suggested for anchovy to be 4 mg/100 g. Türker et al. (22) found seasonal variation in the TMA values of anchovy samples stored at 17 ± 2 °C. Although they observed the lowest values in January and the highest values in September, our results showed that there was no significant variation with respect to season among the batches.
There also exists much interspecies variation in the development of TVB-N (11). The concentration of TVB in freshly caught fish is typically between 5 and 20 mg TVB-N/100 g flesh, but levels of 30-35 mg/100 g flesh are generally regarded as the limit of acceptability for fish stored in ice-cold water (5). According to these TVB-N values, the samples were acceptable after 2 and 3 days of storage for ambient and refrigerated temperatures, respectively. Therefore TVB-N values did not support the sensory results in this study.
TBA values showed the degree of rancidity in the products, and values greater than 3-4 mg malonaldehyde/kg indicated a loss of product quality (25). Karaçam and Düzgünefl (26) reported that the total lipid content of anchovy samples varied between 3.10% (in March) and 16% (in November). The TBA results of our study exceeded 4 mg after 24 h for ambient temperatures and after 48 h for refrigerated temperatures, which agreed with sensory values. Therefore, TBA criteria were deemed suitable for testing anchovy samples for rancidity, despite their unsuitability for other fish species such as the smooth oreo dory (27).
The presence of histamine in fish and other food products is important for food safety (28). European Community and Spanish regulations have set a maximum mean value of 100 mg/kg among 9 samples of fresh or canned fish and 200 mg/kg among the same number of samples of ripened product. In 1995, the Food and Drug Administration revised its standards to lower the maximum histamine defect action level from 100 to 50 mg/kg (29). Many results were reported to inhibit histamine formation significantly in fish stored at low temperatures (30). However, Yamanaka et al. (30) demonstrated that histamine accumulated in mackerel stored for prolonged periods (14 days) at 5 °C. Others have reported that certain psychrophiles and halophiles that occur as part of the normal surface microflora of marine fish can produce large amounts of histamine at temperatures as low as 2.5 °C (3). Ababouch et al. (3) reported that histamine reached toxic levels after 6-10 days in 4 out of 7 experiments of sardines stored at 8 ˚C and on ice.
Although fish were acceptable up to 2 days according to the sensory results of this study, histamine values were very high in the samples stored at both temperatures. According to a study performed by Köse et al. (21), histamine values reached 8.87 mg/100 g by the second day for refrigerated samples, although no histamine was observed at the beginning of storage. Histamine results were very similar to the results of Köse et al. (21) and values ranged between 8.73 and 14.15 mg/100 g.
The shelf life of different fish products varies considerably and depends primarily on the temperature of storage and the initial condition of the fish. The initial quality of the fish limits its maximum possible shelf life and may be affected by its feeding habits, how it was bred and handled, and so on. Once the fish are caught, deterioration in quality is highly temperature dependent (31). Our study showed that the acceptable limits for physical and chemical parameters may vary according to the species used. The results of sensory, bacteriological, and TBA analyses correlated well with each other. It can thus be concluded that although lower storage temperatures retard the deterioration of anchovy, refrigeration without ice did not have a marked effect in extending the shelf life. Despite the fact that the samples were kept in ice before being refrigerated, they were unacceptable on the 3rd day of storage. The lower shelf life of the samples as compared to those observed in other studies could be due to any combined effect of the factors mentioned above.
Acknowledgments
The authors thank the Research Funding Section of the Karadeniz Technical University for supporting this study. We also thank Anthony K. Shin, from Hawaii, USA, for his kind help in correcting the English of this manuscript.
References
1. DIE: Fisheries Statistics. The State Institute of Statistics. Ankara, Turkey. Available online: http://www.die.gov.tr/, DIE. 2002. 2. Ryder, J.M., Buisson, D.H., Scott, D.N., Fletcher, G.C.: Storage of
New Zealand Jack Mackerel (Trachurus novaezelandiae) in ice: Chemical, Microbiological and Sensory Assessment. J. Food Sci. 1984; 49: 1453-1456.
3. Ababouch, L., Afilal, M.E. Benabdeljelil, H., Busta, F.F.: Quantitative changes in bacteria, amino acids and biogenic amines in sardine (Sardina pilchardus) stored at ambient temperature (25-28°C) and in ice. Int. J. Food Sci. Technol. 1991; 26: 297-306.
4. Gram, L.: Spoilage of three Senegalese fish species stored in ice and at ambient temperature. In. Bligh, E.C. (ed.), Seafood Science and Technology. Fishing News Books. 1992; 225-239. 5. Kyrana, W.R., Laugovois, V.P., Valsamis, D.S.: Assessment of
shelf-life of maricultured gilthead sea bream (Sparus aurata) stored in ice. Int. J. Food Sci. Technol. 1997; 32: 339-347.
6. Careche, M., Garcia, R., Borderias, J.: Anchovy shelf life as affected by different chilling methods during distribution. J. Food Protec. 2002; 65: 353-362.
7. Clucas, I.J., Sutcliffe, P.J.: An Introduction to Fish Handling and Processing. Tropical Products Institute. London. 1981; 15-60. 86p.
8. Graham, J., Johnston, W.A, Nicholson, F.J.: Ice in Fisheries. FAO Fisheries Technical Paper. No. 331. Rome. FAO. 1992. 75p. 9. Huss, H.H.: Fresh Fish Quality and Quality Changes. Danish
International Development Agency, Rome: FAO. 1988; 15-103. 132p.
10. Pedrosa-Menabrito, A.P., Regenstein, J.M.: Shelf-extension of fresh fish. A review part III. Fish quality and methods of assessment. J. Food Qual. 1990; 13: 209-223.
11. Plahar, W.A., Nerquaye-Tetteh, G.A., Annan, N.T.: Development of an integrated quality assurance system for the traditional Sardinella sp. and anchovy fish smoking industry in Ghana. Food Cont. 1999; 10: 15-25.
12. Özogul, F., Taylor, K.D.A., Quantick, P., Özogul. Y.: Chemical, microbiological and sensory evaluation of Atlantic herring (Clupea harengus) stored in ice, modified atmosphere and vacuum pack. Food Chem. 2000; 71: 267-273.
13. Karaçam, H., Kutlu, S., Köse, S.: Effect of salt concentrations and temperature on the quality and shelf life of brined anchovies. Int. J. Food Sci. Technol. 2000; 37, 19-28.
14. Collins, C.H., Lyne, P.M., Grange, J.M.: Collins and Lyne’s Microbiological Methods. Butterworths & Co (Publishers) Ltd. London. 1989; 127-140.
15. ‹nal, T.: Besin Hijyeni. Hayvansal Gıdaların Kalite Kontrolü. Final Ofset A.fi., ‹stanbul. 1992; 497-500.
16. Smith, G., Hole, M., Hanson. S.W.: Assessment of lipid oxidation in indonesian salted-dried marine catfish (Arius thalassinus). J. Sci. Food Agri. 1992; 51: 193-205.
17. Boland, F.E., Paige, D.D.: Collaborative study of a method for the determination of trimethylamine nitrogen in fish. Division of Food Chemistry and Technology, Food and Drug Administration. Journal of the AOAC. 1971; 54: 725-727.
18. Curran, C.A., Nicoladies, L., Poulter, R.G., Pors, J.: Spoilage of fish from Hong Kong at different storage temperatures. Trop. Sci. 1980; 22: 367-382.
19. Köse, S., Hall, G.: Modification of a colorimetric method for histamine analysis in fish meal. Food Res. Int. 2000; 33: 839-845.
20. Sokal, R.R., Rohlf, F.J.: Introduction to Biostatistics. 2ndedition, New York. W.H. Freeman and Company. 1987; 349p. 21. Köse, S., Ay, S., Kutlu, S.: An investigation into chemical and
sensory quality changes of some fish species which are commonly caught in Trabzon at cold storage conditions. Ege Su Ürün. Derg. 2000; 17: 35-48.
22. Türker, S., Gökoglu, N., Özden, Ö., Erkan, E., Metin, S., Baygar, T.: The effect of the catching season on various quality values and the shelf life of anchovy (Engraulis encrasicolus, L. 1758). Biyoteknoloji (Kükem) Derg. 1999; 22: 41-48.
23. Aguilera, J.M., Francke, A., Figueroa, G., Bornhardt, C., Cifuentes, A.: Preservation of minced Pelagic fish by combined methods. Int. J. Food Sci. Technol. 1992; 27: 171-177. 24. Magnússon, H., Martinsdóttir, E.: Storage quality of fresh and
frozen-thawed fish in ice. J. Food Sci. 1995; 60: 273-278. 25. Smith J.G.M., Hardy, R., Young, K.W.A.: Seasonal study of the
storage characteristics of mackerel stored at chill and ambient temperatures. Seasonal changes. Chapter 10. In. Connell J.J. (ed.). Advances in Fish Science and Technology, 1980; 372-378. 26. Karaçam, H., Düzgünefl, E.: Hamsi (Engraulis encrasicolus, L. 1758) balıklarında net et verimi ve besin analizleri üzerine bir arafltırma. Ege Su Ürün. Derg. 1988; 5: 100-107.
27. Scott, D.N., Fletcher, G.C., Charles, J.C., Wong. R.J.: Spoilage changes in deep water fish, smooth oreo dory during storage in ice. Int. J. Food Sci. Technol. 1992; 27: 577-588.
28. Taylor, S.L.: Histamine Poisoning. Toxicology and Clinical Aspects. Crit. Rev. Toxicol. 1986; 17: 91-128.
29. Veciana-Nogués, M.T., Mariné-Font, A., Vidal-Carou, M.C.: Changes in biogenic amines during the storage of Mediterranean anchovies immersed in oil. J. Agri. Food Chem. 1997; 45: 1385-1389.
30. Yamanaka, H., Itagaki, K., Shiomi, K., Kikuchi, T., Okuzumi, M.: Influences of the concentration of sodium chloride on the formation of histamine in the meat of mackerel. J. Tokyo Univ. Fisher., 1985; 72: 51-56.
31. Garthwaite, G.A.: Chilling and freezing of fish. In. Hall, G.M. (ed). Fish Processing Technology. Blackie Academic & Professional. London, 1997; 93-118.