TARIM BİLİMLERİ DERGİSİ 2002, 8 (2) 122-127
Monitoring the Soil Water Content Using Time Domain
Reflectometry in a Clay Loam and an Organic Soil
Hasan Sabri ÖZTURK1 Roger HARTMANN 2
Geliş Tarihi: 14.09.2001
Abstract: In the present study, Time Domain Reflectometry (TDR) and tensiometers were used to follow changes in soil water content and soil water pressure head over time in soil containers filled with a clay loam soil and an organic soil. The moisture content changes throughout the soil columns were determined by three-rod TDR probes and tensiometers inserted at the depths of 5, 15, 25, 35 and 45 cm. In the experiment, changes in soil water content and soil water pressure head were determined during and after the simulation of 15 L demineralized water applied at a constant rate of 20 mm hr-1 . The water movement through the clay loam soil was initially fast and the first moisture content change at the depth of 15 cm was detected during the first half an hour but later slow water movement was observed. For the organic soil, change in the moisture content with depth was slow compared with that of the clay loam soil. The first change in moisture content at the depth of 15 cm was observed after only 1 hour from the simulation of water. The highest moisture level, 48.6%, at the depth of 5 cm was determined only after approximately 2.5 hours later from the beginning of simulated rainfall.
Key Words: time domain refloctemetry, water movement, soil column, tensiometer
Killi T
ı
n ve Organik Toprakta Toprak Su içeri
ğ
inin Zaman Etkili Yans
ı
ma
Ölçer (TDR) Kullan
ı
larak izlenmesi
Özet: Bu çalışmada, zaman etkili yansıma ölçer (TDR) ve tansiyometreler, killi tın ve organik toprakla doldurulmuş toprak kolonlarında, toprak su içeriğinde ve toprak su potansiyelindeki değişiklikleri zamana bağlı olarak izlemek için kullanılmışlardır. Toprak kolonları içerisindeki bu değişiklikleri belirlemek için üç çubuklu TDR probları ve tansiyometreler 5, 15, 25, 35 ve 45 cm derinliklerine yerleştirilmişlerdir. Bu denemede, toprak su içeriğindeki ve toprak su potansiyelindeki değişiklikler 20 mm h-1 sabit hızla uygulanan 15 litre saf suyun yağmurlaması süresince ve sonrasında belirlenmiştir. Killi tın toprakta su hareketi başlangıçta hızlı olmuş ve 15 cm derinliğinde ilk değişiklik ilk yarım saat içerisinde belirlenmiş, fakat sonra su hareketin yavaşladığı gözlemlenmiştir. Organik toprakta ise derinliğe bağlı olarak toprak su içeriğindeki değişiklikler killi tın topraktaki ile karşılaştırıldığında yavaş olmuştur. 15 cm derinliğindeki su içeriğindeki ilk değişiklik ancak yağmurlamanın başlamasından 1 saat sonra gözlemlenmiştir. 5 cm derinliğindeki en yüksek su içeriği (% 48,6) ancak yağmurlamanın başlamasından yaklaşık 2,5 saat sonra belirlenmiştir.
Anahtar Kelimeler: zaman etkili yansıma ölçer, su hareketi, toprak kolonu tansiyometre
Introduction
The description and prediction of soil water movement under field conditions that are usually hetero-geneous in space and time are important. Time Domain Reflectometry (TDR) is a technique for measuring volumetric soil water content that can be used in labora-tory as well as in the field (Dalton and Van Genuchten 1986, Zegelin et al. 1989, Kachanoski et al. 1992, Ward et al. 1994, Vogeler et al. 1996). One advantage of TDR is the capability to rapidly measure water content in the
upper 10 to 15 cm of the soil profıle, a zone where
previous methodologies show severe limitations. This attribute, together with the nondestructive nature of the measurement, the absence of radiation hazard and the rapidity with which measurements can be made, makes TDR a powerful and widely useful instrument for many applications. Since then, TDR has become a reliable
method for automated application(Baker and Allmaras 1990, Herkelrath et al. 1991).
Theoretical analysis and experimental correlation's showed that the pulse travel time is proportional to the apparent dielectric constant of the soil and that the proportion of original wave that returns or is reflected upward depends on factors such as soil water content, soil electrolyte concentration and clay content (Topp et al. 1980). Topp et al. (1980) studied a wide range of soil textures and porosities for which the relationships between volumetric water content, 0, and dielectric constant, K.. They proposed a simple empirical polynomial for A (K.) provided A 5 0.6 (v/v);
0 =-5.3 x10 -2 +2.92 x 10⁻² K, -5.5x10 -4 K. 2 +4.3x10 -6 (1)
Ankara University, Faculty of Agriculture, Dept. of Soil Science-Ankara, Turkey
ÖZTÜRK, H. S. and R. HARTMANN, "Monitoring the soil water content using time domain reflectometry in a clay loam
and an organic soil" 123
This universal relationship has been applied successfully by other investigators. Several exceptions to this model have been reported. For example, the dielectric
constant of ice (Ka=3.2) is similar to that of the soil's solid
phase. Consequently, TDR has been used successfully in investigations on the unfrozen water content of frozen soils (Patterson and Smith 1981).
Recently Herkelrath et al. (1991) attributed lower dielectric values to the presence of soil organic material. Nonetheless Eq. 1 works best in coarse textured soil, but
gives problems in the fıne textured and dense soils such
as heavy clay soils. The mixing law proposed by Roth et al. (1990) may be extended to a three-phase system to describe wet soil:
Ka = [I3 Kwater + (1- 4)) K e'soıl c4)- Ke`aır I" (2)
where is the soil porosity, Kwater, Ksoil, Kair are the
dielectric numbers of the aqueous, solid, and gaseous phase, respectively, and a is a geometric factor which depends on the spatial arrangement of the three phase
mixture. For an isotropic two phase mixture a = 0.5
(Alharti and Lange 1987). Roth et al. (1990) found a best-fit if a = 0.46 for various soils while disregarding the lower mobility of bound water. Dobson et al. (1985) determined by regression from data for different frequencies (1.4-18 GHz) and soil types (ranging from sandy loam to silty clay) and obtained a=0.65. According to Zegelin et al. (1992), Eq.2 works best in coarse textured soils. Topp et al.,
(2000) suggested at water contents above 0.15 m 3 M-3 in
soils with high clay content or salt, specific calibrations are needed for precise determinations of water content from TDR
Unlike the previous calibration assumptions, Ledieu et al. (1986) used a direct relation between measured transit time and volumetric water content. They estimated the transit time as the sum of the three transit times (sum of that through soil, water and air), which can be grouped in a transit time to in the dry soil on the one hand and an effect due to the presence of the water on the other. In this simple model this effect appears to be linear as shown by the relation:
t=to+AO (3)
Transit time, t, is in ns and O is in vol %. The time to is a constant for each soil. Practice has shown that with a 50 cm probe this constant varies between 5.8 and 6.1 ns, depending on the nature of the particles and on porosity.
The value of the coeffıcient A for that same probe length of
50 cm is less than 0.3, so that 1% variation in water content by volume results in a 0.3 ns difference in transit time. The formula used in practice is
= B (t - to) (4)
where B = 1/A, being approximately 3.5 for a 50 cm probe. The purpose of this study was to monitor the patterns of infiltration and percolation processes during simulated
rainfall and to follow the redistribution process by preventing evaporation in two soils.
Materials and Methods
Two soils, which are a clay loam and an organic soil, were used. Table 1 shows selected physical and chemical characteristics of them.
The experimental set-up consist of a plexy glass container, 75 cm x 40 cm x35 cm (hxlxw) equipped with arrays of 5 TDR probes and 5 tensiometers. The air dry materials were stepwise brought to an initial water content (prewetted) which were conditioned by the fact that tensiometers can not measure soil water pressure heads lower than -800 cm WH. The amount of the clay loam soil required to fill up the column to a bulk density of 1.22g cm .
3
to 55 cm was 89.9kg. To bring it to the desired moisture content (24 yol, %), 14.0 L water was used. This was 17.8 kg for the organic soil (for bulk density of 0.23 g cm -3) and 1.1 L water was used to bring it to 35 vol %.
During filling the column, TDR probes were inserted horizontally at 5, 15, 25, 35, and 45 cm depth. To synchronize the water content measurements using TDR probes, with soil water pressure head measurements 5 tensiometers were also inserted diagonally at the same depths, but they were located about 20 cm apart from the probes. Tensiometer readings were carried out using a pressure transducer. Water was applied to the surface of the container (0.14m 2) at a constant rate of 20 mm h -1 for 4.5hrs using a rainfall simulator. Water is discharged from
the sprinkling head through 144 capillaries.
Theory of the method of measurement: In the
present study, to obtain the soil specific calibration relationship, the approach of Ledieu et al. (1986) was used. They assumed a linear relation between the transit time and the volumetric water content. However Michiels and De Strooper (1989) later adapted this relation to be quadratic
t = ao + ai9 + a202 ( 5 )
A series of columns with different moisture contents (yol %) were prepared. A Tektronix-1502 model TDR instrument was used to measure the running time throughout the different soil columns. The running times for volumetric water contents for the clay loam soil
between initial water content, Oıa, and 0 = 36% were done
by using a computer program. For the other moisture contents (between O =36% and 0=50%), the running times were calculated by drawing tangent lines at the first and at the second inflection of the reflectogram. The intersection of two tangent lines, at the inflection points determines the begin and end points for running time calculation (Heimovaana and Bouten 1990).
Using the location of these two points, the running time of the pulse is calculated as follows;
6.67Dist.
t = (E - B) (6)
124 TAR1M BİLİMLERİ DERGİSİ 2002, Cilt 8, Sayı 2
Table 1. Selected characteristics of the olay loam and the organic soil Soil Soil texture,%
silt 33 CaCO3 Hydraulic conductivity 2,40.10-6 m.s-1 (8.6 mm hr " 1 ) 5.10-4 m.s.1 (1800 mm hr-1 ) Total pore yol., % 55,2 87,3 Ash ok olay 40 sand ok 16,9 Clay loam 27 Organic 2,6 51,7
where, t is running time (ns), B, begin point (in units of the screen), E, end point (in units of the screen), 6.67, returning time in air (ns), 250, amounts of units in scale distribution of the screen, Dist., optional scale distribution,
Vprop, propagation velocity in the cable (= 0.66 ).
A second order regression analysis was made by using the moisture content measured gravimetrically and the corresponding running time. This quadratic equation describes best the relation between water content and running time, for instance, for the olay loam soil r 2 = 0.942. This calibration equation for the clay loam soil is giyen as:
t = 4.2205 - 0.0285 6 + 0.00310 2 ( 7 )
Results and Discussion
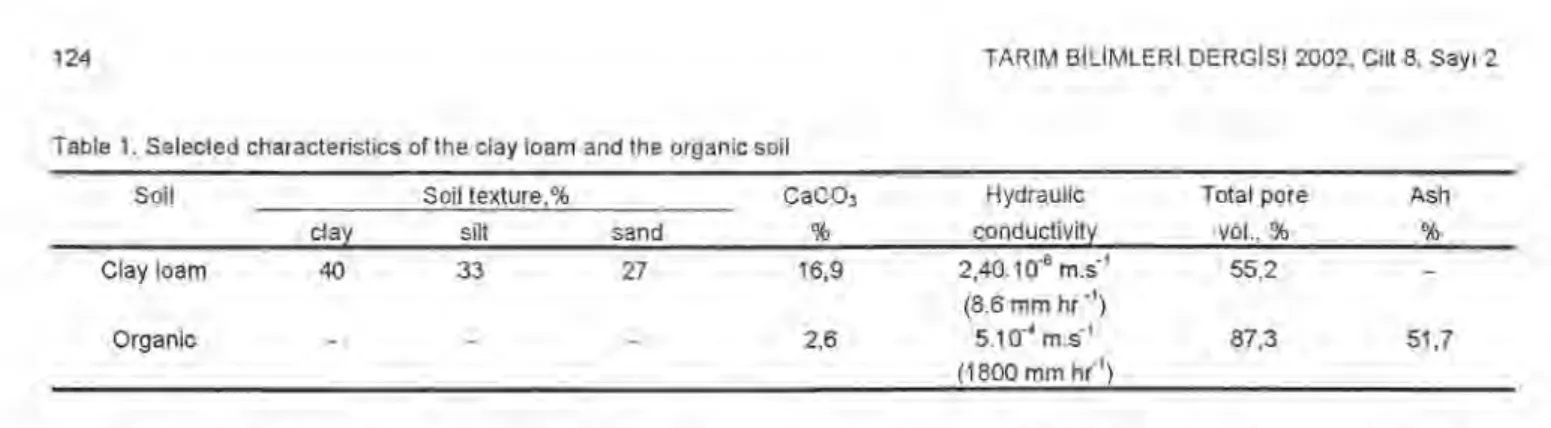
The infiltration pattern and water dynamics are giyen
in Figure 1 for both soils. From this fıgure it is observed
that water content changes in the clay loam soil during the first half an hour of the infiltration experiment occurred at the 5 and the 15 cm depths. The first change in water content at the depth of 25 cm was detected after only one hour. The reason for such delay is probably due to partially blocking of the soil surface porosity under the beating action of the falling water drops and to the swelling of the clay minerals of the very wet upper layer. The increase in moisture content at the depth of 35 cm is rather slow in comparison with the wetting velocity in the upper layer and reaches only 40 vol % at the end of the rainfall simulation experiment. In the top 25 cm the moisture content varies around 45 vol %. No moisture content changes were observed at the depth of 45 cm during the whole rainfall simulation test.
The direct calculation of the moisture content by TDR in the clay loam soil was not possible once it reaches a value above the 40 vol % due to - the very weak reflection at the end of the probe. It was observed by many researchers that in very wet clay soils the reflections at the end of the probe become difficult to detect and locate using a computer program (Zegelin et al., 1992). Contrary to the clay loam soil, most of the volumetric moisture content measurements with the TDR technique for the organic soil was estimated by the computer. Moisture contents were determined manually only near saturation.
The water movement and changes in the volumetric moisture content with depth in the organic soil was slower than that of the clay loam soil because of the high water storage capacity of the organic soil. The highest moisture level at the depth of 5 cm was observed after approximately 2.5 hours of simulated rainfall. The first change in moisture content at the depth of 15 cm is
detected after only 1 hour, and for the depths of 25 cm and 35 cm, 2.1 hours and 3.2 hours, respectively. The moisture content at 45 cm depth was not changed at the end of the rainfall simulation.
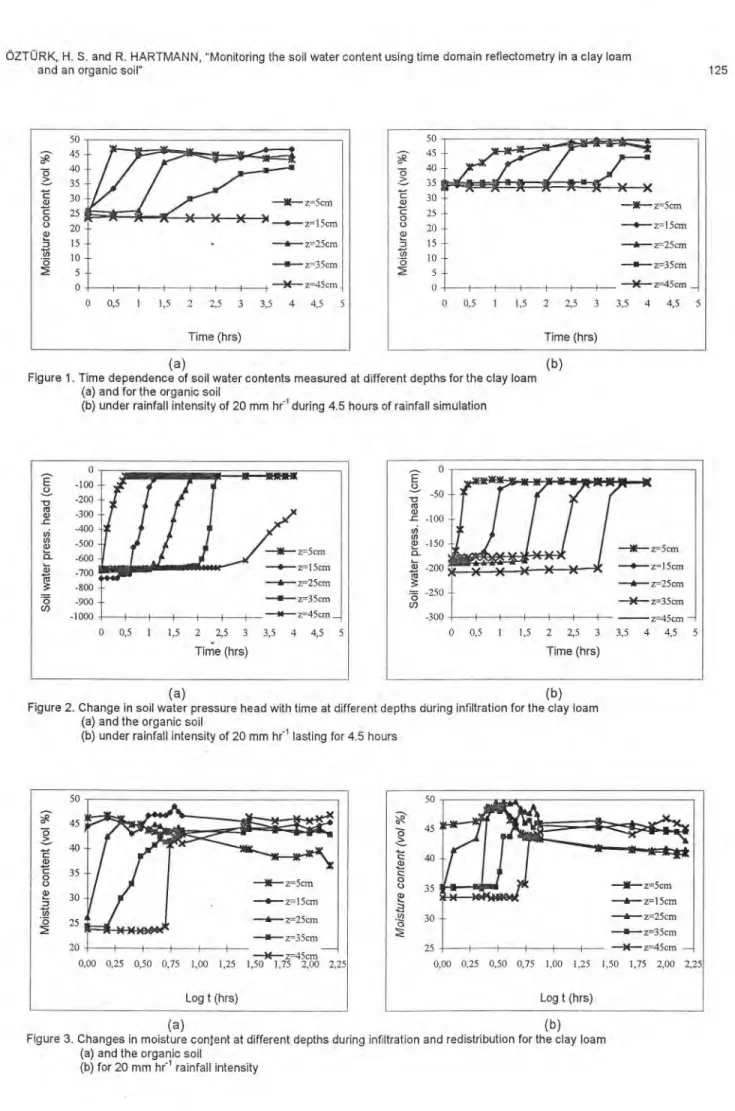
Figure 2 shows the changes in soil water pressure
head at fıve different depths. The changes (increases) in
soil water pressure head at different depths as a function of time and reaching a constant end value (-35 cm WH) occurred simultaneously with the increase in moisture content (compare Figure 1 with Figure 2).
The first change in soil water pressure heads for the olay loam soil was detected by the tensiometer at the depth of 5 cm 4 minutes after beginning of the rainfall simulation and reached a constant value of -37 cm WH after already 30 minutes. The same values were caught by tensiometers inserted at depths of 15, 25, and 35 cm, after 1.25, 2 and 3.1 hours, respectively. Although a change in soil water pressure head was detected by the tensiometer located at a depth of 45 cm after 3.8 hours, the measurements with the TDR probe did not show any change in moisture content. This may be due to stem flow of water around the tensiometer itself (Figure2).
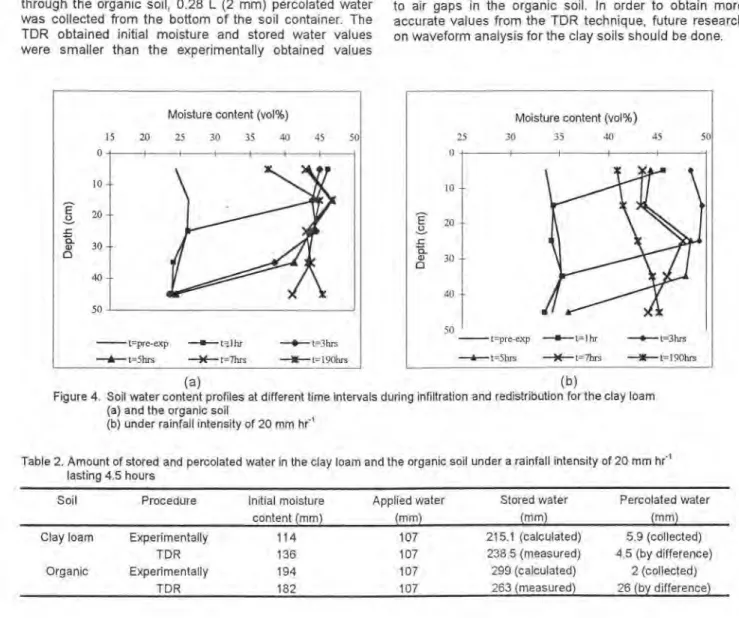
The redistribution of infiltrated water started immediately after the application of water through rainfall simulation was ceased. The water content decreased in the upper layers due to the downward flow of water in the soil profile resulted in an increase of moisture content at the bottom of the profile. The main forces affecting the redistribution process are gravitational force and soil matrix forces. The water movement process in the soil profile continued until the soil column reached equilibrium with respect to the hydraulic head. The changes in moisture content over time during infiltration and redistribution are shown in Figure 3. A logarithmic scale for the time parameter was used. The highest moisture content for the clay loam soil, 47.7 yol %, was detected by the probe inserted at the depth of 5 cm and measured 90 minutes after the end of rainfall simulation. Afterwards the soil moisture content gradually decreased to 36.7 vol % when the soil reached the equilibrium. The soil moisture at the 15 cm reached its highest value, 48.6 yol %, 2.2 hours after the end of the rainfall simulation. The moisture contents at the depths of 25 and 35 cm became approximately constant 6 hours after the start of the rainfall experiment in the olay loam soil. However they never went beyond 44 yol %. A constant increase in moisture content through the end of the experiment was detected at the depth of 45 cm. This is because of the storage of the percolated water coming constantly from the upper part of the soil column.
50 45 40 35 30 25 20 15 10 5 0 Mo is ture co n ten t ( y o l %) 0 0,5 1 1,5 2 2,5
--*--
z-5cm z- 15cm - z-25cm - z=35cm - X-- z-45cm 3 3,5 4 4,5 5 Time (hrs) 0 0,5 1 1,5 2 2,5 3 Time (hrs) (b) z- 5cm z 15cm z-25cm -111- z=3 5 cm --X-- z-45cm 3,5 4 4,5 5 30 z-15cm 25 -dıı - z - 25cm z=35cm Mo is ture co n ten t ( yo l %) 50 45 40 35 30 25 20 15 10 5 0 0 0,5 1 1,5 2 2,5 3 Time (hrs) - z5cm - z- 15 cnı - z25cm - z=35cm z-45cm 3,5 4 4,5 5 0 -100 -200 -300 -400 -500 -600 -700 -800 -900 -1000 So il wa te r p re ss. hea d ( cm) 'E 1-- -50 -cı rzı -c•
-100 vi ,a2 -150-
200 nı -250 00 -300 0 0,5 1 1,5 2 2,5 --3K-- z-5cm z- 15cm - z25cm -X- z-35cm z-45cm - 3 3,5 4 4,5 Time (hrs) 50 45 -6 35 -*-- z 5cm 20 z-45cm 0,00 0,25 0,50 0,75 1,00 1,25 1,50 1,75 2,00 2,25 Log t (hrs) 50 45 35 z-5cm z- 15cm 30 z -25cm z-35cm 25 z -45cm 0,00 0,25 0,50 0,75 1,00 1,25 1,50 1,75 2,00 2,25 Log t (hrs) ÖZTÜRK, H. S. and R. HARTMANN, "Monitoring the soil water content using time domain reflectometry in a clay loamand an organic soil" 125
(a)
Figure 1. Time dependence of soil water contents measured at different depths for the clay loam (a) and for the organic soil
(b) under rainfall intensity of 20 mm hr-1 during 4.5 hours of rainfall simulation
(a) (b)
Figure 2. Change in soil water pressure head with time at different depths during infiltration for the clay loam (a) and the organic soil
(b) under rainfall intensity of 20 mm hr-1 lasting for 4.5 hours
(a) (b)
Figure 3. Changes in moisture content at different depths during infiltration and redistribution for the clay loam (a) and the organic soit
Moisture content (vol%)
15 20 25 30 35 40 45 50
— t—pre exp t-3hrs
—h— t-5hrs —44-- t-7hrs t- 190hrs
Moisture content (vol%)
30 35 40 45 50 25 0
*'‘
10 — 20_c
75. .3) 30 — 40 — 50 — t— pre-exp t- 1hr t-5hrs --X— t 7hrs t-3hrs t- 190hrsSoil Procedure Initial moisture content (mm) Clay loam Experimentally 114
TDR 136 Organic Experimentally 194 TDR 182 Applied water (mm) Stored water (mm) Percolated water (mm) 107 215.1 (calculated) 5.9 (collected) 107 238.5 (measured) 4.5 (by difference) 107 299 (calculated) 2 (collected) 107 263 (measured) 26 (by difference)
126 TARIM BILIMLERI DERGISI 2002, Cilt 8, Sayı 2
Due to high storage capacity of the organic soil, it took a long time before the wetting front reaches a certain depth. Almost immediately after the end of the simulated rainfall, a decrease in moisture content in the upper 15 cm was observed which confirmed the high hydraulic conductivity for the organic soil once it reached the saturation. After almost 3 hours of redistribution an equilibrium situation was reached in the organic soil.
Soil water content profiles during the infiltration and redistribution are giyen in Figure 4. The initial water
contents through the soil profıle were 25% for clay loam
soil and 35% for the organic soil.
When the soil column reached the equilibrium in moisture content, the amount of stored and percolated water was calculated. The stored and percolated water obtained both experimentally and through TDR measurements are giyen in Table 2. The result of the TDR measured initial moisture content and stored water in the
clay loam soil profıle was higher than the experimentally
obtained results. The difference in amount of percolated water determined by difference and the amount collected was found rather small.
After the redistribution of 15 L demineralized water through the organic soil, 0.28 L (2 mm) percolated water was collected from the bottom of the soil container. The TDR obtained initial moisture and stored water values were smaller than the experimentally obtained values
(contrary to that of clay loam soil). Although the experimentally obtained initial moisture content value for the organic soil was close to the TDR obtained value, the stored water and percolated water value were quite different. This is due to less moisture was measured with TDR which may be due to unequal distribution of applied water for the organic soil.
Conclusions
In this present study the TDR technique was successfully used in order to follow changes in soil moisture contents at different depths in the soil columns. However, when the soil moisture content reached saturation the volumetric moisture contents could have not be measured with the computer controlled program for the clay loam soil since reflections at the end of the TDR probes were very weak. In that case the moisture contents were calculated manually from the running times read from the reflectograms and using the calibration curve. For the organic soil most of the measurements with TDR
probes were automatically transferred to moisture contents using a computer program. However TDR measured moisture content values were a little bit lower than the experimentally obtained results. This may be due to air gaps in the organic soil. In order to obtain more accurate values from the TDR technique, future research on waveform analysis for the clay soils should be done.
(a) (b)
Figure 4. Soil water content profiles at different time intervals during infiltration and redistribution for the clay loam (a) and the organic soil
(b) under rainfall intensity of 20 mm hr-1
Table 2. Amount of stored and percolated water in the clay loam and the organic soil under a rainfall intensity of 20 mm hr-1
ÖZTÜRK, H. S. and R. HARTMANN, "Monitoring the soil water content using time domain reflectometry in a clay loam
and an organic soil" 127
References
Alharti, A. and J. Lange, 1987. Soil water saturation: Dielectric determination, Water Resources Res. J. 23, 591-595. Baker, J. M. and R. R. Allmaras, 1990. System for automating
and multiplexing soil moisture measurement by time domain reflectometry, Soil Sci. Soc. Am. J. 54, 1-6, 1.
Dalton, F. N. and M. T. H. Van Genuchten, 1986. The time-domain reflectometry method for measuring soil water content and salinity, Geoderma, 38, 237-250.
Dobson, M. C., F. T. Ulaby, M. T. Hallikainen and M. A. El-Rayes, 1985. Microwave dielectric wave of wet soil, part 11: Dielectric mixing models, IEEE Transactions Geoscience Remote Sensing., 73, 616-623.
Heimovaara, T. J. and W. Bouten,1990. A computer-controlled 36 channel time domain reflectometry system for monitoring soil water contents, Water Resour. Res., 26, 2311-2316. Herkelrath, W. N., S. P. Hamburg and F. Murpy, 1991.Automatic
real-time monitoring of soil moisture in a remote field area with time domain reflectometry, Water Resour. Res. 27, 857-864.
Kachanoski, R. G., E. Pringle and A. L. Ward, 1992. A. Field measurements of soil travel times using time domain reflectometry, Soil Sci. Soc. Am. J., 56, 47-52.
Ledieu, J., P. De Ridder, P. De Clerck and S. Dauttebande, 1986. A method of measuring soil moisture by time domain reflectometry Journal of Hydrology, 88,319-328.
Michiels, P. and E. De Strooper, 1989. bepaling van het vochtgehalte van de bodem met behulp van time domain reflactometry. Theoretische beschouwingen. In: Hartmann R. Bodemfysica Basisprinciples (cursusnota's). Gent, Faculteit van de Landbouwwetschappen, P 50.
Patterson, D. E. and M. W. Smith, 1981. The measurement of unfrozen water content by TDR: Results from laboratory test, Can. Geotech. J. 18, 131-145.
Roth, K., R. Schulin, H. Flühler and W. Attinger, 1990. Calibration of time domain reflectometry for water content measurement using a composite dielectric approach, Water Resource Res. Vol. 26, No. 10, 2267-2273.
Topp, G. C., J. L. Davis and A.P. Annan, 1980. Electromagnetic determination of soil water content: measurements in coaxial transmission lines, Water Resour. Res. 16, 574-582. Topp G. C., S. J. Zegelin and I. White, 2000. Impacts of the real
and imaginary components of relative permittivity on time domain reflectometry measurements in soils. Soil Sci. Soc. Am. J. 64: (4) 1244-1252.
Vogeler, I., B. E. Clothier, S. R. Green, D. R. Scotter and R. W. Tilmann, 1996. Characterizing water and solute movement by time domain reflectometry and disk permeametry, Soil Sci. Soc. Am. J. 60, 5-12.
Ward A. L., R. G. Kachanoski and D. E. Elrick, 1994. Laboratory measurements of solute transport using time domain reflectometry, Soil Sci. Soc. Am. J. 58, 1031-1039.
Zegelin, S. J. and I. White, 1989. Improved field probes for soil water content and electrical conductivity measurement using time domain reflectometry, Water Resources Res., 25, 2367-2376.
Zegelin, S. J., I. White, G. and F. Rusell, 1992. A critique of the time domain reflectometry technique for determining field soil water content. Advances in measurement of soil physical properties: Bringing theory into practice, Soil Science Society America, Madison, WI, USA. Special Publication 30, 187-208.