JHEP03(2020)025
Published for SISSA by SpringerReceived: August 5, 2019 Revised: December 7, 2019 Accepted: January 18, 2020 Published: March 4, 2020
Search for dark matter particles produced in
association with a Higgs boson in proton-proton
collisions at
√
s = 13 TeV
The CMS collaboration
E-mail: [email protected]
Abstract: A search for dark matter (DM) particles is performed using events with a Higgs boson candidate and large missing transverse momentum. The analysis is based on proton-proton collision data at a center-of-mass energy of 13 TeV collected by the CMS experiment at the LHC in 2016, corresponding to an integrated luminosity of 35.9 fb−1. The search is performed in five Higgs boson decay channels: h → bb, γγ, τ+τ−, W+W−, and ZZ.
The results from the individual channels are combined to maximize the sensitivity of the analysis. No significant excess over the expected standard model background is observed in any of the five channels or in their combination. Limits are set on DM production in the context of two simplified models. The results are also interpreted in terms of a spin-independent DM-nucleon scattering cross section and compared to those from direct-detection DM experiments. This is the first search for DM particles produced in association with a Higgs boson decaying to a pair of W or Z bosons, and the first statistical combination based on five Higgs boson decay channels.
Keywords: Dark matter, Hadron-Hadron scattering (experiments), Higgs physics
JHEP03(2020)025
Contents
1 Introduction 1
2 The CMS detector and data set 5
3 Signal and background simulation 6
4 Event reconstruction 7
5 Analysis strategy 9
5.1 The h(→ bb) + pmissT channel 9
5.2 The h(→ γγ) + pmissT channel 10
5.3 The h(→ ττ) + pmissT channel 11
5.4 The h(→ WW) + pmissT channel 11
5.4.1 Background estimation 12
5.5 The h(→ ZZ) + pmissT channel 14
5.5.1 Background estimation 15
6 Statistical combination of the search channels 17
7 Systematic uncertainties 18
7.1 The h(→ WW) + pmissT channel 18
7.2 The h(→ ZZ) + pmissT channel 19
7.3 Systematic uncertainties in the combination 20
8 Results 22
8.1 The h(→ WW) + pmissT and h(→ ZZ) + pmissT channels 22
8.2 Results of the statistical combination 23
9 Summary 26
The CMS collaboration 37
1 Introduction
A host of astrophysical and cosmological observations confirm [1–4] that dark matter (DM) exists and makes up 26.4% of the total energy density of the universe [5]. However, all of the existing evidence for DM is based only on its gravitational interaction. Whether DM interacts with standard model (SM) particles in any other way remains an open question. There are a number of beyond-the-SM theories suggesting a particle nature of DM [6]. Several types of particle candidates for DM are proposed in these models, all compatible
JHEP03(2020)025
with the observed relic density of DM in the universe [7]. A favored hypothesis is that the bulk of DM is in the form of stable, electrically neutral, weakly interacting massive particles (WIMPs) [8], with masses in a range between a few GeV and a few TeV, thus opening the possibility of DM production at high-energy colliders [9].
Traditionally, searches for DM at colliders involve a pair of WIMPs that recoil against a visible SM particle or a set of SM particles. Because of the lack of electric charge and the small interaction cross section, WIMPs do not leave a directly detectable signal, but in a hadron collider experiment their presence can be inferred via an imbalance in the total momentum in the plane transverse to the colliding beams (~pTmiss), as reconstructed in the detector. This scenario gives rise to a potential signature where a set of SM par-ticles, X, are produced recoiling against the DM parpar-ticles, represented by the ~pTmiss (the “mono-X” signature). Recent searches at the CERN LHC considered X to be a hadronic jet [10,11], heavy-flavor quarks (bottom and top) [12,13], a photon [14,15], or a W or Z boson [11,16–18].
The discovery of an SM-like Higgs boson [19–21] extended the possibility of probing DM at colliders, complementing other mono-X searches. In this paper we designate the state observed at 125 GeV by the symbol h, since in the context of the theoretical models considered below, it does not correspond to the SM Higgs boson. Here, we present a search for the pair production of DM particles in association with a Higgs boson resulting in the final state h + pmissT [22, 23], referred to as the “mono-Higgs”. While in a typical mono-X search, the X particle is emitted as initial-state radiation, this process is strongly suppressed for the case of the Higgs boson because of the smallness of both the Higgs boson Yukawa couplings to light quarks and its loop-suppressed coupling to gluons. Thus, the mono-Higgs production can be either a result of final-state radiation of DM particles, or of a beyond-the-SM interaction of DM particles with the Higgs boson, typically via a mediator particle. A number of searches have been carried out by the ATLAS and CMS collaborations looking for the mono-Higgs signature in several Higgs boson decay channels, at center-of-mass energies of 8 and 13 TeV [24–32]. So far, none of these searches has observed a significant excess of events over the SM expectations.
In this paper, we describe the first search for mono-Higgs production in the W+W− and ZZ Higgs boson decay channels, as well as the combination of these searches with the previously published results in the bb [30,31], γγ [32], and τ+τ−[32] channels. (Hereafter,
for simplicity we refer to bb , τ+τ− and W+W− as bb, ττ and WW, respectively.) All
the analyses are based on a data sample of proton-proton (pp) collisions at √s = 13 TeV collected in 2016 and corresponding to an integrated luminosity of 35.9 fb−1.
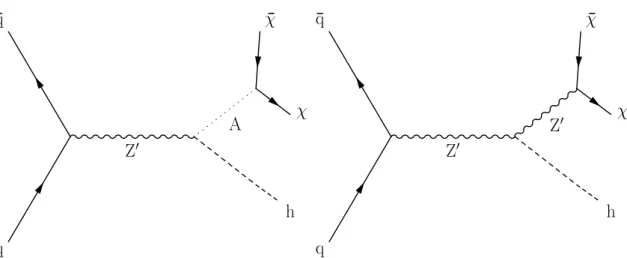
Two simplified models of DM production recommended by the ATLAS-CMS Dark Matter Forum [33] are investigated. Figure 1 shows representative tree-level Feynman diagrams corresponding to these two models. The diagram on the left describes a type-II two Higgs doublet model (2HDM) [34,35] further extended by a U(1)Z0 group and referred to as the Z0-2HDM [36]. In this model, the Z0 boson is produced via a quark-antiquark interaction and then decays into a Higgs boson and a pseudoscalar mediator A, which in turn can decay to a pair of Dirac fermion DM particles χ. The diagram on the right shows the production mechanism in the baryonic Z0 model [22], where Z0 is a vector boson
JHEP03(2020)025
Z
0A
q
¯
q
h
χ
¯
χ
Z
0Z
0q
¯
q
h
χ
¯
χ
Figure 1. Representative Feynman diagrams for the two benchmark signal models considered in this paper: the Z0-2HDM (left) and the baryonic Z0 model (right).
corresponding to a new baryon number U(1)B symmetry. The Z0 boson acts as a DM mediator and can radiate a Higgs boson before decaying to a pair of DM particles. A baryonic Higgs boson hb is introduced to spontaneously break the new symmetry and to generate the Z0boson mass via a coupling that is dependent on the hb vacuum expectation value. The Z0 boson couplings to quarks and the DM particles are proportional to the U(1)B gauge couplings. A mixing between the hb and h states allows the Z0 boson to radiate h, resulting in a mono-Higgs signature.
In the Z0-2HDM, the predicted DM production cross section depends on number of parameters. However, if the mediator A is produced on-shell, the kinematic distributions of the final-state particles depend only on the Z0 and A boson masses, m
Z0 and mA. In this paper, a scan in mZ0 between 450 and 4000 GeV and in mA between 300 and 1000 GeV is performed. The values of mA below 300 GeV have been already excluded by the existing constraints on flavor changing neutral currents in the b → sγ transitions [34], and hence are not considered in the analysis. The masses of the 2HDM heavy Higgs boson and the charged Higgs boson are both fixed to the mA mass. The ratio of the vacuum expectation values of the two Higgs doublets, tan β, is varied from 0.4 to 10. The DM particle mass is fixed to 100 GeV, the A-DM coupling strength gχ is fixed to 1, and the Z0coupling strength to quarks g
Z0 is fixed to 0.8. The branching fraction of the decay of A to DM particles B(A → χ ¯χ) decreases as the mass of the DM candidate (mχ) increases, for the range of mA considered in this analysis. However, since the relative decrease inB(A → χ ¯χ) is less than 7% as mχ increases from 1 to 100 GeV, the results shown in this paper for mχ= 100 GeV are also applicable to lighter DM particles.
The results are expressed in terms of the product of the signal production cross section and branching fraction B(A → χ ¯χ), where B(A → χ ¯χ) is ≈100% for mA = 300 GeV and decreases for mA greater than twice the mass of the top quark, where the competing decay A → tt becomes kinematically accessible. The contribution to the mono-Higgs signal from another process possible in the model, Z0 → Z(→ νν) + h, is not considered in this analysis. Further details on the choice of the model parameters are given in refs. [27,37].
JHEP03(2020)025
0 200 400 600 800 1000 1200 [GeV] T miss p 0 0.05 0.1 0.15 0.2 0.25 0.3 Arbitrary units = 300 GeV A = 600 GeV, m Z' m = 400 GeV A = 600 GeV, m Z' m = 300 GeV A = 1200 GeV, m Z' m = 500 GeV A = 1200 GeV, m Z' m = 300 GeV A = 2000 GeV, m Z' m = 600 GeV A = 2000 GeV, m Z' mCMS
Simulation = 100 GeV χ = 1, m χ = 0.8, g Z' g H = m ± H = m A = 1.0, m β tan Z'-2HDM, Dirac DM 0 100 200 300 400 500 600 700 [GeV] T miss p 0 0.05 0.1 0.15 0.2 0.25 Arbitrary units = 500 GeV χ = 1000 GeV, m Z' m = 100 GeV χ = 1000 GeV, m Z' m = 1 GeV χ = 1000 GeV, m Z' m = 1 GeV χ = 500 GeV, m Z' m = 1 GeV χ = 100 GeV, m Z' m = 1 GeV χ = 10 GeV, m Z' mCMS
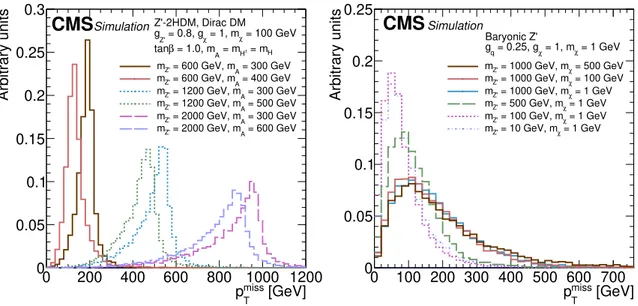
Simulation Baryonic Z' = 1 GeV χ = 1, m χ = 0.25, g q gFigure 2. The distribution of pmissT at the generator level for the Z0-2HDM (left), showing the dependence on the two main model parameters varied in the analysis, m
Z0 and mA, and for the
baryonic Z0model (right), showing the variation of pmissT as a function of mZ0 and mχ. All other
pa-rameters of the models are fixed to the values specified in the text. The distributions are normalized to unit area.
We note that for the chosen set of parameters, the values of mZ0 within our sensitivity reach have been recently excluded by the ATLAS and CMS searches for dijet resonances at √
s = 13 TeV [38–41]. Nevertheless, we keep this benchmark, specifically developed for the LHC Run-2 searches [33], to allow a direct comparison with the results of other mono-Higgs searches. Given that the kinematic distributions of the final states depend only very weakly on the value of the g
Z0 coupling, our results can be reinterpreted for lower gZ0 values, where the interplay between the mono-Higgs and the dijet analysis sensitivities changes.
For the baryonic Z0 model, m
Z0 between 100 and 2500 GeV and mχ between 1 and 700 GeV are used for this study. The Z0-DM coupling is fixed to gχ = 1 and the Z0-quark coupling is fixed to gq= 0.25. The mixing angle between the baryonic Higgs boson and the SM-like Higgs boson is set to sin θ = 0.3, and the coupling between the Z0 boson and h is assumed to be proportional to m
Z0. The branching fractions of the Higgs boson decays are altered for m
Z0 . mh/2, because the decay h→ Z 0
Z0(∗) becomes kinematically accessible. Therefore the region mZ0 < 100 GeV, for which the modification of the h branching fractions is sizable, is not considered in the analysis. For both benchmark models, h is assumed to have a mass of 125 GeV. A considerable amount of pmissT is expected, as shown in figure2. The reason that the pmissT spectrum is harder for the Z
0
-2HDM is that the DM particles are produced via a resonant mechanism in this case, whereas for the baryonic Z0 model they are not. The difference in shape becomes more marked as mZ0 increases. In figure2(right) it can be seen that the shape of the pmissT distribution is almost independent of mχ in the baryonic Z0 model, and depends most strongly on mZ0.
Although the signal sensitivity in the h → bb channel is higher than in the other final states considered (γγ, ττ, WW, and ZZ) because of the channel’s large branching fraction
JHEP03(2020)025
and manageable background in the large-pmissT region, the statistical combination of all five decay modes is performed to improve the overall sensitivity. The h → γγ and h → ZZ channels exhibit better resolution in the reconstructed Higgs boson invariant mass, while the h → ττ, h → WW, and h → ZZ channels benefit from lower SM backgrounds, which results in a higher sensitivity for signals with a soft pmissT spectrum.
In the h → bb channel analysis, the h is reconstructed from two overlapping b jets. Thus different approaches are used for the two models, because of the difference in the average Lorentz boost of the Higgs boson, which is higher in the Z0-2HDM than in the baryonic Z0 model. The Higgs boson is reconstructed using a jet clustering algorithm with a distance parameter of 0.8 for the Z0-2HDM and 1.5 for the baryonic Z0 model. For the baryonic Z0 model, a simultaneous fit of the distribution of the recoil variable in the signal region (SR) and the control regions (CRs) is performed to extract the signal. For the Z0-2HDM, a parametric fit of the Z0 boson transverse mass is used to estimate the major backgrounds and to extract the signal.
The search in the h → γγ channel [32] uses a fit to the diphoton invariant mass distribution to extract the signal. This analysis is performed in two categories distinguished by the pmissT value, high (>130 GeV) and low (50–130 GeV), in order to be sensitive to a large variety of possible signals.
The search in the h → ττ channel [32] is based on the combination of the events for the three τ lepton decay modes with the highest branching fractions: τhτh, µτh, and eτh, where τh denotes a hadronically decaying τ lepton. After requiring a pmissT (>105 GeV) in order to suppress the background sufficiently, the signal is extracted by performing a simultaneous fit in the SR and in the CRs to the transverse mass of the Higgs boson reconstructed from the two τ leptons. In the h → WW channel search, the fully leptonic decays of the two W bosons are considered, requiring one lepton to be an electron and the other to be a muon, in order to reduce the contamination from the Z → e+e− and Z → µ+µ− backgrounds. The h → ZZ search is performed in the fully leptonic decay
channel of the Z boson pair: h → ZZ → 4`. The analysis strategy follows closely the measurement of the Higgs boson properties in the same channel [42].
The paper is organized as follows. After a brief introduction of the CMS detector in section2, the data and simulated event samples are described in section3. The event recon-struction and the analysis strategy for each Higgs boson decay mode used in the statistical combination are detailed in sections 4 and 5, respectively. The combination procedure and the main systematic uncertainties are described in sections 6 and7, respectively. The results are presented in section8, and the paper is summarized in section 9.
2 The CMS detector and data set
The central feature of the CMS apparatus is a superconducting solenoid of 6 m internal diameter, providing a magnetic field of 3.8 T. Within the solenoid volume are a silicon pixel and strip tracker, a lead tungstate crystal electromagnetic calorimeter (ECAL), and a brass and scintillator hadron calorimeter (HCAL), each composed of a barrel and two endcap sections. Forward calorimeters, made of steel and quartz fibres, extend the pseudorapidity
JHEP03(2020)025
(η) coverage provided by the barrel and endcap detectors. Muons are detected in gas-ionization chambers embedded in the steel flux-return yoke outside the solenoid.
Events of interest are selected using a two-tiered trigger system [43]. The first level, composed of custom hardware processors, uses information from the calorimeters and muon detectors to select events at a rate of around 100 kHz in a time of less than 4 µs. The second level, known as the high-level trigger, consists of a farm of processors running a version of the full event reconstruction software optimized for fast processing, and reduces the event rate to around 1 kHz before data storage.
A more detailed description of the CMS detector, together with a definition of the coordinate system used and the relevant kinematic variables, can be found in ref. [44].
The pp collision data were collected at√s = 13 TeV in 2016. The time spacing between adjacent bunches of 25 ns leads to an average number of pp interactions per bunch crossing of 23 assuming the pp inelastic cross section of 69.2 mb [45]. The integrated luminosity of the data sample used in all the analyses described in this paper corresponds to 35.9 fb−1, after imposing data quality requirements.
3 Signal and background simulation
Signal samples for the five Higgs boson decay modes are generated at leading order (LO) in perturbative quantum chromodynamics (QCD) using the MadGraph5 amc@nlo v2.3.0 generator [46,47], for both the Z0-2HDM and baryonic Z0 model [33]. The Higgs boson is treated as a stable particle during the generation, and its decays are described subsequently using pythia 8.212 [48].
A detailed description of the simulated samples used for the h → bb, h → γγ, and h → ττ analyses can be found in refs. [30–32]. The production of a Higgs boson in association with a Z boson decaying to a pair of neutrinos is an irreducible background for all the final states considered. Other Higgs boson backgrounds originating from gluon-gluon fusion (ggF) and vector boson fusion (VBF) production modes are small. These backgrounds are simulated at next-to-LO (NLO) in QCD with powheg v2 [49–51].
The main nonresonant backgrounds in the h → WW analysis are from the continuum WW, single top quark, and top quark pair production. The continuum WW production is simulated in different ways: powheg [52] is used to generate qq → WW events at NLO precision, whereas gg → WW events are generated at LO using mcfm v7.0 [53–55]. The simulated qq → WW events are reweighted to reproduce the pWWT distribution from the pT-resummed calculation at next-to-NLO (NNLO) plus next-to-next-to-leading logarithmic precision [56,57]. The LO gg → WW cross section, obtained directly from mcfm, is further corrected to NNLO precision via a K factor of 1.4 [58]. Single top quark, tt , WZ, and Wγ∗ backgrounds are generated at NLO with powheg. Drell-Yan (DY) production of Z/γ∗ is generated at NLO using MadGraph5 amc@nlo, and the pT spectrum of the dilepton pairs is reweighted to match the distribution observed in dimuon events in data. Other multiboson processes, such as Wγ, ZZ, and VVV (V = W or Z), are generated at NLO with MadGraph5 amc@nlo. All samples are normalized to the latest available theoretical cross sections, NLO or higher [53,54,59].
JHEP03(2020)025
In the h→ ZZ analysis, the SM production mechanism constitutes a major background because this has the same experimental signature and satisfies the low pmissT threshold used in the analysis. It is simulated with powheg [49,50, 60] in four main production modes: ggF, including quark mass effects [61]; VBF [62]; associated production with a top quark pair (tt h) [63]; and associated production with a vector boson (Wh, Zh), using the minlo hvj [64] extension of powheg. In all cases, the Higgs boson is forced to decay via the h → ZZ → 4` (` = e, µ, or τ) channel. The description of the decay of the Higgs boson to four leptons is obtained using the JHUgen 7.0.2 generator [65,66]. In the case of Zh and tt h production, the Higgs boson is allowed to decay as h → ZZ → 2` + X, such that four-lepton events where two leptons originate from the decay of the associated Z boson or top quarks are also taken into account in the simulation. The cross sections for the processes involving SM Higgs boson production are taken from ref. [67].
All processes are generated using the NNPDF3.0 [68] parton distribution functions (PDFs), with the precision matching the parton-level generator precision. The pythia generator with the underlying event tune CUETP8M1 [69] is used to describe parton show-ering and fragmentation. The detector response is simulated using a detailed description of the CMS apparatus, based on the Geant4 package [70]. Additional simulated pp min-imum bias interactions in the same or adjacent bunch crossings (pileup) are added to the hard scattering event, with the multiplicity distribution adjusted to match that observed in data.
4 Event reconstruction
The particle-flow (PF) algorithm [71] aims to reconstruct and identify each individual par-ticle in an event, with an optimized combination of information from the various elements of the CMS detector. The energy of photons is obtained from the ECAL measurement. The energy of electrons is determined from a combination of the electron momentum at the primary interaction vertex as determined by the tracker, the energy of the correspond-ing ECAL cluster, and the energy sum of all bremsstrahlung photons spatially compatible with originating from the electron track [72]. The energy of muons is obtained from the curvature of the corresponding track. The energy of charged hadrons is determined from a combination of their momentum measured in the tracker and the matching ECAL and HCAL energy deposits, corrected for zero-suppression effects and for the response function of the calorimeters to hadronic showers. Finally, the energy of neutral hadrons is obtained from the corresponding corrected ECAL and HCAL energies.
Electron candidates are required to have|η| < 2.5. Additional requirements are applied to reject electrons originating from photon conversions in the tracker material or jets mis-reconstructed as electrons. Electron identification criteria rely on observables sensitive to the bremsstrahlung along the electron trajectory and on the geometrical and momentum-energy matching between the electron track and the associated momentum-energy cluster in the ECAL, as well as on the ECAL shower shape observables and association with the primary vertex. Muon candidates are reconstructed within |η| < 2.4 by combining information from the silicon tracker and the muon system. Identification criteria based on the number of measurements in the tracker and in the muon system, the fit quality of the muon track, and
JHEP03(2020)025
its consistency with its origin from the primary vertex are imposed on the muon candidates to reduce the misidentification rate.
For each event, hadronic jets are clustered from PF candidates using the infrared- and collinear-safe anti-kT algorithm [73, 74], with a distance parameter of 0.4 (AK4 jets) or 0.8 (AK8 jets). Jet momentum is determined as the vectorial sum of all particle momenta in the jet, and is found from simulation to be, on average, within 5 to 10% of the true momentum over the entire pT spectrum and detector acceptance. Pileup interactions can result in additional spurious contributions to the jet momentum measurement from tracks and calorimetric energy depositions. To mitigate this effect, tracks identified to be orig-inating from pileup vertices are discarded and a correction based on the jet area [75] is applied to account for the neutral pileup particle contributions. Jet energy corrections are derived from simulation to bring the measured response of jets to that of particle-level jets on average. In situ measurements of the momentum balance in dijet, photon+jet, Z+jet, and multijet events are used to account for any residual differences in the jet energy scale (JES) between data and simulation [76]. The jet energy resolution (JER) amounts typically to 15% at pT = 10 GeV, 8% at 100 GeV, and 4% at 1 TeV. Additional selection criteria are applied to remove jets potentially dominated by anomalous contributions from various subdetector components or reconstruction failures [77].
At large Lorentz boosts, the two b quarks from the Higgs boson decay may produce jets that overlap and make their individual reconstruction difficult. In this case, either the AK8 jets or larger-area jets clustered from PF candidates using the Cambridge-Aachen algorithm [78, 79] with a distance parameter of 1.5 (CA15 jets) are used. To reduce the impact of particles arising from pileup interactions when reconstructing AK8 or CA15 jets, the four-vector of each PF candidate matched to the jet is scaled with a weight calculated with the pileup-per-particle identification algorithm [80] prior to the clustering. The CA15 jets are also required to be central (|η| < 2.4). The “soft-drop” jet grooming algorithm [81] is applied to remove soft, large-angle radiation from the jets. The mass of a groomed AK8 or CA15 jet are referred to as mSD.
To identify jets originating from b quark fragmentation (b jets), two b tagging algo-rithms are used. The combined secondary vertex (CSVv2) [82] and the combined multi-variate analysis (cMVAv2) algorithms [82] are used to identify AK4 jets originating from b quarks by their characteristic displaced vertices. For the AK8 jets, subjets inside the jet are required to be tagged as b jets using the CSVv2 algorithm. A likelihood for the CA15 jet to contain two b quarks is derived by combining the information from the primary and secondary vertices and tracks in a multivariate discriminant optimized to distinguish CA15 jets originating from the h → bb decay from those produced by energetic light-flavor quarks or gluons [31].
Hadronically decaying τ leptons are reconstructed from jets using the hadrons-plus-strips algorithm [83]. This algorithm uses combinations of reconstructed charged hadrons and energy deposits in the ECAL to identify the three most common hadronic τ lepton decay modes: 1-prong, 1-prong+π0(s), and 3-prong. The τh candidates are further re-quired to satisfy the isolation criteria with an efficiency of 65 (50)% and a misidentification probability of 0.8 (0.2)% in the τhτh (eτh or µτh) channel.
JHEP03(2020)025
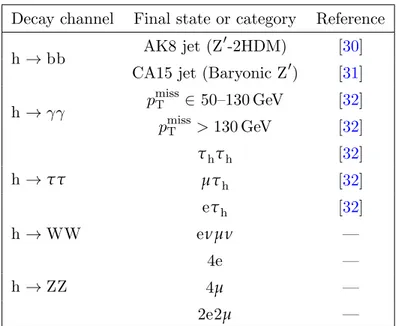
Decay channel Final state or category Reference
h → bb AK8 jet (Z
0
-2HDM) [30] CA15 jet (Baryonic Z0) [31]
h → γγ p miss T ∈ 50–130 GeV [32] pmissT > 130 GeV [32] h → ττ τhτh [32] µτh [32] eτh [32] h → WW eνµν — h → ZZ 4e — 4µ — 2e2µ —
Table 1. Summary of the individual channels entering the combination. Analyses are categorized based on the model, pmissT selection, and subsequent decay products listed here. The categorization
is the same for both the Z0-2HDM and the Baryonic Z0 model for all decay channels except, as indicated, h→ bb. A dash (“—”) in the last column implies that the analysis is presented in this paper.
The ~pTmiss is reconstructed as the negative vectorial sum of all PF particle candidate momenta projected on the plane transverse to the beams. Since the presence of pileup induces a degradation of the pmissT measurement (pmissT resolution varies almost linearly from 15 to 30% as the number of vertices increases from 5 to 30 [84]), affecting mostly backgrounds with no genuine pmissT , an alternative definition of pmissT that is constructed only using the charged PF candidates (“tracker pmissT ”) is used in the h → WW analysis. In the rest of the paper, pmissT corresponds to the PF pmissT , unless specified otherwise.
5 Analysis strategy
In this section we briefly discuss the analysis strategies in the previously published [30–32] h→ bb, h → γγ, and h → ττ, channels, and provide full descriptions of the new analyses in the h → WW and h → ZZ decay channels. The summary of all the decay channels contributing to the combination is presented in table1.
5.1 The h(→ bb) + pmissT channel
The events used in this final state are selected using a triggers that require large amount (> 90 or > 120 GeV) of pmissT , or HTmiss defined as the magnitude of the vectorial sum of the transverse momenta of all jets with pT > 20 GeV in an event. The trigger selection is 96 (100)% efficient for events that subsequently have pmissT > 200 (350) GeV in the off-line reconstruction. As can be seen in figure 2, the Lorentz boosts of the Higgs boson are different for the Z0-2HDM and baryonic Z0 model. The events with large boost in the
JHEP03(2020)025
Z0-2HDM are reconstructed using a large-radius AK8 jet with pT> 200 GeV and|η| < 2.4. In addition, the h → bb topology is selected by requiring at least one subjet of the AK8 jet to be b tagged. The analysis considers separately two categories, distinguished by the number of b tagged subjets in the event, one or two, the latter being the high-purity category with higher sensitivity. For events with lower boost in the baryonic Z0 model, Higgs boson candidates are reconstructed using CA15 jets.
To select the h → bb candidates using the AK8 jet, one or both subjets are required to pass the loose b tagging criteria, which has an efficiency of 85%, and a misidentification rate of about 10% for jets originating from light-flavor quarks or gluons. In the case of the CA15 jets, a multivariate double b tagging algorithm [82] is used to discriminate the signal from the background of light-flavor jets [31], with an efficiency of 50% and a misidentification rate of 10%. The AK8 (CA15) analysis requires the Higgs boson candidate mass to be in the 105–135 (100–150) GeV range to reduce nonresonant backgrounds. The difference in the two mass window requirements is primarily driven by the differences in the performance of the two algorithms and in the jet mass resolutions. For both analyses, the mass window was chosen to maximize the signal sensitivity. In order to further reduce the background contributions from W + jets and tt production, events with an electron, muon, photon (pT > 10 GeV), or τh (pT > 18 GeV) candidates passing loose identification and isolation criteria are vetoed. Furthermore, in the AK8 analysis, the number of additional b tagged AK4 jets with pT> 20 GeV is required to be zero, while in the CA15 analysis, the number of AK4 jets with pT> 30 GeV, well-separated from the CA15 jet in the event, is required to be at most one. The sensitivity of the analyses is further enhanced by using jet substructure variables. The full details of the event selection for the AK8 and CA15 jet analyses can be found in refs. [30] and [31], respectively.
5.2 The h(→ γγ) + pmissT channel
Signal candidate events in the h → γγ analysis are selected using a diphoton trigger with asymmetric pT thresholds of 30 and 18 GeV on the leading and subleading photons, respectively, and loose identification and isolation requirements imposed on both photon candidates. The diphoton invariant mass is further required to exceed 90 GeV.
Slightly higher thresholds of 30 (20) GeV on the leading (subleading) photon pT and of 95 GeV on the diphoton mass are used offline. The photon candidates are required to pass the isolation criteria if the spatial distance in η–φ plane (∆R = p(∆η)2+ (∆φ)2) between the two photons exceeds 0.3. The isolation selection is not used for photons that are coming from the decay of a highly Lorentz-boosted Higgs boson, as the two photons are likely to be found in the isolation cone of one another. The analysis is performed in two categories distinguished by the value of pmissT : high-pmissT (>130 GeV) and low-pmissT (50–130 GeV).
The multijet background, with a large pmissT in an event originating from the mismea-surement of the energy of one or more jets, is reduced by allowing at most two jets with pT > 30 GeV. To suppress the contribution from the multijet background, the azimuthal separation between the direction of any jet with pT > 50 GeV and ~pTmiss is required to exceed 0.5 radians. Finally, to select signal-like events with the DM particles recoiling
JHEP03(2020)025
against the Higgs boson, the azimuthal separation between ~pTmiss and the direction of the Higgs boson candidate reconstructed from the diphoton system is required to exceed 2.1 radians. More details of the event selection can be found in ref. [32].
5.3 The h(→ ττ) + pmissT channel
In the h → ττ analysis, the three final states with the highest branching fractions are analyzed: τhτh, µτh, and eτh. The events are selected online with a trigger requiring the presence of two isolated τh candidates in the τhτh final state, and a single-muon (single-electron) trigger in the µτh(eτh) final state. Electron, muon, and τhcandidates passing the identification and isolation criteria are combined to reconstruct a Higgs boson candidate in these three final states. The signal events are then selected with the requirements: pmissT > 105 GeV and visible pT of the τ τ system > 65 GeV. To ensure that the τ τ system originates from the Higgs boson, the visible mass of the τ τ system is required to be less than 125 GeV. In order to reduce the contribution from multilepton and tt backgrounds, the events are vetoed if an additional electron, muon, or a b tagged jet is present. More details of the event selection can be found in ref. [32].
5.4 The h(→ WW) + pmissT channel
The search in the h→ WW decay channel is performed in the fully leptonic, opposite-sign, different-flavor (eµ) final state, which has relatively low backgrounds. The presence of the neutrinos and the DM particles escaping detection results in large pmissT in signal events. The selected eµ +pmissT events include a contribution from the h → WW → ττντντ process
with both τ leptons decaying leptonically. Several background processes can lead to the same final state, dominated by tt and WW production.
Online, events are selected using a suite of single- and double-lepton triggers. In the offline selection, the leading (subleading) lepton is required to have pT > 25 (20) GeV. Electron and muon candidates are required to be well-identified and isolated to reject the background from leptons inside jets. Backgrounds from low-mass resonances are reduced by requiring the dilepton invariant mass (m``) to exceed 12 GeV, while backgrounds with three leptons in the final state are reduced by vetoing events with an additional well-identified lepton with pT > 10 GeV. The pmissT in the event is required to exceed 20 GeV in order to reduce the contribution from instrumental backgrounds and Z/γ∗ → τ+τ− decays. To suppress the latter background, the pTof the dilepton system is required to be greater than 30 GeV and the transverse mass of the dilepton and ~pTmiss system, mhT, is required to be greater than 40 GeV. In order to reduce the Z/γ∗ → e+e−, µ+µ−or τ+τ−background with
pmissT originating either from τ lepton decays or from mismeasurement of the energies of e, µ or additional jets, a variable pmissT,proj [85] is introduced. This is defined as the projection of ~pTmiss in the plane transverse to the direction of the nearest lepton, unless this lepton is situated in the opposite hemisphere to ~pTmiss, in which case pmissT,projis taken to be pmissT itself. A selection using this variable efficiently rejects Z/γ∗ → `` background events, in which the ~
pTmissis preferentially aligned with leptons. Since the pmissT resolution is degraded by pileup, a quantity pmissT,mp is defined as the smaller of the two pmissT,projvalues: the one based on all the PF candidates in the event, and the one based only on the reconstructed tracks originating
JHEP03(2020)025
Events / 10 GeV
2000 4000
Higgs boson Z+jets
Others WW
Top Nonprompt
Data Syst. unc.
= 300 GeV A = 1200, m Z' Z'-2HDM: m = 1.75 fb (x 500) Β × σ = 1 GeV χ = 500 GeV, m Z' Baryonic Z': m = 24.5 fb (x 100) Β × σ DM + h(WW) → Z' CMS (13 TeV) -1 35.9 fb [GeV] ll m 0 100 200 300 400 Data / MC 0.50 1 1.5 Events / 0.2 2000 4000 6000
Higgs boson Z+jets
Others WW
Top Nonprompt
Data Syst. unc.
= 300 GeV A = 1200, m Z’ Z’-2HDM: m = 1.75 fb (x 500) Β × σ = 1 GeV χ = 500 GeV, m Z’ Baryonic Z’: m = 24.5 fb (x 100) Β × σ DM + h(WW) → Z’ CMS (13 TeV) -1 35.9 fb ∆R ll 0 1 2 3 4 5 Data / MC 0.50 1 1.5
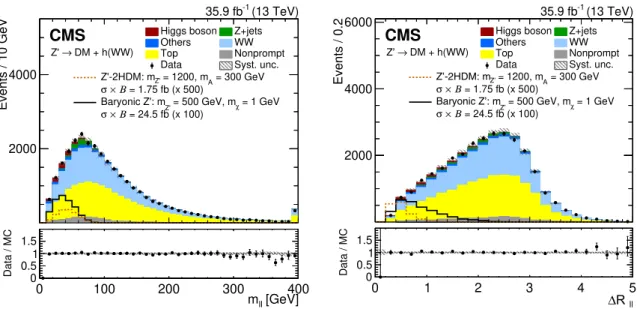
Figure 3. The distribution of m``(left) and ∆R``(right) after the preselection, expected from MC
simulation (stacked histograms) and observed in data (points with vertical bars). The systematic uncertainties, discussed in section 7.1, are shown by the hatched region. Two signal benchmarks, corresponding to the Z0-2HDM (dotted orange line) and baryonic Z0 (solid black line) model are superimposed. The signal is normalized to the product of cross section andB, where B represents the h → WW branching fraction. The signal distributions are scaled up by a factor 500 (100) for the Z0-2HDM (baryonic Z0 model), to make them more visible. The lower panel shows the ratio of the data to the predicted SM background.
from the primary vertex. A requirement pmissT,mp > 20 GeV is effective in suppressing the targeted background. The above requirements define the event preselection.
The expected signal significance is enhanced by introducing two additional selections: m`` < 76 GeV and the distance in η–φ space between the two leptons ∆R`` < 2.5, as illustrated in figure 3. The first requirement exploits the fact that the invariant mass of the leptons coming from the h → WW decay tends to be low because of the presence of the two neutrinos in the decay chain and of the scalar nature of the Higgs boson. The second requirement utilizes the fact that the Higgs boson in signal events recoils against the DM particles and is highly boosted.
5.4.1 Background estimation
Since full kinematic reconstruction of the Higgs boson mass and pT is impossible in this decay channel because of the presence of undetected neutrinos and DM particles, to max-imize the sensitivity of the search, a boosted decision tree (BDT) multivariate classifier has been trained for each of the two signal models. The BDT exploits the following input variables: • transverse masses: mhT, m W1 T , m W2 T ; • lepton transverse momenta: p``T, p
`1 T, p
`2 T;
JHEP03(2020)025
• missing transverse momenta: PF pmissT , tracker p miss T , p
miss T,mp; • angular variables: ∆R``, ∆φ``, ∆φpmiss
T `1, ∆φp miss T `2; and • dilepton invariant mass: m``.
Here, mWi T = p 2p`i Tp miss T (1− cos ∆φpmiss
T `i), where i = 1 (i = 2) defines the transverse mass of ~pTmiss and the leading (subleading) lepton in the event, and ∆φ`` is the azimuthal angle between the directions of the two lepton momenta.
For both benchmark models, the BDT training considers processes with two prompt leptons and genuine pmissT (WW, tt , tW, and h → WW production) as the backgrounds. For the Z0-2HDM (baryonic Z0) model, simulated signal samples with mA = 300 GeV (mχ = 1 GeV) with various values of m
Z0 have been used for training. The chosen signal points correspond to the region of maximum sensitivity of the h → WW analysis for both models.
The main background processes arise from top quark (tt and single top quark pro-duction, mainly tW), nonresonant WW events, and nonprompt leptons. The contribution of nonprompt-lepton background in the SR is determined entirely from data, while the contributions of the top quark, WW, and Z/γ∗ → τ+τ− background are estimated us-ing simulated samples. The normalizations of simulated backgrounds are obtained usus-ing dedicated CRs that are included in the maximum-likelihood fit used to extract the signal, together with the SR. Smaller backgrounds, WZ and W γ∗, are estimated using simula-tion after applying a normalizasimula-tion factor estimated in the respective CRs. The WZ CR is defined by requiring the presence of two opposite-sign, same-flavor leptons, compatible with the decay of a Z boson and one additional lepton of a different flavor, consistent with originating from a W boson decay. In the W γ∗ CR, the two leptons produced by the decay of the virtual photon are required to have pT > 8 GeV and be isolated. Since the two leptons may be close to each other, the isolation is computed without taking into account the contribution of lepton tracks falling in the isolation cone. An additional lepton consistent with originating from the W decay is required. The WZ and W γ∗ CRs are not used in the maximum-likelihood fit; instead, the normalization scale factors are extracted and directly applied to the corresponding simulated samples. The remaining backgrounds from diboson and triboson production are estimated directly from simulation.
The gg → W+W− and qq → W+W− backgrounds are estimated from simulation normalized as discussed in section 3. The main feature of these processes is that, as the two W bosons do not originate in a decay of the Higgs boson, their invariant mass does not peak at the Higgs boson mass. For this reason, events in the corresponding CR are required to have a large dilepton invariant mass, achieved by inverting the SR m``< 76 GeV requirement.
The estimation of the top quark background is performed in two steps. First, a top quark enriched CR is defined to measure a scale factor quantifying the difference in the b tagging efficiencies and mistag rates in data and simulation. This CR is obtained from the SR selection by inverting the b tagged jet veto. In second step, the scale factor is
JHEP03(2020)025
applied to the corresponding simulated samples with a weight per event that depends on the number, flavor, and kinematic distributions of jets.
The W + jets production contributes as a background in the h → WW analysis when a jet is misidentified as a lepton. A CR is defined to contain events with one isolated lepton and another lepton candidate that fails the nominal isolation criteria, but passes a looser selection. The probability for a jet satisfying this looser selection to pass the nominal one is estimated from data in an independent sample dominated by nonprompt leptons from multijet production. This probability is parameterized as a function of the pT and η of the lepton and applied to the events in the CR. In order to estimate the nonprompt lepton contamination in the SR, a validation region enriched in nonprompt leptons is defined with the same requirement as the SR, but requiring same-sign eµ pairs. The maximum discrepancy between data and prediction in the validation region, amounting to ≈30%, is taken as the uncertainty in the W + jets background prediction.
The Z/γ∗ → τ+τ− background is estimated from simulation, after reweighting the Z boson pT spectrum to match the distribution measured in data. The normalization of the simulated sample is estimated from data using events in the mhT < 40 GeV region. A normalization factor is then extracted from this region and applied to the SR.
The main difference between the present analysis and the measurement of the SM Higgs boson properties in the same channel [85] is in the signal extraction method. The latter analysis uses a multidimensional fit to the mhT, m``, and p`2
T distributions, whereas a fit to the BDT discriminant distribution is used in the present analysis.
5.5 The h(→ ZZ) + pmissT channel
The search in the h → ZZ channel is performed in all-leptonic final states. Each of the Z bosons decays to a pair of leptons (electrons or muons, including those coming from leptonic
τ decays) resulting in a four-lepton signature. The main advantages of the h → ZZ → 4`
over other Higgs boson decay modes are that the Higgs boson candidates can be fully reconstructed, with an excellent mass resolution, and the backgrounds are easily controlled. On the other hand, this channel suffers from a relatively small branching fraction compared to most of other Higgs boson decay channels. The three different final states (four electrons, four muons, and two electrons and two muons) are analyzed individually and then combined to obtain final results. The selection of the h → ZZ → 4` events follows closely that used in the measurement of the Higgs boson properties in the four-lepton channel, based on the same data set [42].
The signal event topology is defined by the presence of four charged leptons (4e, 4µ, or 2e2µ) and significant pmissT produced by the undetected DM particles. The events are selected online with triggers requiring the presence of two isolated leptons (ee, µµ, or eµ), with asymmetric pT thresholds of 23 (17) GeV on the leading and 12 (8) GeV on the subleading electron (muon). Dilepton triggers account for most of the signal efficiency in all three final states. In order to maximize the signal acceptance, trilepton triggers with lower pT thresholds and no isolation requirements are added, as well as single-electron and single-muon triggers with isolated lepton pT thresholds of 27 and 22 GeV, respectively [42].
JHEP03(2020)025
The reconstruction and selection of the Higgs boson candidates proceeds first by select-ing two Z boson candidates, defined as pairs of opposite-sign, same-flavor leptons (e+e−,
µ+µ−) passing the selection criteria and satisfying 12 < m``(γ) < 120 GeV, where the Z
boson candidate mass m``(γ)includes the contribution of photons identified as coming from final-state radiation [42]. The ZZ candidates are then defined as pairs of Z boson candi-dates not sharing any of the leptons. The Z candidate with the reconstructed mass closest to the nominal Z boson mass [86] is denoted as Z1, and the other one is denoted as Z2. All the leptons used to select the Z1and Z2candidates must be separated by ∆R(`i, `j) > 0.02. The leading (subleading) of the four leptons must have pT > 20 (10) GeV, and the Z1 candidate must have a reconstructed mass mZ1 above 40 GeV. In the 4e and 4µ channels, if an alternative ZiZj candidate based on the same four leptons is found, the event is discarded if mZ
i is closer to the nominal Z boson mass than mZ1. This requirement rejects events with an on-shell Z boson produced in association with a low-mass dilepton resonance. In order to suppress the contribution of QCD production of low-mass dilepton resonances, all four opposite-sign pairs that can be built with the four leptons (regardless of the lepton flavor) must satisfy m`i`j > 4 GeV and the four-lepton invariant mass must satisfy m4` > 70 GeV. If more than one ZZ candidate passes the selection, the one with the highest value of the scalar pT sum of four leptons is chosen. The above requirements define the event preselection.
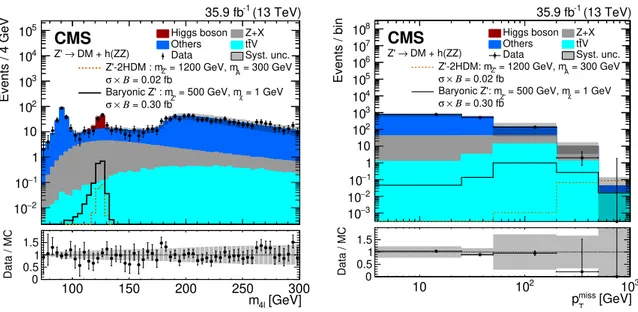
The m4` distribution for selected ZZ candidates exhibits a peak around 125 GeV, as expected for both the SM Higgs boson production and signal. However, because of the much lower cross section, the potential signal is overwhelmed by the background after the SM Higgs boson selection, as shown in figure 4(left). The distribution of pmissT for selected ZZ candidates is shown in figure 4(right).
After the preselection, the remaining background comes from the SM Higgs boson (mostly Vh), tt +V, and VV/VVV production. Another background dominated by the Z+jets production (“Z+X”) [42] arises from secondary leptons misidentified as prompt because of the decay of heavy-flavor hadrons and light mesons within jets, and, in the case of electrons, from photon conversions or charged hadrons overlapping with photons from
π0 → γγ decays. The nonprompt-lepton background also contains smaller contributions
from tt +jets, Zγ+jets, WZ+jets, and WW+jets events, with a jet misidentified as a prompt lepton. These backgrounds do not exhibit peak in the distribution of m4`, and are reduced by applying a selection on the m4` around the Higgs boson mass (115 < m4` < 135 GeV), by rejecting events with more than four leptons, and by requiring the number of b tagged jets in the event to be less than two.
5.5.1 Background estimation
The dominant irreducible backgrounds from the SM Higgs boson and nonresonant ZZ pro-duction are determined from simulation, while the Z+X background is determined from data [42]. All other backgrounds are determined from simulation. Background contribu-tions from the SM Higgs boson production in association with a Z boson or a tt pair, followed by the h → WW → 2`2ν decay, have been studied with simulated events and found to be negligible.
JHEP03(2020)025
100
150
200
250
300
2 − 10 1 − 10 1 10 2 10 3 10 4 10 5 10 Events / 4 GeV Higgs boson Z+X Others ttVData Syst. unc.
= 300 GeV A = 1200 GeV, m Z' Z'-2HDM : m = 0.02 fb Β × σ = 1 GeV χ = 500 GeV, m Z' Baryonic Z' : m = 0.30 fb Β × σ CMS DM + h(ZZ) → Z' (13 TeV) -1 35.9 fb 100 150 200 250 300 [GeV] 4l m 0 0.5 1 1.5 Data / MC 3 − 10 2 − 10 1 − 10 1 10 2 10 3 10 4 10 5 10 6 10 7 10 8 10 Events / bin Higgs boson Z+X Others ttV
Data Syst. unc.
= 300 GeV A = 1200 GeV, m Z' Z'-2HDM: m = 0.02 fb Β × σ = 1 GeV χ = 500 GeV, m Z' Baryonic Z': m = 0.30 fb Β × σ CMS DM + h(ZZ) → Z' (13 TeV) -1 35.9 fb 10 102 103 [GeV] miss T p 0 0.5 1 1.5 Data / MC
Figure 4. The four-lepton invariant mass (left) and pmissT distributions (right) after the preselection,
expected from MC simulation (stacked histograms) and observed in data (points with vertical bars). The systematic uncertainties, discussed in section7.1, are shown by the hatched region. Two signal benchmarks, corresponding to the Z0-2HDM (dotted orange line) and baryonic Z0 (solid black line) model are superimposed. The signal is normalized to the product of cross section and B, where B represents the h → ZZ branching fraction. The lower panel shows the ratio of the data to the predicted SM background.
The Z+X background is estimated from data by first determining the lepton misiden-tification probability in a dedicated CR and then using it to derive the background contri-bution in the SR. The lepton misidentification probability is defined as the probability that a lepton passing a loose selection with relaxed identification or isolation criteria also passes the tight selection criteria. The misidentification probability is measured in a Z+lepton CR where the Z boson candidate (with the mass within 7 GeV of the nominal Z boson mass) is formed from the two selected leptons passing the tight identification criteria, and an additional lepton is required to pass the loose selection. This sample is dominated by Z+nonprompt-lepton events. The electron and muon misidentification probabilities are measured as functions of the lepton candidate pT, its location in the barrel or endcap region of the ECAL or the muon system, and pmissT in the event, using Z(→ ``)+e and Z(→ ``)+µ events, respectively, in the Z+lepton CR. The misidentification probabilities are found to be independent of the charge of the lepton within the uncertainties.
The strategy for applying the lepton misidentification probabilities relies on two ad-ditional CRs. The first CR is defined by requiring that the two leptons that do not form the Z1 candidate, pass only the loose, but not the tight identification criteria. This CR defines the “2 pass + 2 fail” (2P2F) sample and is expected to be populated by events that intrinsically have only two prompt leptons (mostly from DY production, with a small contribution from tt and Zγ events). The second CR is defined by requiring only one of the four leptons to fail the tight identification and isolation criteria and defines the “3 pass + 1 fail” (3P1F) sample, which is expected to be populated by the type of events
JHEP03(2020)025
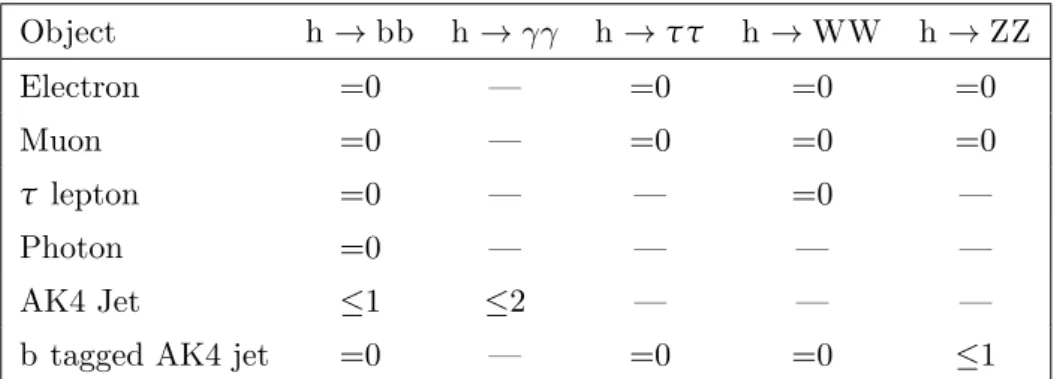
Object h→ bb h → γγ h → ττ h → WW h → ZZ Electron =0 — =0 =0 =0 Muon =0 — =0 =0 =0 τ lepton =0 — — =0 — Photon =0 — — — — AK4 Jet ≤1 ≤2 — — —b tagged AK4 jet =0 — =0 =0 ≤1
Table 2. Summary of the maximum number of additional objects allowed in an event for each anal-ysis. A dash means that no restriction on the corresponding object is applied in the corresponding analysis.
that populate the 2P2F CR, but with different relative proportions, as well as by WZ+jets events with three prompt leptons.
6 Statistical combination of the search channels
The analyses in the five channels described above are almost completely statistically inde-pendent of each other, allowing these analyses to be combined without accounting for the possibility of events being selected in more than one final state. Whenever an explicit veto ensuring the strict mutual exclusivity of the channels is not placed in a particular analysis, it was checked that there are no overlapping events with the other channels. The summary of the vetoes on additional objects, namely electrons, muons, τ leptons, photons, jets, and b tagged jets, in each analysis is presented in table 2. These selections not only reduce the major backgrounds, but also ensure the nearly complete mutual exclusivity of the analyses considered for the combination. The overlap in the SR is zero and for the CR it is less than 0.01%, i.e., it is much smaller than the systematic uncertainty in the analysis.
The combination of the analyses in the five Higgs boson decay channels is performed for both the Z0-2HDM and the baryonic Z0 model. For each model, the h → bb channel dominates the sensitivity in most of the phase space, and hence the combined results are dominated by this channel. However, there are regions of the parameter space that are hard to probe with h → bb decays, and other channels play a major role there. The analysis strategies for all channels are the same for both models, except for the h → bb channel, where two different strategies are used because of the difference in the Lorentz boost of the Higgs boson. In this channel, the results for the Z0-2HDM are taken from ref. [30], whereas for the baryonic Z0 model, the results from ref. [31] are used in the combination.
For the Z0-2HDM, the two parameters that we scan are mZ0 and mA. All five analyses contribute to the combination in the ranges 800 < mZ0 < 2500 GeV and 300 < mA < 800 GeV. For m
Z0 < 800 GeV, it is not possible to perform the h→ bb analysis efficiently, therefore only four other decay channels are used for the combination. For mZ0 > 2500 GeV and mA > 800 GeV the signal selection efficiency is significant only for the h → bb decay mode, hence only the h → bb channel contributes in this region.
JHEP03(2020)025
For the baryonic Z0 model, the two parameters that we scan are m
Z0 and mχ, and all five analyses are performed in the full phase space considered for the combination. Since the maximum sensitivity for all the analyses is achieved for mχ = 1 GeV, the compari-son of individual analyses is shown only for this DM particle mass, to demonstrate the improvement in the sensitivity achieved in the combination of individual channels.
7 Systematic uncertainties
A number of systematic uncertainties are considered in the combination, broadly divided into two categories: theoretical and experimental. Theoretical uncertainties are considered fully correlated among all five channels. Only the systematic uncertainties attributed to the experimental sources that are correlated between different channels are described for the combined result in section7.3. The details of all experimental systematic uncertainties in the h → bb analysis using AK8 jets are described in ref. [30] and those for the analysis using CA15 jets are described in ref. [31]; for the h → γγ and h → ττ channels they are given in ref. [32]; and for the h → WW and h → ZZ analyses they are discussed in this section.
7.1 The h(→ WW) + pmissT channel
The normalization and the kinematic shapes of the BDT discriminant distributions for the main backgrounds are derived from data CRs, and therefore systematic uncertainties in both the normalization and shapes are considered.
For the nonprompt-lepton background the uncertainty amounts to approximately 30%, and covers the uncertainty in the lepton misidentification rate, the dependence on the CR background composition, and the statistical component because of the finite event count in the CR.
The top quark background CR is included as an additional category in the signal ex-traction fit. The kinematic shapes of the top quark background are taken from simulation corrected for the b tagging scale factors, with the uncertainties covering the difference be-tween the b tagging efficiency in data and simulation [82]. A similar procedure is applied for the DY background, by defining a CR in low-mT phase space, and to the nonresonant WW background, for which a high-m`` CR is defined. The top quark and DY background normalizations are correlated between their respective CRs and the SR and are left uncon-strained in the fit. The change in the PDF, the renormalization and the factorization scale variations from their nominal values lead to migration of the top quark and Z/γ∗ → τ+τ− background events between the respective CRs and the SR. To take into account this effect, the change in the top quark (Z/γ∗ → τ+τ−) background yield is used as an additional 1 (2)% uncertainty in the corresponding CR. The shapes of the WZ and other minor back-grounds are taken from simulation and normalized to their theoretical predictions, with the theoretical uncertainties estimated. The uncertainties related to the modeling of pmissT are estimated by considering the effect of varying the lepton energy scale on pmissT .
Experimental uncertainties are estimated by applying scale factors between data and simulation, and/or by smearing of certain kinematic variables in simulation, with the
cor-JHEP03(2020)025
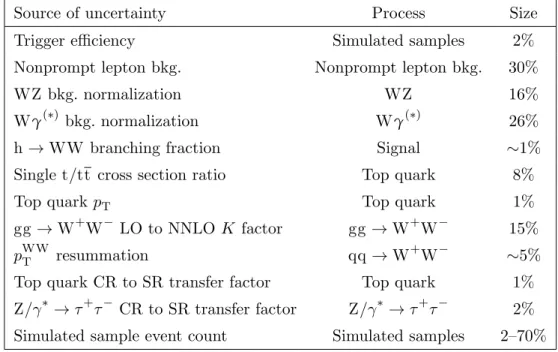
Source of uncertainty Process Size
Trigger efficiency Simulated samples 2%
Nonprompt lepton bkg. Nonprompt lepton bkg. 30%
WZ bkg. normalization WZ 16%
Wγ(∗) bkg. normalization Wγ(∗) 26%
h → WW branching fraction Signal ∼1%
Single t/tt cross section ratio Top quark 8%
Top quark pT Top quark 1%
gg → W+W− LO to NNLO K factor gg → W+W− 15%
pWWT resummation qq → W+W− ∼5%
Top quark CR to SR transfer factor Top quark 1%
Z/γ∗→ τ+τ− CR to SR transfer factor Z/γ∗ → τ+τ− 2% Simulated sample event count Simulated samples 2–70%
Table 3. Systematic uncertainties affecting the h→ WW analysis.
responding changes further propagated to all analysis variables. The signal acceptance uncertainty associated with the combination of single-lepton and dilepton triggers is mea-sured to be 2%. The uncertainty in the ratio between the single top quark and top quark pair production cross sections, 8% at 13 TeV [87], has been also included, as it affects the top quark background yield from the maximum-likelihood fit used to extract the signal and dominant backgrounds. The uncertainty in the pT spectrum of the top quark has been applied to all the observables in order to cover the difference between the simulated and observed spectra [88], and is of the order of 1%.
The uncertainty in the Higgs boson branching fraction for the h → WW decay is about 1% [67]. The uncertainty in the NNLO K factor applied to the LO gg → WW cross section estimate is 15% [89]. The pWWT spectrum in the qq → WW sample has been reweighted to match the resummed calculation [56,57]. The associated shape uncertainties related to the missing higher-order corrections are modeled by varying the factorization, renormalization, and resummation scales up and down independently by a factor of 2 from their nominal values [56]. Finally, uncertainties arising from the limited size of the simulated samples are included for each bin of the BDT discriminant distributions, in each category. The main sources of the uncertainties affecting the analysis are listed in table 3.
7.2 The h(→ ZZ) + pmissT channel
A source of systematic uncertainty in the nonprompt-lepton background estimate poten-tially arises from the difference in the composition of the SM background processes with nonprompt leptons (Zγ+jets, tt, Zγ+jets) contributing to the CRs where the lepton misidentification rate is measured and applied. This uncertainty can be estimated by measuring the misidentification rates in simulation for the 2P2F and 3P1F CRs. Half of
JHEP03(2020)025
the difference between the misidentification rates obtained from simulation in these two CRs is used as a measure of the systematic uncertainty in the lepton misidentification rate and is further propagated to the uncertainty in the nonprompt-lepton background, and amounts to 43% for the 4e, 36% for the 4µ, and 40% for the 2e2µ final states.
The uncertainty in the full signal selection efficiency is at the level of 1%. The un-certainty in the m4` resolution from the uncertainty in the per-lepton energy resolution is about 20% [42] and affects the signal and all the backgrounds from Higgs boson production. In addition, there are two types of systematic uncertainties related to the modeling of pmissT . The first uncertainty is related to the approximately Gaussian core of the reso-lution function for correctly measured jets and other physics objects and corresponds to the uncertainty in the genuine pmissT . The second uncertainty, attributed to significant mismeasurement of pmissT , is an uncertainty in the “mismeasured” pmissT .
The uncertainties from the modeling of genuine pmissT are measured by varying the parameters associated with the corrections applied to pmissT and by propagating those vari-ations to the pmissT calculation, after applying the full analysis selection. Each correction is varied up and down by one standard deviation of the input distribution. The corrections used in this calculation come from JES, JER, muon, electron, photon, and the unclustered energy scales.
The uncertainty in the mismeasured pmissT is obtained from a sample with significant contributions from misidentified leptons and mismeasured jets, obtained by requiring an opposite-sign, same-flavor dilepton pair passing the Z1 candidate selection, and an addi-tional same-sign, same-flavor pair (“OS+SS” sample). This sample is enriched in misiden-tified leptons that form the same-sign pair and is expected to lead to significant mismea-surement of pmissT , not already covered by the uncertainties in the Gaussian core discussed above. We derive the mismeasured pmissT uncertainty from the comparison of the pmissT shapes in the “OS+SS” sample and in the SR, with a requirement that the m4`be outside the Higgs boson invariant mass peak (|m4`− 125 GeV| > 10 GeV). The uncertainty in mismeasured pmissT is applied to the Z+X sample only, since the effect is expected to be negligible when four genuine leptons are produced, as is the case for the signal and for most of the simulated background samples.
An uncertainty of 10% in the K factor used for the gg → ZZ prediction is applied [89]. A systematic uncertainty of 2% in the h → ZZ → 4` branching fraction [67] affects both signal and the SM Higgs boson background yields. Theoretical uncertainties in the tt +V background cross sections are taken from ref. [90]. A summary of the experimental uncer-tainties is given in table 4.
7.3 Systematic uncertainties in the combination
The uncertainties associated with the background normalization and fit parameters are assumed to be uncorrelated, whereas those associated with the standard object selection are considered fully correlated and are summarized in table 5. In all five decay channels, a normalization uncertainty of 2.5% for simulated samples is used to account for the uncer-tainty in the measurement of the integrated luminosity [91]. Also fully correlated across all channels are the systematic uncertainties related to theoretical calculations of the Higgs
JHEP03(2020)025
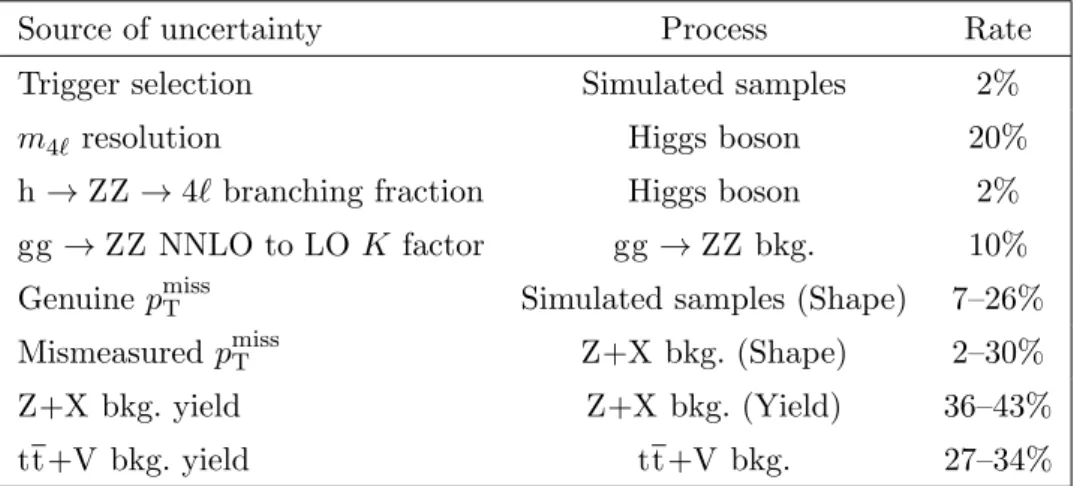
Source of uncertainty Process Rate
Trigger selection Simulated samples 2%
m4`resolution Higgs boson 20%
h → ZZ → 4` branching fraction Higgs boson 2%
gg → ZZ NNLO to LO K factor gg→ ZZ bkg. 10%
Genuine pmissT Simulated samples (Shape) 7–26%
Mismeasured pmissT Z+X bkg. (Shape) 2–30%
Z+X bkg. yield Z+X bkg. (Yield) 36–43%
tt +V bkg. yield tt +V bkg. 27–34%
Table 4. Systematic uncertainties affecting the h→ ZZ analysis.
Source h→ bb h→ γγ h→ ττ h→ WW h→ ZZ
Z0-2HDM Baryonic Z0
AK4 jet b tagging Uncorr. (3–4%) — 4% Shape (1%) 1%
AK4 jet b mistag )
3–11%
Shape (5–7%) — 2–5% Shape (1%) —
e ident. efficiency 4% 2% — 2% Shape (2%) 2.5–9.0%
µ ident. efficiency 4% 2% — 2% Shape (2%) 2.5–9.0%
τhident. efficiency 3% 3% — 4.5% Shape (1%) —
e energy scale 1% — — — Shape (1%) 3%
µ energy scale 1% — — — Shape (1%) 0.4%
JES — Uncorr. (4%) — Shape (<10%) Shape (3%) 2–3%
Int. luminosity 2.5% 2.5% 2.5% 2.5% 2.5% 2.5%
Signal (PDF, scales) 0.3–9.0% 0.3–9.0% 0.3–9.0% 0.3–9.0% 0.3–9.0% 0.3–9.0% Table 5. Systematic uncertainties in the combination of channels, along with the type (rate/shape) of uncertainty affecting signal and background processes, correlated amongst at least two final states. For the rate uncertainties, the percentage of the prior value is quoted, while for shape uncertainties an estimate of the impact of systematic uncertainties on the yield is also listed. A dash (“—”) implies that a given uncertainty does not affect the analysis. Whenever an uncertainty is present but kept uncorrelated in a particular channel, this is mentioned explicitly. The effect of the b jet mistag rate uncertainty is very small in the h → bb Z0-2HDM analysis and hence it is added to the effect of the b tagging efficiency uncertainty in quadrature.
boson production cross section, PDFs, and renormalization and factorization scale uncer-tainties estimated using the recommendations of the PDF4LHC [92] and LHC Higgs Cross Section [67] working groups, respectively. These uncertainties range from 0.3 to 9.0%.
Uncertainties from imprecise knowledge of the JES are evaluated by propagating the uncertainties in the JES for individual jets in an event, which depend on the jet pT and η, to all the analysis quantities. The uncertainties in the selection of b tagged AK4 jets are taken into account using the uncertainties in the b tagging efficiency and misidentification rate estimated from the difference between data and simulation [82]. The uncertainty due to the difference in the performance of electron, muon, and τ lepton identification between
JHEP03(2020)025
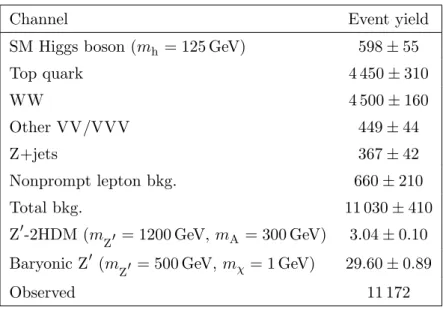
Channel Event yield
SM Higgs boson (mh = 125 GeV) 598± 55
Top quark 4 450± 310 WW 4 500± 160 Other VV/VVV 449± 44 Z+jets 367± 42 Nonprompt lepton bkg. 660± 210 Total bkg. 11 030± 410 Z0-2HDM (mZ0 = 1200 GeV, mA = 300 GeV) 3.04± 0.10 Baryonic Z0 (m Z0 = 500 GeV, mχ= 1 GeV) 29.60± 0.89 Observed 11 172
Table 6. The post-fit signal and background event yields, and the observed number of events in data, for the h → WW analysis. The expected numbers of signal events for the two signal hypotheses are also reported, one for each benchmark model. The total uncertainty, including both statistical and systematic components, is quoted for the expected signal and backgrounds yields.
data and simulation is taken into account for individual decay channels and considered fully correlated in the statistical combination. An uncertainty of 1–3% in the electron energy scale and an uncertainty of 0.4–1.0% in the muon energy scale are considered to be correlated in the combination.
8 Results
The event selection described in section 5 has been used to discriminate the mono-Higgs signal from backgrounds in each channel. The observed yields in data and the expected event yields for the signal and background processes in the h → bb, h → γγ, and h → ττ channels can be found in refs. [30–32]. The corresponding yields for the h → WW and h → ZZ analyses are discussed in section 8.1. Table 6, 7 and figures5, 6 show one signal mass hypothesis for each model, normalized to the respective cross section. For the Z0 -2HDM, the signal is normalized to the cross section calculated for mass values of Z0 and A bosons of 1200 and 300 GeV, respectively, and for g
Z0 = 0.8, tan β = 1. For the baryonic Z 0 model, the signal is normalized to the cross section corresponding to the Z0 and mχmasses of 500 and 1000 GeV, respectively, and for gχ = 1, gq = 0.25.
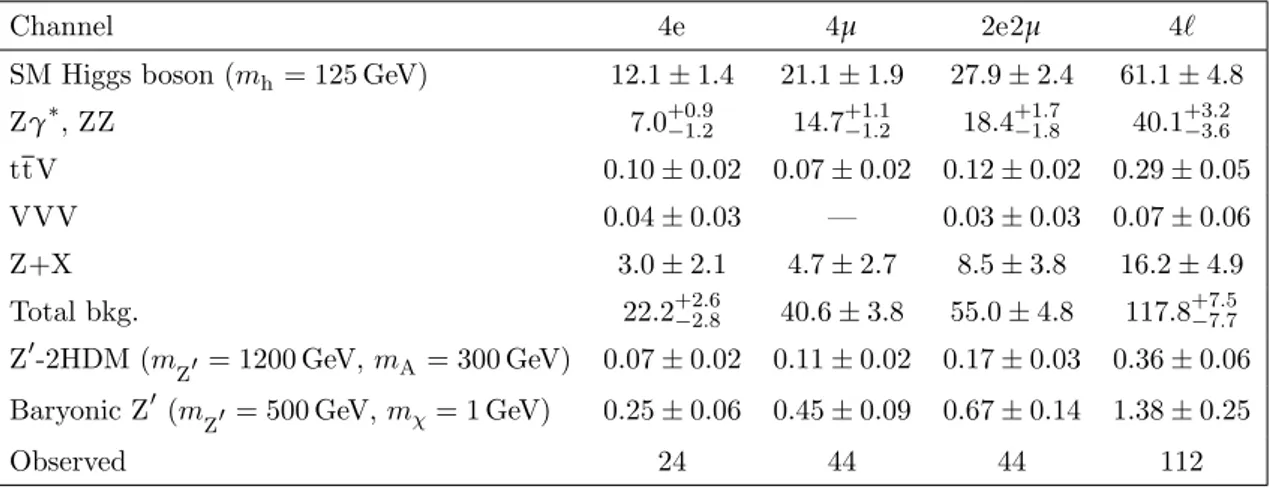
8.1 The h(→ WW) + pmissT and h(→ ZZ) + pmissT channels
The expected background yields and the observed number of event in data, along with the expected yields for two signal benchmarks in the h → WW and h → ZZ channels, are summarized in tables 6and 7, respectively.
Figure 5 shows the BDT discriminant distribution for the expected backgrounds and observed events in data for the h → WW analysis. Benchmark signal contributions in