STRONG INCREASES IN EMPLOYMENT AND LABOR FORCE CONTINUE
Seyfettin Gürsel* Gökçe Uysal∗∗ ve Ayşenur Acar∗∗∗Abstract
Seasonally adjusted labor market data shows that the unemployment rate is still stagnant. Non-agricultural unemployment rate remained at 11.8 percent in the period of January 2013. Increases in manufacturing
employment that has been observed for the last two periods prevented an increase in the unemployment rate. It seems that the increase in services has stopped. The increase in manufacturing production index pertaining to February 2013 and the application per vacancy of Kariyer.net indicate that the non-agricultural unemployment rate might slightly decrease in the period of February 2013.
LABOR MARKET HIGHLIGHT
The Highest Female Labor Force Participation Rate is in the Zonguldak Region, The Lowest One is in the Şanlıurfa Region
Low female labor force participation rates (LFPR) in Turkey vary across regions. Even among women with similar education levels, regional differences in LFPR are large. For example, labor force participation rate of females with high school degrees is 33.5 percent in Turkey in 2012. The same rate is 45.5 percent in Zonguldak-Karabük-Bartın and is 7.3 percent in Şanlıurfa-Diyarbakır. Similarly, while labor force participation rate of females with university degrees is 80 percent in Zonguldak-Karabük-Bartın, and 50 percent Şanlıurfa-Diyarbakır. Given that the education level is held fixed, differences in female LFPR across regions may stem from economic and institutional factors like the regional unemployment rates, the share of service sector in total employment, the prevalence of pre-school education and cultural factors like social gender roles that may deepen along the West-East axis.
Strong increases in both non-agricultural employment and non-agricultural labor force
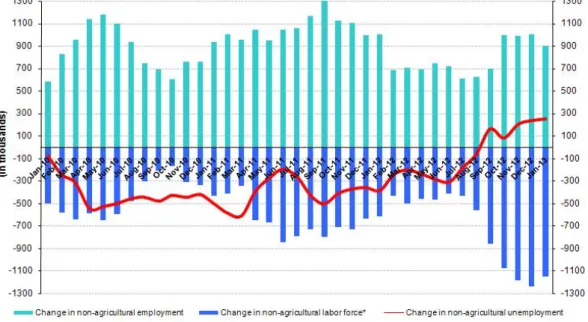
Figure 1 Year-on-year changes in non-agricultural labor force, employment and unemployment
Source: TurkSTAT, Betam
* Prof. Dr. Seyfettin Gürsel, Betam, Director, seyfettin.gursel@bahcesehir.edu.tr
∗∗ Yrd. Doç. Dr. Gökçe Uysal, Betam, Vice Director, gokce.uysal@bahcesehir.edu.tr ∗∗∗ Ayşenur Acar, Betam, Research Assistant, aysenur.acar@bahcesehir.edu.tr
Labor Market Outlook:
April 2013
According to the data released by TurkSTAT, non-agricultural labor force increased by 1 million 152 thousand (5.6 percent), the non-agricultural employment increased by 900 thousand (5 percent) and non-agricultural
unemployment increased by 252 thousand to 2 million 808 thousand persons in the period of January 2013 on a year-on-year basis (Figure 1).
Seasonally adjusted non-agricultural unemployment has been stagnating
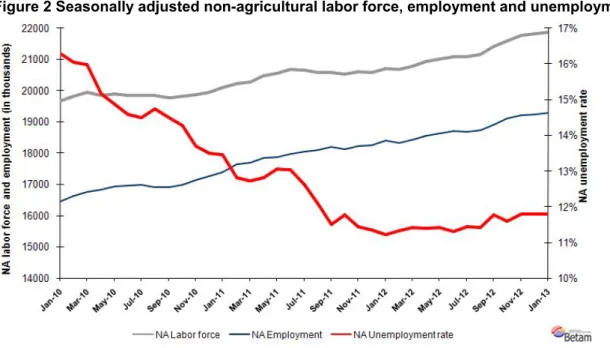
According to seasonally adjusted data, the non-agricultural labor force increased by 42 thousand to reach 21 million 866 thousand in the period of January 2013 compared to the period of December 2012 (Figure 2, Table 1). Non-agricultural employment increased by 38 thousand and reached 19 million 256 thousand. Consequently, the number of persons unemployed in non-agricultural sectors increased by 4 thousand and non-agricultural
unemployment rate remained at 11.8 percent.
Figure 2 Seasonally adjusted non-agricultural labor force, employment and unemployment
Source: TurkStat, Betam
According to Kariyer.net data, non-agricultural unemployment might slightly decrease in the period of February 2013
Application per vacancy calculated by using series released by Kariyer.net1 indicates that non-agricultural
unemployment rate might decrease in the period of February 2013. This prediction is line with the increases in the manufacturing production index in January and February 2013.
1 Betam has been calculating application per vacancy using series released by Kariyer.net for a while. Seasonal and calendar adjustment
procedure is applied to application per vacancy series. A decrease in applications per vacancy may be caused by an increase in vacancies or by a decrease in the number of applications. An increase in vacancies signals economic growth while decreasing number of applications indicates a decrease in number of people looking for a job.
Figure 1 Seasonally adjusted non-agricultural unemployment rate and application per vacancy
Source: Kariyer.net, TurkStat, Betam
Manufacturing employment has been continuing to increase
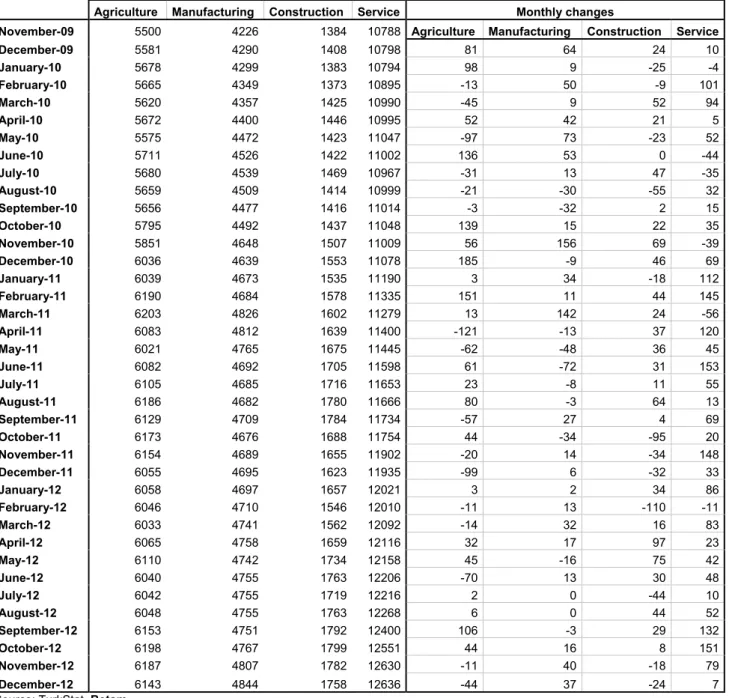
Seasonally adjusted data shows that employment in manufacturing increased by 24 thousand and reached 4 million 872 thousand, which is the reflection of the increases in manufacturing production index in January and February 2013. Manufacturing employment has increased by 119 thousand in the last quarter of 2012.
In January 2013, construction employment increased by 5 thousand, service employment increased 9 thousand (Table 2, Figure 4)2. We have been observing a rapid increase in service employment since the last quarter of 2010. It seems to be slowing down for the last two periods. We do not observe an increase in service employment in the periods of December 2012 and January 2013.
Agricultural employment decreased by 15 thousand. However, the general trend indicates that agricultural employment has been stagnating since the beginning of 2011.
2 Employment in each sector is seasonally adjusted separately. Hence the sum of these series may differ from the seasonally adjusted series of
Figure 2 Employment by sectors (in thousands)3
Source: TurkStat, Betam
LABOR MARKET HIGHLIGHT
The Highest Female Labor Force Participation Rate is in the Zonguldak Region, The Lowest One is in the Şanlıurfa Region
Female labor force participation has been a hot topic of economic debate in the past couple of years. The reason is simple. The female labor force participation rate (LFPR) is far below that of South European countries. Even in countries like Greece, Spain and Italy, more than half of women participate in the labor market. Even though the female LFPR increased in Turkey in the past couple of years, it stil hovers around 30 percent. Researchers have been trying hard to explain why females are not fully integrated in the labor market.
Now we know that the reasons behind the low female LFPR are multi-dimensional. There are both supply-side and demand-side constraints. To name a few, women are relatively more costly to hire, the regional labor market conditions are not always favorable, the wages in the labor market are low, there are very few family and work reconciliation policies, etc. There are also cultural factors such as traditional gender roles, etc. We choose to focus on the regional differences in female LFPR in this month’s labor market highlight. Needless to say, wages are a major determinant in the labor supply decision. Education, being an important determinant of wages, plays an important role. High school and university graduate women will enjoy higher wages in the labor market, and they will have higher LFPR. However, our brief look at women with similar education levels reveals that there are stark differences in labor supply decisions. We provide very basic statistics on regional differences in female LFPR:
Figure A Regional distribution of females with high school and university degrees, 2012
Source: TurkStat; Betam
Figure A presents the LFPR of high school and university graduate women for the 26 NUTS1 regions in Turkey. The first striking observation is that there are no major regional differences among women with a university degree. In 2011, the female LFPR among this group is 71 percent. The highest rate is in Zonguldak-Karabük-Bartın at 80 percent, and the lowest is in Şanlıurfa-Diyarbakır at 50 percent. The difference between the highest and the lowest is 30 percentage points. However, Şanlıurfa-Diyarbakır is a clear outlier. LFPRs of the rest fall within a narrow interval. On the other hand, there are enormous differences in LFPR of women with a high school degree. The average is 33.5 percent in Turkey. Zonguldak-Karabük-Bartın still leads with 45.5 percent and Şanlıurfa-Diyarbakır still has the lowest rate at a very disappointing 7.3 percent. The difference between the highest and the lowest is larger.
How can we explain the fact that the female LFPR of high school graduates differ widely across regions, whereas that of university graduates do not vary much. Clearly, the scope of this research brief is too limited to answer this
question. However, we can point to some hints. The local labor market conditions undoubtedly play an important role. For example, women may be more likely to participate in the labor market if the local unemployment rates are low; the share of the service sector is large, etc. There may also be institutional differences across regions. The regions where pre-school education is more wide-spread probably have higher female LFPR. However, given that the central
government has a strong grip in Turkey, we doubt that this is the case. Lastly, note that the female LFPR falls as we move from the western to the eastern regions. It may be that the cultural effects are more strongly felt by high school graduate women. On the other hand, university graduates do enjoy higher wages in the labor market, and moreover, they may have stronger labor market attachment due to higher levels of education. Let us also point out that families’ attitudes towards work may differ by education.
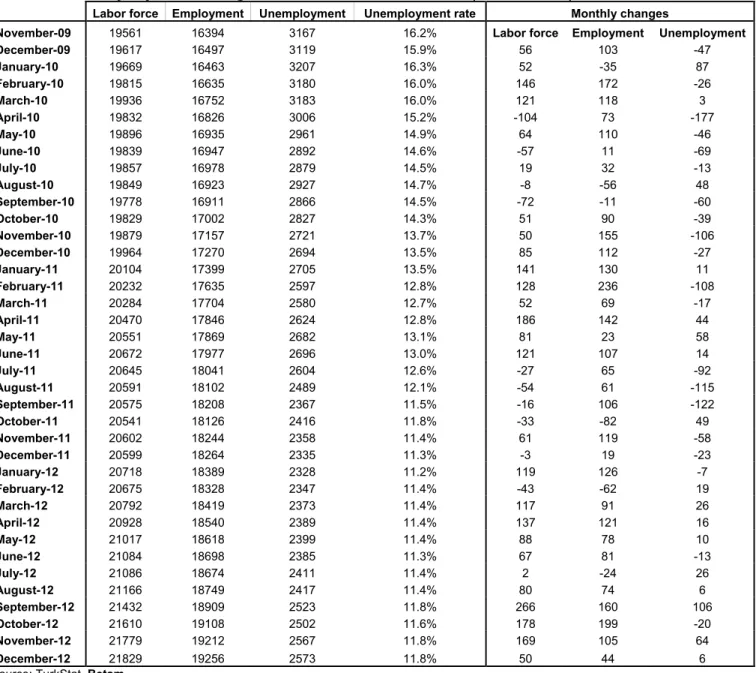
Table 1 Seasonally adjusted non-agricultural labor force indicators (in thousands)
Labor force Employment Unemployment Unemployment rate Monthly changes
November-09 19561 16394 3167 16.2% Labor force Employment Unemployment
December-09 19617 16497 3119 15.9% 56 103 -47 January-10 19669 16463 3207 16.3% 52 -35 87 February-10 19815 16635 3180 16.0% 146 172 -26 March-10 19936 16752 3183 16.0% 121 118 3 April-10 19832 16826 3006 15.2% -104 73 -177 May-10 19896 16935 2961 14.9% 64 110 -46 June-10 19839 16947 2892 14.6% -57 11 -69 July-10 19857 16978 2879 14.5% 19 32 -13 August-10 19849 16923 2927 14.7% -8 -56 48 September-10 19778 16911 2866 14.5% -72 -11 -60 October-10 19829 17002 2827 14.3% 51 90 -39 November-10 19879 17157 2721 13.7% 50 155 -106 December-10 19964 17270 2694 13.5% 85 112 -27 January-11 20104 17399 2705 13.5% 141 130 11 February-11 20232 17635 2597 12.8% 128 236 -108 March-11 20284 17704 2580 12.7% 52 69 -17 April-11 20470 17846 2624 12.8% 186 142 44 May-11 20551 17869 2682 13.1% 81 23 58 June-11 20672 17977 2696 13.0% 121 107 14 July-11 20645 18041 2604 12.6% -27 65 -92 August-11 20591 18102 2489 12.1% -54 61 -115 September-11 20575 18208 2367 11.5% -16 106 -122 October-11 20541 18126 2416 11.8% -33 -82 49 November-11 20602 18244 2358 11.4% 61 119 -58 December-11 20599 18264 2335 11.3% -3 19 -23 January-12 20718 18389 2328 11.2% 119 126 -7 February-12 20675 18328 2347 11.4% -43 -62 19 March-12 20792 18419 2373 11.4% 117 91 26 April-12 20928 18540 2389 11.4% 137 121 16 May-12 21017 18618 2399 11.4% 88 78 10 June-12 21084 18698 2385 11.3% 67 81 -13 July-12 21086 18674 2411 11.4% 2 -24 26 August-12 21166 18749 2417 11.4% 80 74 6 September-12 21432 18909 2523 11.8% 266 160 106 October-12 21610 19108 2502 11.6% 178 199 -20 November-12 21779 19212 2567 11.8% 169 105 64 December-12 21829 19256 2573 11.8% 50 44 6
Table 2 Seasonally adjusted employment by sector (in thousands)
Agriculture Manufacturing Construction Service Monthly changes
November-09 5500 4226 1384 10788 Agriculture Manufacturing Construction Service
December-09 5581 4290 1408 10798 81 64 24 10 January-10 5678 4299 1383 10794 98 9 -25 -4 February-10 5665 4349 1373 10895 -13 50 -9 101 March-10 5620 4357 1425 10990 -45 9 52 94 April-10 5672 4400 1446 10995 52 42 21 5 May-10 5575 4472 1423 11047 -97 73 -23 52 June-10 5711 4526 1422 11002 136 53 0 -44 July-10 5680 4539 1469 10967 -31 13 47 -35 August-10 5659 4509 1414 10999 -21 -30 -55 32 September-10 5656 4477 1416 11014 -3 -32 2 15 October-10 5795 4492 1437 11048 139 15 22 35 November-10 5851 4648 1507 11009 56 156 69 -39 December-10 6036 4639 1553 11078 185 -9 46 69 January-11 6039 4673 1535 11190 3 34 -18 112 February-11 6190 4684 1578 11335 151 11 44 145 March-11 6203 4826 1602 11279 13 142 24 -56 April-11 6083 4812 1639 11400 -121 -13 37 120 May-11 6021 4765 1675 11445 -62 -48 36 45 June-11 6082 4692 1705 11598 61 -72 31 153 July-11 6105 4685 1716 11653 23 -8 11 55 August-11 6186 4682 1780 11666 80 -3 64 13 September-11 6129 4709 1784 11734 -57 27 4 69 October-11 6173 4676 1688 11754 44 -34 -95 20 November-11 6154 4689 1655 11902 -20 14 -34 148 December-11 6055 4695 1623 11935 -99 6 -32 33 January-12 6058 4697 1657 12021 3 2 34 86 February-12 6046 4710 1546 12010 -11 13 -110 -11 March-12 6033 4741 1562 12092 -14 32 16 83 April-12 6065 4758 1659 12116 32 17 97 23 May-12 6110 4742 1734 12158 45 -16 75 42 June-12 6040 4755 1763 12206 -70 13 30 48 July-12 6042 4755 1719 12216 2 0 -44 10 August-12 6048 4755 1763 12268 6 0 44 52 September-12 6153 4751 1792 12400 106 -3 29 132 October-12 6198 4767 1799 12551 44 16 8 151 November-12 6187 4807 1782 12630 -11 40 -18 79 December-12 6143 4844 1758 12636 -44 37 -24 7