Contents lists available atScienceDirect
Food Packaging and Shelf Life
journal homepage:www.elsevier.com/locate/fpslFabrication and characterization of thymol-loaded nanofiber mats as a novel
antimould surface material for coating cheese surface
Nevruz Berna Tatlisu
a, Mustafa Tahsin Yilmaz
b,c,⁎, Muhammet Arici
c aIstanbul Gelisim University, Vocational School, Food Technology Division, 34310, Istanbul, TurkeybKing Abdulaziz University, Faculty of Engineering, Department of Industrial Engineering, Jeddah, 21589, Saudi Arabia
cYıldız Technical University, Chemical and Metallurgical Engineering Faculty, Food Engineering Department, 34210, Istanbul, Turkey
A R T I C L E I N F O Keywords:
Antimould surface-coating material Electrospinning
Nanofiber mats Thymol Kashar cheese
A B S T R A C T
This study covers fabrication and characterization of thymol-loaded nanofiber (TLNs) mats and evaluation of their potential to be used as novel antimould surface coating material for limitation of mould development of Aspergillus parasiticus on kashar cheese surface. Different ratios of polyvinyl alcohol (PVA)/whey protein (WP) were electrospun to yield cylindrical and fine (⁓370 nm in diameter) polymeric nanofiber mats. The fabricated nanofibers were characterized in terms of their zeta potential, electrical conductivity, molecular, thermal and morphological properties. These results revealed that there were intermolecular interactions between thymol and functional groups of PVA and WP. The most uniform nanofiber structure with smooth beadless appearance could be observed in thymol-free nanofibers (TFNs) fabricated from 60/40 ratio of PVA/WP. The nanofiber diameter and electrical conductivity values were significantly increased by increase in PVA and WP ratios, respectively. The nanofiber mats had dispersion (−7.60 mV of ζ potential) and good thermal stability (an en-dothermic peak at ⁓215 °C) properties. In vitro antimould activity tests results showed that TLNs mats could show a higher efficiency against mycelial growth of A. parasiticus than free thymol. In situ test results obtained at the 7thstorage day confirmed in vitro test results with respect to visual inspections on coated and uncoated cheese surface, revealing that the coating of kashar cubes with TLNs prevented the growth of A. parasiticus on the coated cheeses. The results of this study shows that TLNs mats can be used an antimould surface material to limit mould growth on coated cheeses during storage period.
1. Introduction
Moulds produce different mycotoxins after their development in food and dairy products. Presence of Aspergillus parasiticus and
Aspergillus flavus in these products is a great risk with respect to
for-mation of aflatoxins. Aflatoxins are known to be the most potent bio-logical carcinogen among the mycotoxins (Günşen & Büyükyörük, 2001). The harmful effects (teratogenic, hepatotoxic, cytotoxic, geno-toxic, mutagenic and carcinogenic effects) of these toxins on human health are well known (Gürses, Erdoğan, & Çetin, 2004;Shukla, Verma, & Mehta, 2002). Aflatoxins (AFB1, AFB2, AFG1, AFG2) and (AFM1 and AFM2; metabolites found in milk) give rise to serious problems in-cluding food poisoning and liver cancer, even death due to acute toxicity (Atasever, Nizamlıoğlu, Özturan, Karakaya, & Ünsal, 2006; Elzupir, Alamer, & Dutton, 2015;Galvano, Galofaro, & Galvano, 1996) on infants and children who are very sensitive to their negative effects. For this reason, many countries started to implement various research
and control programs to reduce the risk of exposure to aflatoxins (Oruç, 2003). This reveals the necessity to develop novel strategies for pre-vention or limitation of mould development in dairy products.
Dairy products can be contaminated with aflatoxins in two different ways. In the first way, AFB1 is converted to AFM1 in liver of animals which are fed with forage contaminated with AFB1 and secreted from the mammary glands to milk (Fink-Gremmels, 2008;Martins & Martins, 2004). AFM1 is very stable and not affected by heat treatment appli-cations such as pasteurization (Tekinşen & Uçar, 2008). In the second way, moulds can be grown in dairy products, especially in cheese during maturation and storage processes. In addition in different re-gions of Turkey, naturally ripened dairy products such as mould-ripened Tulum and skim-milk cheeses are also consumed. These tradi-tional products are not produced using starter culture; therefore, the aflatoxins-producing moulds can be grown (Evren, 1999). Many studies revealed the formation of aflatoxins produced by aflatoxin producing moulds (Barrios, Medina, & Cordoba, 1997;Jordano, Jodral, Martinez,
https://doi.org/10.1016/j.fpsl.2019.100347
Received 17 March 2019; Received in revised form 14 April 2019; Accepted 9 June 2019
⁎Corresponding author at: King Abdulaziz University, Faculty of Engineering, Department of Industrial Engineering, Jeddah, 21589, Saudi Arabia.
E-mail addresses:[email protected],[email protected](M.T. Yilmaz).
Available online 14 June 2019
2214-2894/ © 2019 Elsevier Ltd. All rights reserved.
Nobile, Corbo, & Sinigaglia, 2005; Sokovic, Tzakou, Pitarakoli, & Couladis, 2002). Thymol is the main component of essential fatty acids such as oregano, thyme and savory. Thymol, derived from these plant species, acts as a chemical defense mechanism against pathogenic mi-croorganisms (Vazquez, Fente, Franco, Vazquez, & Cepeda, 2011). The antimicrobial activity is based on interactions of thymol with cell membrane of pathogenic microorganisms, causing changes in mor-phological properties and cluster of mould hyphae. As a result, diameter of the mould hyphae is decreased (Soylu, Yigitbas, Soylu, & Kurt, 2007). It was also reported that chemical modifications of this phenolic com-ponent lead to positive changes in biological activity (Mathela, Singh, & Gupta, 2010).
Thymol extracted from Thymus vulgaris has a sharp aromatic odor and strong taste, which gives rise to negative effects on food flavor and structure. This situation limits its usage in food formulations. Therefore, there have been some efforts to reduce the negative impact on food flavor and texture. Hence, some techniques like encapsulation have been recently proposed (Chen & Subirade, 2005; Sanguansri & Augustin, 2006) to increase the effectiveness of bioactive substances. In encapsulation of antimicrobial compounds, electrospun nanofiber mats can be employed to limit microbial contamination. Use of nanofibers for coating food surface can be an effective way to prevent mould growth (de Faria, Perreault, Shaulsky, Chavez, & Elimelech, 2015; Yilmaz et al., 2016). Therefore, mould colonization on cheese surface can be limited by development of electrospun nanofiber mats as a novel coating material.
So far, different biopolymers have been used to encapsulate anti-mould bioactive materials in nanofiber mats. Examples are encapsula-tion of curcumin in zein (Yilmaz et al., 2016), thymol in chitosan (Ceylan, Unal-Sengor, & Yilmaz, 2017) and thymol in poly(lactic) acid (Alvarado et al., 2018). Biopolymers should be biodegradable under normal environmental conditions, without leaving any toxic residues. The biodegradable polymers used as coating or packaging material should also be abundant and cost-effective. For example, whey protein, as an edible biodegradable polymer can serve these purposes (Cazón, Velazquez, Ramírez, & Vázquez, 2017) and can be utilized as polymeric matrix for packaging film forming (Azevedo et al., 2017; Zink, Wyrobnik, Prinz, & Schmid, 2016). One of the other biodegradable polymers is Poly (vinyl alcohol) which was formerly employed because it is water soluble, biodegradable, and film-forming properties. This polymeric material has also certain hydrolysis and polymerization characteristics (Lara et al., 2019). Regarding fabrication of nanofibers from PVA/WP polymer mixture systems, this system differs from the other biopolymer systems because, for preparation of spinning dope solutions, only water is required to dissolve the PVA/WP mixture, not requiring other chemical solvents like dichloromethane, trifluoroacetic acid, propanol, acetone, 1,4-dioxane, tetrahydrofuran, chloroform, di-methylformamide and dimethylacetamide for solving other polymer systems like poly(lactic) acid (Jahangir et al., 2017) and chitosan (Ceylan et al., 2017). Therefore, in this study, thymol-loaded nanofiber (TLNs) mats were fabricated using polyvinyl alcohol/whey protein polymers for encapsulation of thymol into this polymer mix. Kashar
150.22, Merck, Darmstadt, Germany), Tween 80 (Merck, Germany) and kashar cheese (Yörsan A.Ş., Balikesir, Turkey) were used in this study.
Aspergillus parasiticus NR LL‒2999 was brought from Namık Kemal
University in glass tubes where they kept in slants at 4 °C on potato dextrose agar (PDA, pH 5.6, Merck, Darmstadt, Germany). PVA (poly-vinyl alcohol, Mw = 130,000 Da, Aldrich Chemical, Milwaukee, WI), PDA (Potato Dextrose Agar, Merck, Darmstadt, Germany), Ringer Solution (Merck, Darmstadt, Germany) were used in the analysis.
2.2. Fabrication of electrospun nanofiber mats 2.2.1. Preparation of spinning dope solutions
To prepare spinning-dope solutions, a single solvent system was utilized. Whey protein (WP) was dissolved in distilled water to achieve homogeneous WP/water solution (30% w/v) by constant stirring for 20 min. Polyvinyl alcohol (PVA) was also used as an auxiliary carrier polymer to get whey protein subjected easily to electrospinning process. The PVA was also solubilized in the pure water (30% w/v) by constant stirring for 30 min at 85 °C. The prepared WP and PVA solutions were mixed with each other at various ratios (PVA: WP; 100:0, 80:20, 60:40, 40:60, 20:80, 0:100). The PVA/WP mixture solutions were stirred at a constant speed for 20 min. The thymol-loaded spinning dope solutions were prepared by addition and dissolving of thymol powder in the amount of 10 wt % thymol based on the total volume of PVA/WP mixture solution to achieve the ratio of 10/30/60 for thymol/PVA-WP /water. Then, the mixture solutions were further mixed at 40 °C for 1 h to achieve homogenization. Then, each solution was taken into 10 mL of injectors (TOP, Japan) equipped with 18-gauga needles.
2.2.2. Electrospinning process
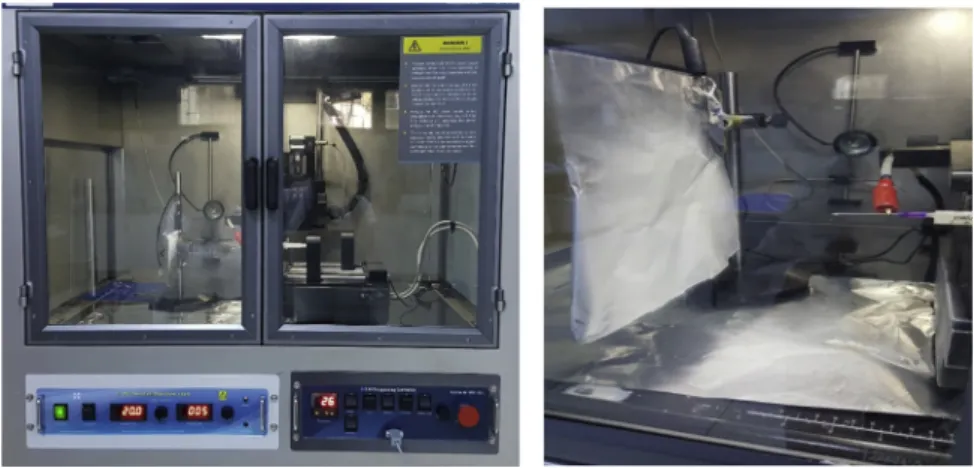
Electrospun nanofiber mats were fabricated using a benchtop elec-trospinning equipment (Holmarc, Nanofiber Elecelec-trospinning Unit, Model No: HO-NFES-043U) (Fig. 1). Each injector was placed in syringe pump (HO-SPLF4) of the electrospinning system. The distance between the collector plate and the injector nozzle was set to 12 cm, the solution feeding speed was at 0.3 mL/h and the voltage (HMPSKV30) was ad-justed to 20 kV. Electrospinning process was conducted at room tem-perature. The spraying feed solutions were entirely vaporized during the electrospraying process. The fabricated nanofiber mats were freeze-dried overnight to remove the absorbed water (Ceylan, Sengor, & Yilmaz, 2018;Yilmaz et al., 2016).
2.3. Characterization analyses
2.3.1. Rheological characterization of spinning dope solutions
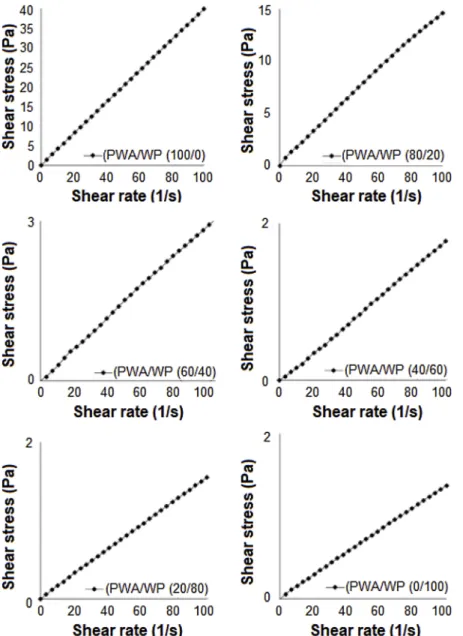
Steady-shear properties of the spinning dope solutions were de-termined by using stress and strain controlled rheometer (Anton Paar, MCR 302, Austria) equipped with a peltier heating system. 60 mm diameter of plate-plate configuration was used in order to shear the samples. The shear rate range was set to 1–100 s−1at 20 °C and the
measurements were formed, accordingly. The measurements were started subsequent to placement of 1 mL samples on the plate. Each
measurement was repeated three times with two replications. Ostwald de Waele model was used in order to reveal the relationship between shear rate and shear stress data as well as to calculate the consistency coefficient (K) and flow behavior index values (n):
σ = Kγn (1)
where σ was shear stress (Pa), K was the consistency coefficient (Pa sn),
γ was the shear rate (s−1) and n was the flow behavior index
(di-mensionless).
2.3.2. Determination of zeta potential (ζ) and electrical conductivity of nanofiber mats
Nano ZSP (Malvern Instruments Corp., Worcestershire, U.K.) device was used in order to evaluate the zeta (ζ) potential, namely the colloidal dispersion stability (electrophoretic mobility) of the nano-fiber sam-ples. 1 mg of each sample was dispersed in 5 mL phosphate buffer so-lution (PBS), then transferred into electrode containing zeta potential cell. Each measurement was performed at 25 °C and repeated 10 times. Zeta (ζ) potential of nano-fibers was calculated according to Smoulokowski model equation given below:
ξ= ημ/ε (2)
where η expresses the viscosity; μ, electrophoretic mobility and ε, di-electric coefficient of the solvent. The di-electrical conductivity of the nanofiber mats were determined using the Nano ZSP device.
2.3.3. Molecular characterization of nanofiber mats
Chemical structure of free thymol (FT), thymol-free nanofibers (TFNs) and thymol-loaded nanofibers (TLNs) were characterized by using ATR-FTIR (Attenuated Total Reflectance-Fourier Transform Infrared Spectroscopy) spectroscopy. Measurements were taken from 4000 to 600 cm−1 with a resolution of 2 cm−1 with 16 scans per
spectrum and the air spectrum was measured alongside measuring background air spectrum prior to actual measurements. In order to attain spectrums, KBr beam spreader and Bruker Tensor 27 (Karlsruhe, Germany) spectroscopy equipped with DLaTGS detector was used. Besides, diamond cell accessorized ATR device was used. Data ac-quiring and instrumental control were done with OPUS (Version 7.2 for Windows, Bruker GmBH).
2.3.4. Thermal characterization of nanofiber mats
Thermal characterization of FT, TFNs and TLNs were determined using DSC (Differential Scanning Calorimetry) (DSC, Q100, TA Instruments Inc., New Castle, DE, USA) device. In the analysis, 5 mg of sample was hermetically placed into aluminum pan that was heated from 20 °C to 250 °C temperature. Temperature increase was set to 10 °C/min and the analysis executed at constant 20 mL/min flow rate under nitrogen atmosphere pressure. Empty pan was used as a
reference. Extrapolated onset temperature (Tonset), maximum peak
temperature (Tpeak) (namely, crystallization and melting characteristics
of each sample) and enthalpy (ΔH) values were obtained using the data processor of the device.
2.3.5. Morphological characterization of nanofiber mats
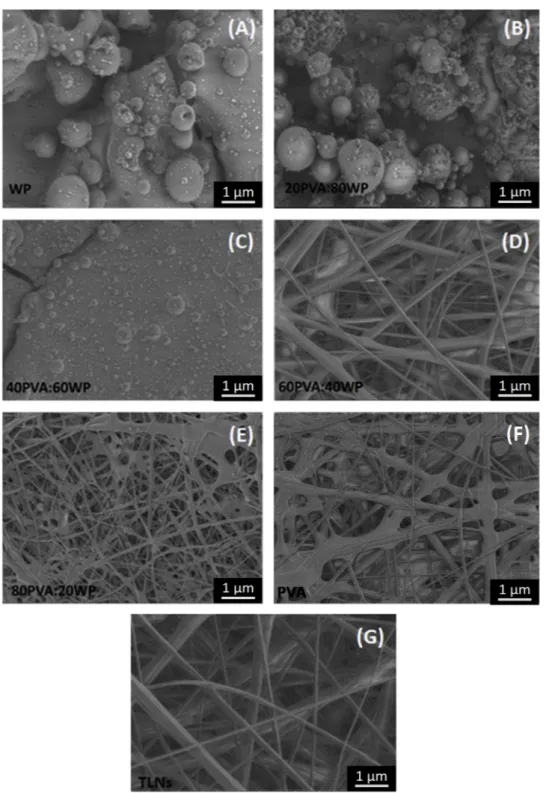
Surface morphology and dimensions of nano-fibers were revealed using a field emission scanning electron microscopy (SEM, FEI, Quanta Feg 250, USA) with magnifications of 10,000 and 20,000×. Morphological characterization of TFNs and TLNs was conducted under low vacuum pressure, 8 mm distance and under voltage of 20 kV. In
vitro and in situ evaluations were conducted by using the TLNs
fabri-cated from 60/40 ratio of PVA/WP because the SEM images revealed that best nanofiber structure could be obtained by using PVA/WP polymers at this ratio, as will be discussed later.
2.4. Determination of antimould properties 2.4.1. Cultivation of fungi
Before use, Aspergillus parasiticus was activated for 5 days at 25 °C. After the activation, fungi spores were collected by using sterilized loop. The collected spores were added into sterilized Ringer solution (Merck, Darmstadt, Germany). Thoma haemocytometer was used to determine the final inoculum concentration. 0.1 mm height of spore was put into the hole of haemocytometer and the result of the count was calculated using the following formula:
Total number of cell = A × SF × 10.000 (3)
where A = 16 which represents the number of fungi counted on the big square and SF stands for the dilution factor. Afterwards, the con-centration was brought to 1 × 10⁵spores/mL. The prepared
suspen-sions were mixed by using vortex mixer for 30 s before the inoculation process.
2.4.2. In vitro evaluations
The antimould activity of thymol-loaded nanofiber mats was tested based on agar diffusion method, as outlined (Yilmaz et al., 2016). Na-nofiber mats were cut into circular disks each of which was 2 cm in diameter and 4 mg in weight. As aforementioned above, TLNs (fabri-cated from 60/40 ratio of PVA/WP) selected based on SEM images were selected to test and antimould activity and sterilized under UV light for 30 min. The amount of thymol that was encapsulated in the 4 mg of fiber mats was 1.0 mg given that 40 g of fiber mats included 10 g of thymol (10 g of thymol plus 30 g of dried PVA/WP) after a complete vaporization due the electrospinning process. The cut of nanofiber mats (including 1.0 mg of TLNs) was placed at the center of petri plates on which sterilized PDA was formerly poured at ˜10 ml/plate. Therefore, the final concentration of the thymol encapsulated in nanofiber on the
agar in plates corresponded to 0.01% based on the weight of PDA. A mycelial disc of 5 mm diameter (20 μL, 1 × 10⁵ spores/mL) of the
mycotoxigenic mould was taken from 7-d-old culture and placed at the center of the disc of nanofiber mat. To reveal the efficiency of the en-capsulation process, antimould effectiveness of free thymol was also tested to achieve a fair comparison between the treatments above. For this purpose, a sterilized PDA supplemented with 0.01% free thymol based on the weight of PDA (corresponding 1 mg of free thymol based on 10 ml of PDA at each petri plate) was spread onto the petri plates whose centers also included a mycelial disc of 5 mm diameter of the mycotoxigenic mould. The antimould activity of TFNs (not including thymol) were also tested and compared with the above treatments to reveal if the PVA/WP biopolymer mixture would also contribute to this antimould effect. Control petri plates including only the test micro-organism were also considered in this comparison. All petri plates were incubated at 25 °C for 5 days. At the end of the 1st, 3rd, and 5thdays,
diameters of mycelial growths were measured using a digital caliper. The fungicidal and fungistatic effects of the free thymol and TLNs were also determined as outlined (Thompson, 1989). For this purpose, different concentrations (at 0.005, 0.0075, 0.015, 0.025, 0.03, 0.05, 0.075 and 0.1% w/v) of free thymol were mixed in 100 mL of the molten PDA. Regarding the process for TLNs, the cuts of nanofiber mats at different weights were placed at the center of petri plates to achieve the final concentrations (at 0.005, 0.0075, 0.015, 0.025, 0.03, 0.05, 0.075 and 0.1% w/v) of thymol encapsulated in nanofiber. For both samples, a mycelial disc of 5 mm diameter (20 μL, 1 × 10⁵spores/mL)
of the mycotoxigenic mould was taken from 7-d-old culture and placed at the center of the discs of nanofiber mats. All the remaining proce-dures were the same as reported above. All petri plates were incubated at 25 °C for 5 days, then the fungal discs not exhibiting any growth were transferred to fresh PDA plates without free thymol and nanofiber mats for additional 6 days at 25 °C in order to establish which concentration of each sample would have a fungistatic effect. The minimum inhibition concentration (MIC) as also described by the fungistatic effect was described based on the lowest concentration of each sample which entirely blocked apparent mycelial growth. The minimum fungicidal concentration (MFC) as also defined by fungicidal effect was de-termined by sub-culturing of the samples with no fungal growth in PDA and incubation at 25 °C for 72 h to see if the inhibition was reversible or permanent. MFC was established as the highest dilution (lowest con-centration) at which there was no growth on the plates.
2.4.3. In situ evaluations and surface coating process
Before slicing, surface of kashar cheese samples were sterilized by dipping in the solutions of 1% sodium hypochlorite for 3 min, rinsed with distilled water and allowed to dry at room temperature (Yilmaz et al., 2016). Then, the kashar cheese samples were sliced in cubic shape with a sterile plastic knife in a size of 3 × 3 × 3 cm3. 20 μL of
spore suspension of (105spore/mL) of Aspergillus parasiticus was
7 day of storage day (Yilmaz et al., 2016).
2.5. Statistical analysis
The experimental data were collected twice with three replications. Collected data were subjected to analysis of variance (ANOVA). When a significant (p < 0.05) main effect was found, mean values were further analyzed using t-comparison test (JMP, release 6.0.0).
3. Results and discussion
3.1. Rheological properties of spinning dope solutions
The Ostwald de Waele parameters were calculated with R2values
greater than 0.99 (Table 1). The model parameters, consistency coef-ficient (K) and flow behavior index (n) of the spinning dope solutions were calculated to range from 0.016 to 0.418 Pa snand from 0.933 to
0.991, respectively. The n values were lower than unity, implicating that the solutions showed shear-thinning behavior with pseudoplastic nature. Similar flow behavior was reported for another fermented dairy product (Yilmaz et al., 2015). On the other hand, although all the n values were lower than 1, they were very close to unity, which also showed that all the solutions exhibited a flow near to Newtonian be-havior. This is also clear from theFig. 2which shows the correlations between the shear rate and the shear stress of the solutions. From the figure, it is clear that the spinning dope solutions prepared at all PVA/ WP ratios exhibited a straight line although they exhibited a shear-thinning behavior. The K values of the solutions decreased as the ratio of WP increased, which reveals the effect of PVA to increase viscosity of the solutions.
3.2. Dispersion stability and electrical conductivity of nanofiber mats
Zeta potential values of the nanofiber mats were measured in order to determine their dispersion stability. Stability of FT (free thymol), TFNs (thymol-free nanofiber mats) and TLNs (thymol-loaded nanofiber mats) were tested by zeta potential measurements. TFNs fabricated from different ratios of PVA/WP represented negative zeta potential values varying from –6.34 mV to –9.43 mV and decreasing as PVA concentration increased (Table 2). The negative zeta potential values were thought to be due to the presence of WPI in the structure of na-nofiber mats. Accordingly, Jiang et al. (2018)reported the negative zeta potential values of WPC (whey protein concentrate) and WPI (whey protein isolate) ranging from 12.30 to 31.0 mV at all tested concentrations under different processing conditions. On the other hand, the effect of PVA to decrease the zeta potential values was also seen in the results ofde la Cruz et al. (2012)who reported that PVA concentration had a strong effect on the reduction of zeta potential values when it is absorb on the MWCNT (multi-walled carbon nano-tubes) surface. Thymol was also determined to have negative zeta po-tential values, and as can be expected, the zeta popo-tential values of the TLNs were found to be within the negative ranges and close to those of Within each column, different superscript lowercase letters show differences
TFNs.
The conductivity values of FT, TFNs and TLNs were measured to range between 17.70 and 20.3 mS/cm (0.017 and 0.020 μS/cm)
(Table 2). The conductivity values of TFNs were similar to those of PVA-based nanofiber mats fabricated byChotimah et al. (2016) who re-ported these values as 0.03, 0.15 and 0.28 μS/cm.Table 2also shows that the conductivity values of TFNs increased as the PVA ratio de-creased.
3.3. Molecular characterization of nanofiber mats
Fig. 3 shows the ATR-FTIR spectra of FT, TFNs, and TLNs. The spectrum of FT (Fig. 3A) reveals the characteristic peaks of thymol at 2957 and 2926 cm−1assigned to CeH stretching vibrations specific to
CH and CH2and at 1623 cm−1C]O attributed to stretching vibration,
CeN stretching and COO−asymmetric stretching (Topala & Tataru, 2016). The aromatic character of thymol is reflected by C]C stretching of benzene ring at 1623 cm−1 (Rukmani & Sundrarajan, 2012). The
other peaks were observed at 1587 cm−1, which was associated with
aromatic domain and NeH bending, at 1420 and 1380 cm−1
re-presenting CeO stretching vibrations (amide), CeC stretching from phenyl groups, COO− symmetric stretching and CH
2 bending, at
1254 cm−1due to CeO stretching and at 996, 940 and 862 cm−1
be-cause of CeH out-of-plane bending vibrations from isoprenoids (Topala & Tataru, 2016). The peaks at 1358 cm−1and 1225 cm−1correspond to
Fig. 2. Shear rate versus shear stress data for spinning dope solutions prepared with different ratios of PVA (polyvinyl alcohol) and WP (whey protein). Table 2
Stability and electrical conductivity values of thymol and nanofiber mats. Samples (ζ) Zeta otential (mV) Conductivity (mS/cm)
FT† −7.50 ± 0.01e 19.16 ± 0.01b TFNs‡ 100/0 −6.34 ± 0.01h 17.70 ± 0.01d 80/20 −6.73 ± 0.01g 18.06 ± 0.04cd 60/40 −7.44 ± 0.01f 18.63 ± 0.01bcd 40/60 −7.71 ± 0.01c 18.76 ± 0.02bc 20/80 −8.51 ± 0.01b 19.05 ± 0.02b 0/100 −9.43 ± 0.01a 20.30 ± 0.01a TLNs⸹ −7.60 ± 0.01d 18.70 ± 0.01bc †FT: Free thymol.
‡TFNs: Thymol-free nanofiber mats fabricated from different ratios of PVA (polyvinyl alcohol) and WP (whey protein).
⸹TLNs: Thymol-loaded nanofiber mats fabricated from 60/40 ratio of PVA/WP. a–eWithin each column, different superscript lowercase letters show differences between the samples (p < 0.05).
eOH bending and CeO stretching of the phenolic group (Rukmani & Sundrarajan, 2012). These peaks could be expected since thymol called as 2-isopropyl-5-methylphenol) is a phenolic monoterpenoid (Schulz, Quilitzsch, & Krüger, 2003;Topala & Tataru, 2016).
Fig. 3(B) shows the ATR-FTIR spectra of TFNs fabricated from dif-ferent ratios of PVA and WP. The peaks observed for TFNs fabricated from PVA (100/0) were observed at 2908 cm−1 ascribed to CH,
1412 cm−1attributed CH, 1240 cm−1assigned C]O and 1096 cm−1
allocated to C]O) (Shehata, Madi, Al-Maadeed, Hassounah, & Ashraf, 2015).Fig. 3(B) shows also the FTIR peaks observed for TFNs fabricated from WP (0/100). The peaks between 2800–3000 cm−1were affiliated
with stretching of CeH bonds of methyl groups (eCH3) (Raei, Rafe, & Shahidi, 2018). A characteristic peak was observed in 1647 cm−1,
which was attributed to C]O stretching vibration of the peptide group while another one was seen at 1543 cm−1assigned to NeH bending
with contribution of CeN stretching vibrations (Raei et al., 2018; Shilpi, Vimal, & Soni, 2015). The peaks observed at 1745 and 1638 cm−1were due to esterified and non-esterified carboxyl groups,
respectively (Monfregola, Leone, Vittoria, Amodeo, & De Luca, 2011). The peak at 1656 cm−1 was ascribed to C]O, while the band at
1534 cm−1was because of CeH bond deformation vibrations of amide
II and the one at 1390 cm−1 was due to CeN stretching of amid I
structures (Zaleska, Ring, & Tomasik, 2001). Regarding the peaks ob-served for TFNs fabricated from the other ratios of PVA/WP (80/20, 60/40, 40/60 and 20/80), they were detected in accord with the above corresponding bands, changing based on the ratio of PVA/WP.
Fig. 3(C) indicates the spectrum of TLNs (thymol-loaded nanofiber mats) fabricated from 60/40 ratio of PVA/WP. The IR spectrum of the TLNs was different from each individual polymer, which indicates that they are compatible with each other in terms of thermodynamics and there were intermolecular interactions between thymol and the func-tional groups of PVA and WP. Similar phenomenon was previously reported (Raei et al., 2018;Rafe & Razavi, 2017).
3.4. Thermal properties of nanofiber mats
Tonset(onset temperature), Tpeak(peak temperature), Toffset(offset
Fig. 3. ATR-FTIR spectra. (A) FT‒ free thymol, (B) TFNs‒thymol-free nanofiber
mats fabricated from different ratios of polyvinyl alcohol (PVA) and whey protein (WP), and (C) TLNs‒ thymol-loaded nanofiber mats fabricated from 60/ 40 ratio of PVA/WP.
Table 3
Thermal characteristics of thymol and nanofiber mats. Samples Thermal parameters§
Tonset(°C) Tpeak(°C) Toffset(°C) ΔH (J/g)
FT† 192a 217a 223a 321a TFNs‡ 100/0 43f 86g 126h 229b 80/20 76b 115b 167e 226bc 60/40 47e 94f 159f 225bc 40/60 48e 98e 182b 220d 20/80 39g 82h 175c 222cd 0/100 51d 101c 169d 225bc TLNs⸹ 61c 99d 145g 112e †FT: Free thymol.
‡TFNs: Thymol-free nanofiber mats fabricated from different ratios of PVA (polyvinyl alcohol) and WP (whey protein).
⸹TLNs: Thymol-loaded nanofiber mats fabricated from 60/40 ratio of PVA/WP. a–eWithin each column, different superscript lowercase letters show differences between the samples (p < 0.05).
Fig. 4. DSC (differential scanning calorimeter) thermograms. (A)
TFNs‒thymol-free nanofiber mats fabricated from different ratios of polyvinyl alcohol (PVA) and whey protein (WP). (B) FT‒free thymol, TFNs‒thymol-free nanofiber mats fabricated from 60/40 ratio of PVA/WP and TLNs‒thymol-loaded nanofiber mats fabricated from 60/40 ratio of PVA/WP.
temperature) and ΔH (enthalpy) values of FT, TFNs and TLNs are pre-sented inTable 3. As can be seen, the FT showed the highest Tonset,
Tpeak, Toffsetand ΔH values. Tonsetand Tpeakvalues of thymol were
de-termined to be 192 and 217 °C, respectively, which could be because of oxidation of the compound. These values were higher than those (123.28 and 148.4, respectively) reported byTrivedi, Patil, Mishra, and Jana (2015). The change in the PVA/WP ratio did not have a clear effect to increase or decrease Tonset, Tpeak, Toffsetand ΔH values. On the
other hand, these values of all TFNs samples were significantly (p < 0.05) different, indicating that the crystallization and melting characteristics of the nanofiber mats could be differentiated using DSC technique. Encapsulation of thymol into nanofiber mats did not
remarkably increase these values of TLNs (Table 3). The lowest en-thalpy value was determined in the TLNs samples.
Fig. 4shows the DSC thermograms of FT, TFNs and TLNs. It is also clear fromFig. 4(A) that the change in the PVA/WP ratio did not have a clear effect on Tonsetand Tpeakvalues.Fig. 4(A) shows that the PVA
polymer (100/0) showed an endothermic glass transition peak around at 88 °C. The second peak was a sharp endothermic melting transition at 217 °C. Similar peak value was reported for PVA homopolymer ( El-Sayed, Mahmoud, Fatah, & Hassen, 2011). On the other hand, WP (0/ 100) showed a peak value at around 75 °C, which was due to dena-turation of β-lactoglobulin. As a result of denadena-turation, intramolecular bonds (covalent (disulfide) and non-covalent bonds) are dissociated,
Fig. 5. Nanomorphology of nano-fibers. (A–F) TFNs‒thymol-free nanofiber mats fabricated from different ratios of polyvinyl alcohol and whey protein (WP/PCA).
which is called as an endothermic process (Chandrapala, Zisu, Palmer, Kentish, & Ashokkumar, 2011). On the other hand, aggregation of de-natured molecules leads to formation of new intermolecular bonds, causing an exothermic peak in DSC measurements (Choi, Kwok, & Ma, 2009). In spite of this expectation, an exothermic peak was not ob-served in this study. However, it was also shown that these two reac-tions may results in a single endothermic peak when they occur si-multaneously (Fitzsimons, Morris, & Mulvihil, 2004).
Fig. 4(B) shows that free thymol (FT) exhibited one endothermic peak at 217 °C corresponding to its melting point. TFNs and TLNs showed two major endothermic peaks around at 100 °C and 225 °C showing their crystallization and melting points. The results obtained for TFNs and TLNs generally reflected the results for each polymer PVA
2016). Another factor affecting the fiber diameter was the viscosity of the spinning dope solutions. FromTable 1, it is clear that the solution viscosity increased from 0.016 to 0.415 Pa snas the PVA concentration.
This result shows that the nanofiber diameter could also be altered with viscosity of the solutions. Similar observation was made byKim et al. (2016)who reported that the PVA based nanofiber diameter can be altered with viscosity of spinning solution and confirmed that the viscosity of the solution shows a linear relationship between its con-centration and nanofiber diameter. Similar trends were also reported for other polymers (Lee, Koo, Sohn, Kim, & Im, 2016;Yang et al., 2004). On the other hand, further increase in the PVA ratio resulted in for-mation of non-uniform and merged nanofiber structure, yielding a de-teriorated structure (Fig. 5(E and F)). Therefore, it can be concluded that the morphology and diameter of the electrospun nanofiber mats were seriously affected by the weight ratio of PVA/WP. From these results, it can be also concluded that the most uniform nanofiber structure could be observed in the TFNs fabricated from 60/40 ratio of PVA/WP (Fig. 5(D)). This was why TLNs were fabricated from 60/40 ratio of PVA and WP; therefore, in vitro/in situ tests were conducted in these nanofiber mats, as will be discussed later.
The average diameter of the nanofiber mats fabricated from 60/40 ratio of PVA and WP was 300 nm (Fig. 5(D)). Encapsulation of thymol into nanofibers increased the average diameter of the nanofiber mats (TLNs) to 371 nm (Fig. 5(G)), which revealed that thymol is well dis-persed in the nano-fibrous polymer structure with no aggregation.
3.6. In-vitro and in situ antimould activity of nanofiber mats as a surface coating material
In this study, antimould activity of nanofiber mats was tested against a mycotoxigenic fungi, Aspergillus parasiticus.Table 4 demon-strates the in vitro antimould activity of thymol (FT) and nanofiber mats unloaded (TFNs) and loaded (TLNs) with thymol against mycelial growth of A. parasiticus. As compared to control group, free thymol (FT) had considerable effect to decrease the mycelial growth. Accordingly, Buchanan and Shepherd (1981) reported that thymol concentration above 500 μg/mL (⁓ 0.05%) completely inhibited the production of A.
parasiticus whereas lower concentrations resulted in either partial or
transitory growth inhibition. These results have proven those reported in the previous studies. In another study conducted byRasooli and Owlia (2005), it was shown that 500–1000 ppm (corresponding to 0.05–0.1%) thyme oils had a lethal effect against A.parasiticus.Klaric, Kosalec, Mastelic, Pieckova, and Pepeljnak (2007)showed that 2% (w/ v) of essential oil of thyme or thymol could inhibit the mould majority of which were the Aspergillus species. From these reports, it is clear that the percentage of thymol between 0.05 and 0.1 is enough to completely inhibit A. parasiticus. In this study, in vitro antimould activity tests re-vealed the similar results. Accordingly, the percentages of free and encapsulated thymol used in our study was 0.01%, and this percentage was enough to see the antimould activity. However, in this study, it was also observed that encapsulation process yielded in higher antimould activity. Accordingly, the mycelial growth values show that the
TFNs 0.8 2.7 4.8 7.5 ‒ ‒
TLNs⸸ 0.4Bc 1.2Db 2.3Da 0.0D 0.015 0.03 † Control group that were not treated with free thymol and thymol-loaded nanofibers (TLNs).
‡FT: Free thymol.
⸹ TFNs: Thymol-free nanofiber mats fabricated from 60/40 ratio of PVA (polyvinyl alcohol) and WP (whey protein).
⸸TLNs: Thymol-loaded nanofiber mats fabricated from 60/40 ratio of PVA/WP. A–DWithin each column, different superscript uppercase letters show differ-ences between the samples within each incubation period (p < 0.05). a–dWithin each row, different superscript lowercase letters show differences between the incubation periods for each sample in terms of mycelial growth diameter values (p < 0.05).
ϕMIC (w/v %) was “Minimum Inhibition Concentration”. ɸMFC (w/v %) was “Minimum Fungicidal Concentration”.
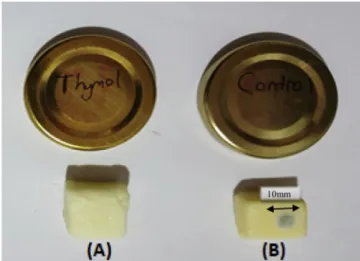
Fig. 6. Surface-coated with TLNs (A) and control (uncoated) cheese cubes (B).
Effect of TLNs (thymol-loaded nanofiber mats fabricated from 60/40 ratio of PVA/WP) on mould growth on cheese cubes inoculated with A. parasiticus at 7th storage day.
antimould effectiveness of nanofiber mats loaded with thymol (TLNs) was significantly (p < 0.05) higher than those of the control, free thymol (FT) and thymol-loaded nanofiber (TLNs) mats and this effec-tiveness was observed at each incubation period (Table 4). More clearly, the growth diameters in the 5thday of incubation were
mea-sured to be 3.2 cm–2.3 cm when the petri plates were treated with FT and TLNs, respectively (Table 4). This corresponds to around 56% of increase in the antimould effectiveness of free thymol when it was capsulated into nanofibers. This result clearly reveals that the en-capsulation process was effective, indicating that enen-capsulation of thymol into nanofiber mats could considerably increase its antimould effectiveness. On the other hand, the mycelial growth values increased with incubation time, which could be expected.
The enhanced antimould activity of the encapsulated thymol in comparison to the free thymol could be explained based on the reports ofHosseini, Zandi, Rezaei, and Farahmandghavi (2013)andJang and Lee (2008)who reported that controlled release of encapsulated ma-terial from the nanofiber structure (TLNs) enabled slow and constant release of thymol from the TLNs. Larger surface area of nano material due to its very small size could be set forth here as the another reason for the increase in effectiveness, giving rise to a greater interactions between the active components encapsulated and cell surfaces of the microorganisms (Lboutounne, Chaulet, Ploton, Falson, & Pirot, 2002). The minimum inhibition concentration (MIC) and minimum fungi-cidal concentration (MFC) values of FT and TLNs against A. parasiticus are also given inTable 4, which indicates their fungistatic and fungi-cidal activities, respectively. The higher antifungal activity against the mould was performed by the TLNs sample which possessed the lower MIC value (0.015%), which confirms that the antimould effectiveness of free thymol could be increased by the encapsulation process. Regarding the MFC values, the lethal effect on the mould was observed at 0.03% and 0.05% of TLNs and FT, respectively.
In order to evaluate the in situ antimould effectiveness TLNs against
A. parasiticus, inoculated kashar cubes were coated with TLNs mats.
Fig. 6(A) and (B) indicate the surface coated and uncoated (control) kashar cubes, respectively inoculated with A. parasiticus at the 7th
sto-rage day, showing a clear antimould effect of TLNs mats against this mycotoxigenic mould. Coating the kashar cube with TLNs appeared to considerably limit the mould growth on the cube face in comparison to the uncoated group cubes. The growth diameter was measured as 8.1 mm on the surface of uncoated kashar cubes; however, coating process yielded in remarkable decrease in the growth diameter of mould colonies, attesting also in situ antimould effectiveness of TLNs mats (Table 4).
4. Conclusions
In this study, electrospun thymol-loaded nanofiber mats (TLNs) were fabricated. The potential of TLNs to limit mould growth on kashar cheese surfaces as an antimould surface coating material was evaluated. TLNs showed a good stability and yielded in a fine and homogeneous nanofiber structure. The in vitro/in situ antimould activity test results demonstrated that TLNs were efficient to inhibit both A. parasiticus. It was also concluded that the thymol encapsulated into the nanofiber mats had stronger antimould efficacy than free thymol against A.
parasiticus. These results revealed the efficiency of the encapsulation
procedure. The coating of kashar cubes with TLNs almost prevented the growth of A. parasiticus within the tested storage time. Based on these results, it can be concluded that electrospun thymol-loaded nanofiber mats can be used as an antimould surface coating material with re-placement of synthetic fungicides to some extent in terms of prevention of mould development on kashar cheese surface.
References
Alvarado, N., Romero, J., Torres, A., de Dicastillo, C. L., Rojas, A., Galotto, M. J., et al.
(2018). Supercritical impregnation of thymol in poly(lactic acid) filled with elec-trospun poly(vinyl alcohol)-cellulose nanocrystals nanofibers: Development an active food packaging material. Journal of Food Engineering, 217, 1–10.
Atasever, M., Nizamlıoğlu, M., Özturan, K., Karakaya, Y., & Ünsal, C. (2006). Erzurum bölgesinde tüketime sunulan süt ve süt ürünlerinin aflatoksin M1 yönünden incelenmesi. II. Ulusal Veteriner Gıda Hijyeni Kongresi (18-20 Eylül 2006, İstanbul) Bildiri
Kitabı231–240.
Azevedo, V. M., et al. (2017). Effect of replacement of corn starch by whey protein isolate in biodegradable film blends obtained by extrusion. Carbohydrate Polymers, 157, 971–980.
Barrios, M. J., Medina, L. M., & Cordoba, M. G. (1997). Aflatoxin-producing strains of Aspergillus flavus isolated from cheese. Journal of Food Protection, 60(2), 192–194.
Buchanan, R. L., & Shepherd, A. J. (1981). Inhibition of Aspergillus parasiticus by thymol. Journal of Food Science, 46, 976–977.
Cazón, P., Velazquez, G., Ramírez, J. A., & Vázquez, M. (2017). Polysaccharide-based films and coatings for food packaging: A review. Food Hydrocolloids, 68, 136–148.
Ceylan, Z., Unal-Sengor, F. G., & Yilmaz, M. T. (2017). Amino acid composition of gilt-head sea bream fillets (Sparus aurata) coated with thymol-loaded chitosan nanofibers during cold storage. Journal of Biotechnology, 256, 28.
Ceylan, Z., Sengor, G. F. U., & Yilmaz, M. T. (2018). Nanoencapsulation of liquid smoke/ thymol combination in chitosan nanofibers to delay microbiological spoilage of sea bass (Dicentrarchus labrax) fillets. Journal of Food Engineering, 229, 43–49.
Chandrapala, J., Zisu, B., Palmer, M., Kentish, S., & Ashokkumar, M. (2011). Effects of ultrasound on the thermal and structural characteristics of proteins in reconstituted whey protein concentrate. Ultrasonics Sonochemistry, 18, 951–957.
Chen, L., & Subirade, M. (2005). Chitosan/β-lactoglobulin core–shell nanoparticles as nutraceutical carriers. Biomaterials, 26(30), 6041–6053.
Choi, S. M., Kwok, S. T., & Ma, C. Y. (2009). Conformational study of SPI treated with ultrasound. Poster presentation.
Chotimah, Rianjanu, A., Winardianto, B., Munir, M., Kartini, I., & Triyana, K. (2016). Electrical conductivity improvement of polyvinyl alcohol nanofiber by solvent va-pour treatment. International Journal on Advanced Science, Engineering and Information Technology, 6, 675–681.
de Faria, A. F., Perreault, F., Shaulsky, E., Chavez, L. H. A., & Elimelech, M. (2015). Antimicrobial electrospun biopolymer nanofiber mats functionalized with graphene oxide-silver nanocomposites. ACS Applied Materials & Interfaces, 7, 12751–12759.
de la Cruz, E. F., Zheng, Y., Torres, E., Li, W., Song, W., & Burugapalli, K. (2012). Zeta potential of modified multi-walled carbon nanotubes in presence of poly (vinyl al-cohol) hydrogel. International Journal of Electrochemical Science, 7, 3577–3590.
Duvail, J. L., Rétho, P., Garreau, S., Louarn, G., Godon, C., & Demoustier-Champagne, S. (2002). Transport and vibrational properties of poly(3,4-ethylenedioxythiophene) nanofibers. Synthetic Metals, 131, 123–128.
El-Sayed, S., Mahmoud, K. H., Fatah, A. A., & Hassen, A. (2011). DSC, TGA and dielectric properties of carboxylmethyl cellulose/polyvinyl alcohol blends. Physica B, 406, 4068–4076.
Elzupir, A. O., Alamer, A. S., & Dutton, M. F. (2015). The occurrence of aflatoxin in rice worldwide: A review. Toxin Reviews, 34(1), 37–42.
Evren, M. (1999). Aflatoksinlerin etki şekilleri, gıdalarda bulunma durumları ve önleme çareleri. O.M.Ü. Ziraat Fakültesi Dergisi, 14(2), 159–172.
Falcone, P., Speranza, B., Del Nobile, M., Corbo, M., & Sinigaglia, M. (2005). A study on the antimicrobial activity of thymol intended as a natural preservative. Journal of Food Protection, 68, 1664–1670.
Fink-Gremmels, J. (2008). Mycotoxins in cattle feeds and carry-over to dairy milk: A review. Food Additives and Contaminants, 25(2), 172–180.
Fitzsimons, S. M., Morris, E. R., & Mulvihil, D. M. (2004). Resolution of the denaturation and aggregation process during whey protein gelation by differential scanning ca-lorimetry. Irish Journal of Agricultural and Food Research, 43, 109–146.
Galvano, F., Galofaro, F., & Galvano, G. (1996). Occurence and stability of aflatoxin M1 in milk and milk products. Journal of Food Protection, 59, 1079–1090.
Güley, Z., Uysal, H. R., & Kılıç, S. (2013). Investigation of the presence of aflatoxin M1, aflatoxin B1 and aflatoxigenic moulds in some naturally mould-ripened traditional cheeses. Ege Journal of Agricultural Research, 50(2), 145–152.
Günşen, U., & Büyükyörük, İ. (2001). Piyasadan temin edilen taze kaşar peynirlerinin bakteriyolojik kaliteleri ile aflatoksin M1 düzeylerinin belirlenmes. Turkish Journal of Veterinary and Animal Sciences, 27, 821–825.
Gürses, M., Erdoğan, A., & Çetin, B. (2004). Occurence of aflatoxin M1 in some cheese types sold in Erzurum, Turkey. Turkish Journal of Veterinary and Animal Sciences, 28, 527–530.
Hosseini, S. F., Zandi, M., Rezaei, M., & Farahmandghavi, F. (2013). Two-step method for encapsulation of oregano essential oil in chitosan nanoparticles: Preparation, char-acterization and in vitro release study. Carbohydrate Polymers, 95(1), 50–56.
Jahangir, M. A., Rumi, T. M., Wahab, M. A., Khan, M. I., Rahman, M. A., & Sayed, Z. B. (2017). Poly lactic acid (PLA) fibres: Different solvent systems and their effect on fibre morphology and diameter. American Journal of Chemistry, 7(6), 177–186.
Jang, K.-I., & Lee, H. G. (2008). Stability of chitosan nanoparticles forL-ascorbic acid during heat treatment in aqueous solution. Journal of Agricultural and Food Chemistry, 56(6), 1936–1941.
Jiang, S., Hussain, M. A., Cheng, J., Jiang, C., Geng, H., Sun, Y., et al. (2018). Effect of heat treatment on physicochemical and emulsifying properties of polymerized whey protein concentrate and polymerized whey protein isolate. LWT—Food Science and Technology, 98, 134–140.
Jordano, R., Jodral, M., Martinez, P., Salmeron, J., & Pozo, R. (1989). Aflatoxin-produ-cing strains of Aspergillus flavus in yogurt. Journal of Food Protection, 52(11), 823–824.
Kim, J. H., Lee, H., Jatoi, A. W., Im, S. S., Lee, J. S., & Kim, I. S. (2016). Juniperus chinensis extracts loaded PVA nanofiber: Enhanced antibacterial activity. Materials Letters, 181, 367–370.
development. Polymer Chemistry, 2(4), 800–804.
Oruç, H. H. (2003). Aflatoxin M1 (AFM1) in milk and milk products and situation in Turkey. Uludag University Journal of the Faculty of Veterinary Medicine, 22, 121–125.
Raei, M., Rafe, A., & Shahidi, F. (2018). Rheological and structural characteristics of whey protein-pectin complex coacervates. Journal of Food Engineering, 228, 25–31.
Rafe, A., & Razavi, S. M. A. (2017). Scaling law, fractal analysis and rheological char-acteristics of basil seed gum cross-linked with sodium trimetaphosphate. Food Hydrocolloids, 62, 58–65.
Rasooli, I., & Owlia, P. (2005). Chemoprevention by thyme oils of Aspergillus parasiticus growth and aflatoxin production. Phytochemistry, 66(24), 2851–2856.
Rukmani, A., & Sundrarajan, M. (2012). Inclusion of antibacterial agent thymol on β-cyclodextrin-grafted organic cotton. Journal of Industrial Textiles, 42(2), 132–144.
Sanguansri, P., & Augustin, M. A. (2006). Nanoscale materials development—A food industry perspective. Trends in Food Science & Technology, 17(10), 547–556.
Schulz, H., Quilitzsch, R., & Krüger, H. (2003). Rapid evaluation and quantitative analysis of thyme, oregano and chamomile essential oils by ATR-IR and NIR spectroscopy. Journal of Molecular Structure, 661(1), 299–306.
Shehata, N., Madi, N., Al-Maadeed, M., Hassounah, I., & Ashraf, A. (2015). Improved electrical conductivity of carbon/polyvinyl alcohol electrospun nanofibers. Journal of Nanomaterials.https://doi.org/10.1155/2015/812481Article ID 812481.
Shilpi, S., Vimal, V. D., & Soni, V. (2015). Assessment of lactoferrin-conjugated solid lipid
Vazquez, B., Fente, C., Franco, C., Vazquez, M., & Cepeda, A. (2011). Inhibitory effects of eugenol and thymol on Penicillium citrinum strains in culture media and cheese. International Journal of Food Microbiology, 67, 157–163.
Yang, Q., Li, Z., Hong, Y., Zhao, Y., Qiu, S., Wang, C., et al. (2004). Influence of solvents on the formation of ultrathin uniform poly(vinyl pyrrolidone) nanofibers with elec-trospinning. Journal of Polymer Science Part B: Polymer Physics, 42, 3721–3726.
Yilmaz, M. T., Dertli, E., Toker, O. S., Tatlisu, N. B., Sagdic, O., & Arici, M. (2015). Effect of in situ exopolysaccharide production on physicochemical, rheological, sensory, and microstructural properties of the yogurt drink ayran: An optimization study based on fermentation kinetics. Journal of Dairy Science, 98, 1604–1624.
Yilmaz, A., Bozkurt, F., Cicek, P. K., Dertli, E., Durak, M. Z., & Yilmaz, M. T. (2016). A novel antifungal surface-coating application to limit postharvest decay on coated apples: Molecular, thermal and morphological properties of electrospun zein–nano-fiber mats loaded with curcumin. Innovative Food Science & Emerging Technologies, 37, 74–83.
Zaleska, H., Ring, S., & Tomasik, P. (2001). Electrosynthesis of potato starch-whey protein isolate complexes. Carbohydrate Polymers, 45(1), 89–94.
Zink, J., Wyrobnik, T., Prinz, T., & Schmid, M. (2016). Physical, chemical, and bio-chemical modifi-cations of protein-based films and coatings: An extensive review. International Journal of Molecular Sciences, 17, 1376.