Spectroscopy
I. H. Dara,1 A. Ankara,2 G. Akovali,3 S. Suzer4
1Polymer Science and Technology Department, Middle East Technical University, 06530 Ankara, Turkey
2Department of Metallurgical and Materials Engineering, Middle East Technical University, 06530 Ankara, Turkey 3Department of Chemistry, Middle East Technical University, 06530 Ankara, Turkey
4Department of Chemistry, Bilkent University, 06800 Ankara, Turkey
Received 21 January 2004; accepted 3 August 2004 DOI 10.1002/app.21500
Published online in Wiley InterScience (www.interscience.wiley.com).
ABSTRACT: Diffuse reflectance infrared Fourier trans-form (DRIFT) spectroscopy was used to assess the effects of heat damage on carbon-fiber-reinforced polymer compos-ites. Moisture-saturated graphite– epoxy laminates with a quasi-isotropic lay-up were heat-damaged above their up-per service temup-peratures. The loss of matrix-dominated me-chanical properties due to heat exposure was investigated in the laboratory under environmental testing conditions with mechanical tests, ultrasonic C-scanning, and DRIFT spec-troscopy. The reduction of the mechanical strength of the composite materials was accompanied by an increase in the
carbonyl band integral and a decrease in the phenyl ratio and hydroxyl and hydrocarbon band integrals, as shown by the DRIFT spectra. DRIFT was confirmed to be more effec-tive than ultrasonic inspection in evaluating the extent of heat damage, and a good correlation was found between the mechanical test results and DRIFT spectra. © 2005 Wiley Periodicals, Inc. J Appl Polym Sci 96: 1222–1230, 2005
Key words:composites; degradation; infrared spectroscopy; mechanical properties; resins
INTRODUCTION
A high strength-to-weight ratio, a good stiffness-to-density ratio, high dimensional stability, and good corrosion resistance are the most important features of high-performance carbon-fiber-reinforced polymer (CFRP) composite components, which are extensively used in the aerospace industry. In the last 2 decades, the safety and reliability of these materials have gained more importance with their increased utiliza-tion. The tendency of carbon– epoxy composites to become irreversibly damaged because of exposure to elevated temperatures is of particular interest in the aerospace industry; therefore, the characterization of such heat damage in CFRP composite structural com-ponents has attracted considerable attention.
The upper service temperature for most epoxy resin composites has been reported to be 140°C. High-tem-perature exposure above this may cause heat damage resulting in a severe loss of mechanical properties of the composite structure. The resin properties are a
primary concern in the assessment of the heat damage of CFRP components, as thermal degradation is ma-trix-dominated.1,2 High-temperature exposure leads to resin degradation, which is associated with a drop in the glass-transition temperature, which reduces the mechanical strength of the composite. Surface em-brittlement and cracking lead to a loss of impact strength, and this may finally lead to irreversible and catastrophic failure.3
The heat damage of CFRP components of aerospace structures may be due to handling mishaps, accidents (fires, etc.), lightening strikes, or ground-reflected en-gine efflux from landing aircraft. When a component is exposed to overheating locally, shriveling and blis-ters may occur on the surface, and the internal del-aminations resulting from them may be examined by nondestructive inspection (NDI) techniques. How-ever, there is no technology available yet to discrimi-nate undamaged sections of graphite– epoxy lami-nates from damaged section of the lamilami-nates if the damage cannot be observed visually. Therefore, it is not practically possible to repair this type of damage with confidence. There is a crucial need for an indus-trial NDI method that can be readily applied to aero-space structures to provide reliable and repeatable estimations of damaged zones and possible heat-damage effects on physical and mechanical properties of CFRP composite structures.4Nondestructive exam-Correspondence to: S. Suzer ([email protected]).
Contract grant sponsor: North Atlantic Treaty Organiza-tion—Applied Vehicle Technology Panel (NATO-AVT); contract grant number: T-123.
Journal of Applied Polymer Science, Vol. 96, 1222–1230 (2005) © 2005 Wiley Periodicals, Inc.
Panel production and moisture saturation
The test plates were produced by European Aircraft Defence and Space Co. (Munich, Germany) from a Hercules IM7/8552 carbon– epoxy prepreg (Denver, CO). This prepreg is a commercially available product and is produced through the impregnation of an amine [diamino diphenyl sulfone (DDS)]-cured [tetra-glycidyl methylene dianiline (TGMDA)] epoxy resin into unidirectional carbon-fiber fabric. The plates were hand-laid and cured in an autoclave according to the producer’s recommended cure cycle by a conventional vacuum bag procedure. The stacking sequence was [0/0/⫹45/⫺45/0/0/⫹45/⫺45/0]symmfor the 18-ply
interlaminar shear strength (ILSS) test plates and [⫹45/⫺45/0/90]4symm for the compression strength
test plates. The parent laminates were inspected by ultrasonic C-scanning for any production defects be-fore moisture saturation. The parent laminates were then cut into test plates of various sizes for compres-sion and interlaminar shear testing.
The epoxy resins absorb high levels of moisture under the ambient conditions because of their hydro-philic nature. Therefore, all thermal loading and me-chanical testing of the specimens were carried out under a wet (moisture-saturated) condition to simu-late the actual service conditions of aircraft compo-nents. Moisture conditioning was performed accord-ing to ASTM E 104 (“Standard Practice for Maintain-ing Constant Relative Humidity by Means of Aqueous Solutions”). The test plates were moisture-saturated in a humidity chamber in which an aqueous KCl solution provided 85% relative humidity at 70°C. The absorbed moisture behaved as a plasticizer in the matrix and caused a considerable decrease in the mechanical properties of the composite. When exposed to high temperatures, the absorbed water evaporated and could be trapped in the laminate and lead to severe delamination.7The main reason for the moisture con-ditioning for the test plates before thermal loading was to include moisture effects that aircraft compo-nents experience during actual service conditions.
Thermal loading of the test specimens
The moisture-saturated test panels were thermally loaded at various temperatures in a Memmert Gmbh
furnace was stabilized at the set temperature (this took a few minutes), the lid of the refractory box was re-moved to simulate sudden one-sided heat exposure. Thermocouples were placed beneath the selected test plates to confirm that the surfaces of the plates that were not exposed to heat could be kept at a low temperature during the short period in which the furnace stabilized at the preset temperature. After heat exposure, the plates were removed from the furnace and cooled to room temperature before mechanical testing. After thermal loading, the test panels were reinspected by ultrasonic C-scanning for any damage effects. Figure 1 presents C-scan images of the ILSS test plates.
Mechanical testing
The mechanical testing of test plates was performed at room temperature and a high temperature (120°C) according to ASTM 695M (“Test Method for the De-termination of Compression Strength and Modulus of Rigid Plastics and Fibre Reinforced Plastics”) and EN 2563 (“Test Method—Determination of Interlaminar Shear Strength”). The results of these tests and the average compressive and ILSS loss values are given in Tables I and II, respectively.
DRIFT spectroscopy
DRIFT spectroscopy is a practical NDI method in which an IR light beam is scattered from the surface of a material and the diffusely scattered light is collected and converted into an IR spectrum. Qualitative and quantitative chemical information is obtained from this DRIFT spectrum. One advantage of DRIFT spec-troscopy over other internal reflectance techniques is that this method of spectroscopy does not require mechanical contact with the material.8,9 A Bomem
MB102 Fourier transform infrared instrument (Que-bec, Canada) with a Harrick praying mantis diffuse reflectance attachment was used in this study. The spectrometer had a CsI beam splitter with a usable spectral range of 210 –5000 cm⫺1. The DRIFT spectra were collected at a resolution of 4 cm⫺1with 256 scans. Five DRIFT spectra were collected for each specimen,
and these data were evaluated and used to quantify the ratios of the chemical moieties in the outer layer of the resin.10Spectral data were reduced to meaningful and comparable numbers by baseline correction and normalization. The three important steps of the pro-cedure are given in Figure 2. Peak areas were used in spectral elaboration studies. The phenyl ratio and hy-drocarbon and carbonyl band integrals were calcu-lated for further correlation with mechanical test re-sults.
RESULTS Mechanical test results
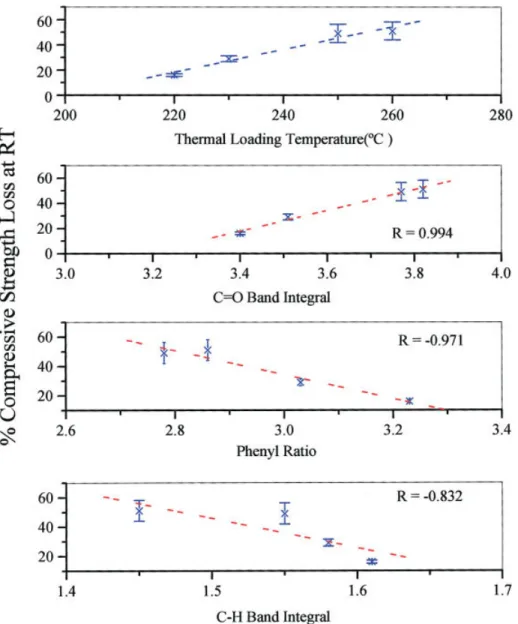
The compressive strength loss for the test plates ther-mally loaded at 260°C was around 50%, which also increased with an increasing thermal loading temper-ature, as expected. However, the standard deviations were high for the compressive strength values, and so these values were used only to probe the general trends. The maximum ILSS strength loss at room tem-perature was around 16% for thermally loaded test panels at 260°C, whereas it reached up to 40% at 120°C. The absorbed moisture resulted in a 10% ILSS loss at room temperature and a 45% loss at 120°C. The ILSS loss at room temperature versus the thermal loading temperature is displayed at the top of Figure 3. Similar trends were also observed at 120°C (not shown). The ILSS loss decreased until 220°C, after which it started to increase. The initial decrease was attributed to the probable postcure reactions taking place at this temperature, in agreement with the re-sults of previous researchers.11,12Visual delamination
was observed for specimens thermally loaded at
Figure 1 C-scan images of ILSS test panels thermally loaded at (a) 180, (b) 190, (c) 200, (d) 210, (e) 220, (f) 230, (g) 250, and (h) 260°C. [Color figure can be viewed in the online issue, which is available at www.interscience.wiley.com.]
TABLE I
Compression Test Results and Compressive Strength Loss Values Specimen ID Exposure temperature (°C) Average compressive strength at room temperature (MPa) Compressive strength loss (%) 8552-REF — 485.3⫾ 11.2 — 8552-220 220 406.9⫾ 27.5 16 8552-230 230 347.8⫾ 28.7 29 8552-250 250 249.2⫾ 37.1 49 8552-260 260 239.1⫾ 33.2 51 TABLE II
ILSS Test Results and ILSS Loss Values
Specimen ID
Exposure temperature
(°C)
Average ILSS at room temperature
(MPa)
ILSS loss at room temperature (%) Average ILSS at 120°C (MPa) ILSS loss at 120°C (%) 8552-REF — 85.9⫾ 2.8 — 56.9⫾ 3.1 33.8 8552-WETREF — 77.8⫾ 3.6 9.4 47.8⫾ 1.6 44.3 8552-180 180 81.3⫾ 1.8 5.3 55.8⫾ 2.6 35.0 8552-190 190 81.9⫾ 2.8 4.6 57.2⫾ 1.3 32.4 8552-200 200 85.6⫾ 3.0 0.3 58.1⫾ 1.2 33.4 8552-210 210 84.1⫾ 2.1 2.1 59.1⫾ 2.7 31.2 8552-210 (as received) 210 83.3⫾ 3.6 3.0 59.9⫾ 1.8 30.3 8552-220 220 80.8⫾ 3.3 5.9 56.9⫾ 1.5 33.8 8552-230 230 79.3⫾ 3.7 7.7 57.4⫾ 1.5 33.2 8552-250 250 77.8⫾ 3.5 9.4 55.9⫾ 1.5 35.0 8552-260 260 72.4⫾ 3.7 15.7 52.5⫾ 3.4 38.9
260°C. Therefore, the results at this temperature were not included for DRIFT correlations.
DRIFT spectroscopy results
Thermal damage is a complex process that may in-volve several mechanisms causing a loss of strength without oxidation of the resin due to heat exposure
above the glass-transition temperature and a loss of strength due to oxidative degradation of the resin and fiber–resin interface through oxidation, hydrolysis, and dehydration reactions.13Oxygen addition as
car-bonyl species, the loss of hydrocarbon and hydroxyl species, and changes in the structure of aromatic rings (in some cases) are indications of the aforementioned reactions and can be monitored with DRIFT spectra.14 Figure 2 Steps involved in obtaining a DRIFT spectrum. In step 1 (top graph), the background spectrum is obtained from the mirror surface. In step 2 (middle graph), the background-subtracted spectrum shows the different regions. In step 3 (bottom graph), the baseline-corrected final spectrum is obtained. R0⫽ the intensity of the reflected beam from the reference
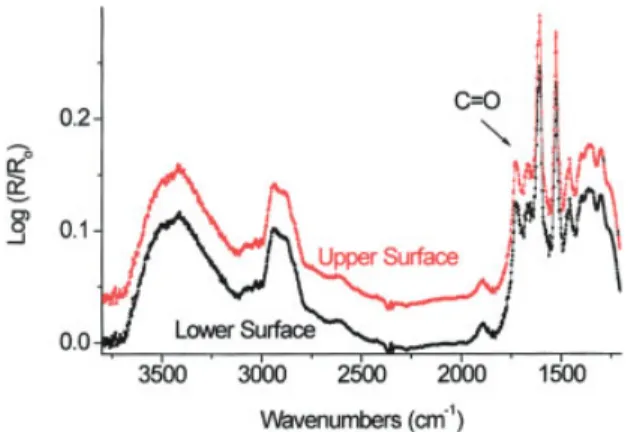
DRIFT spectroscopy can detect chemical evidence of oxidation of the outer resin layer in carbon– epoxy composites. However, in a previous study15 on
ther-mal loading effects of CFRP composites, the tempera-ture distribution in the thickness direction of a lami-nate produced from the same IM7/8552 carbon– ep-oxy system (subjected to 200°C from one face) showed explicitly the rapid propagation of heat in the through-thickness direction of the laminate. This re-vealed that the thermal damage within the laminate was widespread and could cause delaminations be-tween all plies and microcracking in the matrix resin. Cross verification of this result was demonstrated by a comparison of the DRIFT spectra obtained from both surfaces of a carbon– epoxy test plate thermally loaded at 220°C.10 The prepreg (HMF/F263, Hexcel,
Da-gneux, France) used for the production of this test plate was an epoxy resin [amine (DDS)-cured (TG-MDA)] similar to the prepreg used for the production of test plates in this study. The DRIFT spectrum ob-tained from the surface, which was exposed to heat, overlapped the DRIFT spectrum obtained from the surface, which was not exposed to heat, with almost one-to-one correspondence, as shown in Figure 4. Therefore, we could comment on the bulk mechanical properties, using the results based on the surface chemical analysis of a laminate in a similar thickness range.
The DRIFT spectra were normalized on the basis of the broad and rather featureless region of absorption around 1350 cm⫺1, which was relatively unaffected by thermal damage. The spectra were scaled so that each
Figure 3 Variation of the ILSS loss at room temperature (RT) with the thermal loading temperature, carbonyl band integral, phenyl ratio, and hydrocarbon band integral. R⫽ correlation coefficient.
had the same near nominal value at 1350 cm⫺1, and this value was calculated as an average of 1335–1365 cm⫺1 for all groups of test plates. There were two regions of the spectra to be considered: (1) the 1200–2000-cm⫺1 region, which included the carbonyl region in which oxygen addition reactions resulted in absorption bands occurring between 1600 and 1900 cm⫺1, and (2) the 2000–4000-cm⫺1region, which contained bands for ali-phatic and aromatic hydrocarbons, amines, and hy-droxyls.16 –18The term band refers to a normalized peak
height. The term band integral (or area) refers to an inte-gral over some region of the baseline-corrected spectrum divided by the integral between 1335 and 1365 cm⫺1; this region of the spectrum was not strongly affected by oxidation. For the carbonyl region, the integration range was 1600–1825 cm⫺1, whereas for the hydrocarbon re-gion, it was 2660–3125 cm⫺1. The phenyl ratio was cal-culated by the division of the maximum and minimum of the baseline-corrected spectra between 1500 and 1550 cm⫺1.
Characteristic spectra are plotted in Figure 5 for the as-produced reference group and for test plates ther-mally loaded at 210, 220, 230, and 250°C. They exhibit the main absorption bands to be considered for this specific material.
The CAO (carbonyl) stretch band occurring at 1660 cm⫺1 was primary evidence for the presence of an aldehyde or ketone. In addition, the absence of a methyl group in the spectra indicated that isomeriza-tion to an aldehyde rather than to a ketone was pre-ferred:19
C } H2
O
O{C HOCH23 ROCH2OCH2O
O 储 COH
such as electrophilic substitution and oxidation. The DRIFT spectra of the test plates thermally loaded at 260°C were discarded during calculations because these plates exhibited delamination, which could be detected visually. Therefore, the mechanical test results obtained for this temperature were considered to be unreliable. TheOCAO (carbonyl) band occurring at 1665 cm⫺1was attributed to amide formation.16 –18 The increase in the
carbonyl band integral with an increasing thermal load-ing temperature was a strong indication of thermooxi-dative degradation. The band at 1300 cm⫺1was attrib-uted toOCN stretching vibrations, and the distinct band occurring at 1250 cm⫺1 was most likely due to the OCOC and OCOCON vibrations of aromatic amine groups.16 –18
In the 2000 – 4000-cm⫺1 range, there were basically three bands to be considered. The rather broad band between 3300 and 3600 cm⫺1 probably consisted of a OOH (hydroxyl) stretching band, which is often re-ported between 3400 and 3500 cm⫺1, and NOH stretching vibrations, which occur around 3400 cm⫺1.16 –18The decrease in theOOH stretching
vibra-tions was attributed to the dehydration of secondary alcohols, which were formed during the cure reac-tions. However, it was very difficult to distinguish between the hydroxyl and amine bands.
Figure 5 DRIFT spectra for reference-group (untreated) test plates and test plates thermally loaded at 210, 220, 230, and 250°C. [Color figure can be viewed in the online issue, which is available at www.interscience.wiley.com.]
Figure 4 DRIFT spectra recorded for the heat-exposed (up-per) surface and opposite (lower) surface of a sample similar to the test panels used in this work. [Color figure can be viewed in the online issue, which is available at www. interscience.wiley.com.]
The other two bands of concern were due toOCH stretching vibrations occurring around 2900 and 3075 cm⫺1 and belonging to aliphatic and aromatic OCH functional groups, respectively.16 –18 Figure 4 shows
that theOCH band intensities decreased with an in-creasing thermal loading temperature. This decrease was mainly due to dehydration reactions and the re-moval of small molecular fragments from the system due to the breaking of intermolecular and intramolec-ular chains. There was a gradual decrease in theOCH concentration with an increasing thermal loading tem-perature.
Accordingly, the main degradation reactions occur-ring duoccur-ring the high-temperature loading of the IM7/ 8552 carbon– epoxy system can be summarized as fol-lows:
1. Oxidation could be monitored by the increasing OCAO (carbonyl) band integral area, which was in good agreement with the decreasing OCH bands. The phenyl ratio could also be accepted as a strong indicator of oxidation, and the intensity of the phenyl peaks decreased be-cause of a probable change in the structure of the aromatic ring,
2. Dehydration could be monitored by the de-crease in theOOH stretching band intensities.
Mechanochemical correlations
The room-temperature and 120°C ILSS loss variations with the carbonyl band integral, hydrocarbon band integral, and phenyl ratio between 180 and 250°C are plotted in Figure 3. A similar correlation between the room-temperature compressive strength and the car-bonyl band integral, hydrocarbon band integral, and phenyl ratio between 180 and 250°C is presented in Figure 6. The compressive strength value of the test panels thermally loaded at 260°C was discarded in the evaluation because of visual delamination observed in the test specimens. The standard deviations of the compressive and ILSS values were high for this group of tests plates. The compressive strength and ILSS decreased with an increasing carbonyl band integral, a decreasingOCH band integral, and a decreasing phe-nyl ratio.
Recalling the ultrasonic C-scan test results, which could detect heat damage almost above 250°C, we found that DRIFT was better for the assessment of incipient heat damage. The carbonyl band integral and phenyl ratio were two sensitive measures for detecting thermooxidative degradation in the DDS-cured TG-MDA carbon– epoxy system in the specified tempera-ture ranges, as also evidenced by their correlation coefficients. The trends observed for the OCH band integral showed that the hydrocarbon band integral was not as sensitive (a smaller correlation coefficient)
as the carbonyl band integral and phenyl ratio, but it could be used to comment on the degradation reac-tions taking place because of thermal loading.
CONCLUSIONS
In this study, three parameters (the carbonyl band integral, hydrocarbon band integral, and phenyl ra-tio), deduced from DRIFT spectra, were used to com-ment on the thermal degradation mechanisms in the IM7/8552 carbon– epoxy system.
Thermooxidative degradation was best monitored by an increase in the carbonyl band integral and a decrease in the phenyl ratio with an increase in the thermal loading temperature. The carbonyl band inte-gral stood out as a perfect indicator of the addition of oxygen as various carbonyl species such as amides. There was a decrease in the mechanical strength val-ues with an increasing carbonyl band integral and a decreasing phenyl ratio, and this revealed the extent of oxidation that took place because of thermal load-ing.
A phenyl algorithm indicating the decrease in the intensity of the phenyl bands was also shown to be a very good indicator of thermooxidative degradation and was sensitive to the early indications of oxidation before considerable strength loss occurred. The de-crease in the phenyl band intensity might have origi-nated from the disordering of the aromatic ring struc-ture.
The hydrocarbon band integral, though less sensi-tive than the carbonyl band integral and phenyl ratio, was another useful parameter for the prediction of the loss of mechanical strength. The decrease in the hy-drocarbon band integral could be attributed to the oxidation reaction, the breaking of the intermolecular and intramolecular chains in the backbone, and the removal of small molecular fragments due to in-creased activation energy in the system via heat expo-sure, which resulted in degraded mechanical proper-ties. The overlapping bands in the carbonyl region might also have originated from the double bonds occurring as a result of the dehydration reactions on the secondary alcohol groups. The decrease in the OOH band intensities was attributed to the dehydra-tion reacdehydra-tions occurring during thermal loading.
Therefore, two separate or combined degradation reactions, oxidation and dehydration, likely took place in the IM7/8552 DDS-cured TGMDA carbon– epoxy composites during thermal loading between 190 and 260°C.
DRIFTS was found to be more adequate in assessing incipient heat damage occurring on the molecular scale than ultrasonic nondestructive testing and to provide the possibility of commenting on degradation mechanisms, rather than making the prediction of the degradation of mechanical strength possible.
Mechan-ical strength degradation can be characterized for any structural component of an aircraft by DRIFTS, and a DRIFT instrument, being handy, portable, and light-weight, has potential in situ nondestructive applica-tions in the aircraft industry.
For establishing a better correlation between the mechanical test results and the DRIFT spectra, wider ranges of temperatures and exposure times for differ-ent graphite– epoxy systems need to be tested and reevaluated along with the results of this study.
The authors thank Besim Gokce Dara from Roketsan Mis-siles, Inc., for assistance and discussions. Roketsan MisMis-siles, Inc., Turkish Aerospace Industries, and European Aircraft Defence and Space Co. (EADS) are gratefully acknowledged for materials and experimental support. The authors also thank Detlef Weisgerber from EADS Germany for guidance and valuable advice.
References
1. Patel, R. H.; Patel, R. G. Polym Int 1993, 30, 301.
2. Pering, G. A.; Farrell, P. V.; Springer, G. S. J Compos Mater 1980, 14, 54.
3. Matzkanin, G. A. Proceedings of the Conference on the Char-acterization and NDE of Heat Damage in Graphite Epoxy Com-posites, Orlando, FL; NTIAC: Austin, TX, 1993; p 9.
4. Collins, R.; Mahon, J. Proceedings of the Conference on the Characterization and NDE of Heat Damage in Graphite Epoxy Composites, Orlando, FL; NTIAC: Austin, TX, 1993; p 53. 5. Janke, C. J.; Wachter, E. A.; Philpot, H. E.; Powell, G. L.
Pro-ceedings of the Conference on the Characterization and NDE of Heat Damage in Graphite Epoxy Composites, Orlando, FL; NTIAC: Austin, TX, 1993; p 77.
6. Powell, G. L.; Symrl, N. R.; Janke, C. J.; Wachter, E. A.; Lucania, J.; Milosevic, M.; Auth, G. Proceedings of the Conference on the Characterization and NDE of Heat Damage in Graphite Epoxy Composites, Orlando, FL; NTIAC: Austin, TX, 1993; p 97. 7. Henderson, J. B.; Wiecek, T. E. J Compos Mater 1987, 21, 741.
Figure 6 Variation of the compressive strength loss at room temperature (RT) with the thermal loading temperature, carbonyl band integral, phenyl ratio, and hydrocarbon band integral.
8. Cole, K. C.; Pilon, A.; Noel, D.; Hechler, J. J.; Chouliotis, A.; Overburry, K. C. Appl Spectrosc 1988, 42,761.
9. Mitchell, M. B. Fundamentals and Applications of Diffuse Re-flectance Infrared Fourier Transform (DRIFT) Spectroscopy, Structure Property Relations in Polymers; American Chemical Society: Washington, DC, 1993; p 351.
10. Daˆra, I. H. Ph.D. Thesis, Middle East Technical University, 2002. 11. Engineering Materials Handbook; ASM International:
Colum-bus, OH, 1988; Volume 1.
12. Levy, R. L.; Fanter, D. L.; Summers, C. J. J Appl Polym Sci 1979, 24, 1643.
13. Luoma, G. A.; Rowland, R. D. J Appl Polym Sci 1986, 32, 5777. 14. Powell, L.; Janke, C. J.; Barber, T. E. Presented at the 29th International SAMPE Technical Conference, Orlando, FL, 1997. 15. Daˆra, B. G. Ph.D. Thesis, Middle East Technical University, 2001. 16. Smith, B. Infrared Spectral Interpretation: A Systematic
Ap-proach; CRC: Washington, DC, 1999.
17. Holst, G. C. Testing and Evaluation of Infrared Imaging Sys-tems, 2nd ed.; Winterpark: Bellingham, WA, 1998.
18. Stuart, B. Modern Infrared Spectroscopy, Analytical Chemistry by Open Learning; Wiley: Greenwich, England, 1996.