Published by the Polish Society for Horticultural Science since 1989 Folia Hort. 32(1) (2020): 69–78
http://www.foliahort.ogr.ur.krakow.pl
RESEARCH ARTICLE Open access
H
orticulturae
DOI: 10.2478/fhort-2020-0007
Morphological and biochemical diversity among
wild-grown carob trees (Ceratonia siliqua L.)
Nazan Korkmaz
1, Meleksen Akin
2,*, Aysen Koc
3, Sadiye Peral Eyduran
2,
Gulce Ilhan
4, Halil Ibrahim Sagbas
4, Sezai Ercisli
41 Department of Plant and Animal Production, Ortaca Vocational School, Mugla Sitki Kocman University, 48600 Ortaca, Mugla, Turkey 2 Department of Horticulture, Agricultural Faculty, Igdir University, 76200 Igdir, Turkey 3 Department of Horticulture, Agricultural and Natural Science Faculty, Bozok University, 66200 Yozgat, Turkey 4 Department of Horticulture, Agricultural Faculty, Atatürk University, 25240 Erzurum, Turkey
ABSTRACT
Tree, leaf, pod and seed morphology, as well as pod biochemistry of 36 wild-grown carob genotypes sampled from rural areas in Marmaris district located at western Turkey, were investigated. Leaf and pod dimensions, pod and seed weight, seed ratio, pod and seed colour and shape and surface traits were investigated. Soluble solid content (SSC), titratable acidity, vitamin C and protein and dietary fibre contents were also detected. Results showed significant differences for all quantitative traits, although differences are more pronounced for some pod (weight, width, length and thickness) and seed characteristics (weight, dimensions and ratio). Pod and seed colour, shape and surface qualitative threats were found to be quite variable among genotypes. The majority of genotypes had an open tree growth habit. Leaf length and width were found to be between 8.04 cm (M19) and 11.60 cm (M12) and 8.40 cm (M2) and 12.04 cm (M12) among genotypes. Pod weight ranged from 8.3 g (M35) to 29.5 g (M3) in the wild genotypes. The average pod dimensions (width, length and thickness) were between 14.27 and 23.38 mm, 12.54 and 21.67 cm and 4.80 and 8.37 mm, respectively. The SSC ranged from 49.36 to 69.36% in the pods of wild carob genotypes. The results of this study indicate a good genetic resource potential of Turkish wild carob populations for future breeding programmes.
Keywords: crop wild relatives, genetic diversity, pod dimensions, soluble solid content, vitamin C
*Corresponding author.
e-mail: [email protected] (Meleksen Akin)
INTRODUCTION
Plant genetic resources include cultivars, landraces, unnamed genotypes, accessions, wild species closely related to cultivated varieties, breeder’s elite lines and mutants. The loss of genetic diversity caused by the practice of agriculture and the availability of genetic information has resulted in a great effort dedicated to the study and collection of plant genetic resources (Kafkas et al., 2008; Ercisli et al., 2011; Van et al., 2011; Zia-Ul-Haq et al., 2014; Eyduran et al., 2015; Akin et al., 2016). In the last 30 years, the importance of plant genetic resources has become more evident as a result of growing concerns about biodiversity, conservation and genetic erosion. Global food production and food
security are still a major challenge for the future of mankind. Therefore, securing plant genetic resources for future generations has become a priority not only in developing countries but also throughout the world (Sahin et al., 2002; Altindag et al., 2006; Gepts, 2006; Ercisli et al., 2008; Kafkas et al., 2018).
The characterisation of fruit genetic resources by analysing plant morphology is the simplest and easiest approach (Ercisli et al., 2012: Butiuc-Keul et al., 2019; Fazenda et al., 2019). Because morphological markers, such as growth habit, fruit and seed colour, fruit and seed weight, fruit and seed shape, harvest dates, taste, plant height, disease response, and so on, are scored visually.
All those traits are generally scored quickly, simply and without laboratory equipment (Bhat et al., 2010).
Three phytogeographical regions, such as Euro-Siberian, Mediterranean and Irano-Turanian, overlap in Turkey. Euro-Siberian region stretches along most of North Anatolia and Europe. Historically, Turkey has been a pathway for many civilisations and hosted many of them. The movement of communities has contributed to the enrichment of genetic diversity by transferring mainly the cultivated species and the seeds of wild plants from one place to another (Ercisli, 2004; Halasz et al., 2010). The topography of Turkey exhibits significant variety where ecological factors change frequently over a short distance. Asian section is a large, roughly rectangular peninsula situated like a bridge between Europe and Asia.
Carob tree (Ceratonia siliqua L.) is one of the oldest trees in the world and has been grown since ancient times in most Mediterranean basin countries, and it has an important value from an economic and environmental point of view. The species is a flowering evergreen shrub and it is popular for its sweet edible pods. The carob tree can be found growing extensively in the wild of the Eastern Mediterranean region. Its fruits are legumes commonly referred to as pods that are elongated, compressed or curved (Batlle and Tous, 1997). Carob pods have active constituents, which include calcium, phosphorus, potassium, sodium and magnesium. The carob fruit is rich in proteins, carbohydrates and fibres. The combination of these compounds provides relatively high nutritional values leading to the claimed health benefits of carob (Turhan et al., 2006; Tous et al., 2009; Gezer, 2018).
The main carob producer in the world is Spain followed by Italy, Portugal, Greece, Morocco and Turkey. Turkey shares approximately 10% of the carob production in the world (FAO, 2018). Turkey has a rich natural carob population obtained from seeds, and trees
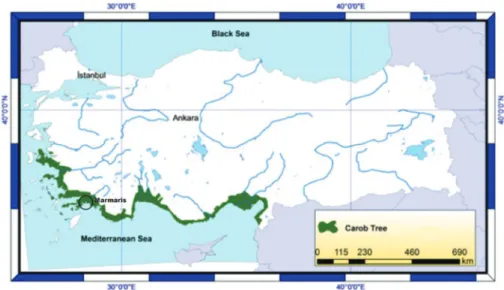
thrive together with several other species of the maquis in the Mediterranean and Aegean regions. Carob has been a neglected species and accepted forest tree in Turkey. The country does not have commercial carob orchards, although some new ones have recently been established. Wild carob trees show great diversity and concentrate along the Mediterranean and Aegean regions (Figure 1) (Pazir and Alper, 2018; Durmaz and Ozel, 2019).
In Turkey, particularly in the Aegean region, carob production is still carried out using seed-propagated genotypes. Thus, in the market, carob fruits are composed of very mixed trees. Therefore, carob industry and consumers experience certain difficulties in obtaining products of standard quality. It is necessary to conduct further breeding studies using different seed-propagated carob trees and select them to increase yield and quality. The success of a breeding programme depends mainly on sound information about the breeding material.
To our knowledge, no studies are reporting morphological and biochemical analysis of seed-propagated carobs grown in the Aegean region of Turkey. Therefore, this study aimed to characterise and evaluate the diversity of 36 seed-propagated carob genotypes and develop strategies for preserving the endangered genetic resources of this species.
MATERIALS AND METHODS
A total of 36 seed-propagated wild-grown carob genotypes were used, and mature pods were collected from rural areas of Marmaris district between 2016 and 2017 (Figure 1). A total of 30 pods from each genotype were randomly chosen to measure the different parameters. The morphological parameters determined were tree growth habit, leaf width, leaf length, number of leaflets/leave, pod colour, pod shape, pod surface, pod weight, pod width, pod length, pod thickness, seed colour, seed shape, seed surface, seed weight and seed
Figure 1. Natural distribution of carob trees in Turkey and our sampling location (Marmaris district) (Sahin and Tasligil, 2016).
ratio. Quantitative measurements were done using a calliper with a precision of ± 0.1 mm and an electronic balance (SCALTEC SBA33, Heiligenstadt, Germany). The dimensions of pod, seed and leaf were measured using a digital calliper. Biochemical parameters were soluble solid content (SSC), titratable acidity, vitamin C, protein and dietary fibre contents. Seed ratio was calculated using whole pod and seed weight. For chemical analysis, pulps were crushed with a blender (Philips Hr2653/90 Viva Collection Promix, The Netherlands) and then passed through a 35-mesh sieve. About 10 g of pulp was introduced with 40 ml water in a baker and homogenised in a homogeniser (IKA, Deutschland) for 5 min. SSC of samples was measured at 25 ± 0.5 °C using a refractometer (KEM, Kyoto, Japan). Titratable acidity was determined by titration with 0.1 N NaOH and calculated as % citric acid (anhydrous) (AOAC, 2007). Vitamin C was determined by RQFlex (Merc Co, Darmstadt, Germany). Total nitrogen of carob powder was determined according to the AOAC official method and was converted to protein content using the conversion factor 6.25 (AOAC, 2007) with Macro Kjeldahl digestion and distillation apparatus. For dietary fibre analysis, 4 g of carob powder were digested with 200 ml of 5% HCL for 30 min. The mixture was filtered and washed with hot water. Then, the residue was digested with 200 ml of 5% NaOH under reflux for 30 min. The mixture was filtered and washed with distilled water until pH neutrality. The material was washed with 20 ml ethyl alcohol and 20 ml ethyl ether. Finally, the residue was dried at 100 °C for 2 h, and the residual mass was considered as fibres (De Padua et al., 2004). Protein and fibre contents were expressed as %.
Statistical analysis
No differences were found between years thus, the data of both years were pooled. All data were analysed using SPSS software and procedures. Tables of analysis of variance were constructed using the least significant difference (LSD) method at p < 0.05. The principal coordinate analysis (PCoA) was performed to show the relationships and differentiation of the carob genotypes in a three-dimensional array of eigenvectors using the DCENTER and EIGEN modules of NTSYS-pc 2.10e software.
RESULTS AND DISCUSSION
Morphological analysis of carob leaf, pod and seed quantitative traits revealed significant variations among genotypes. Qualitative traits (colour, shape and surface aspect of pods and seeds) also showed variation among genotypes (Tables 1–3).
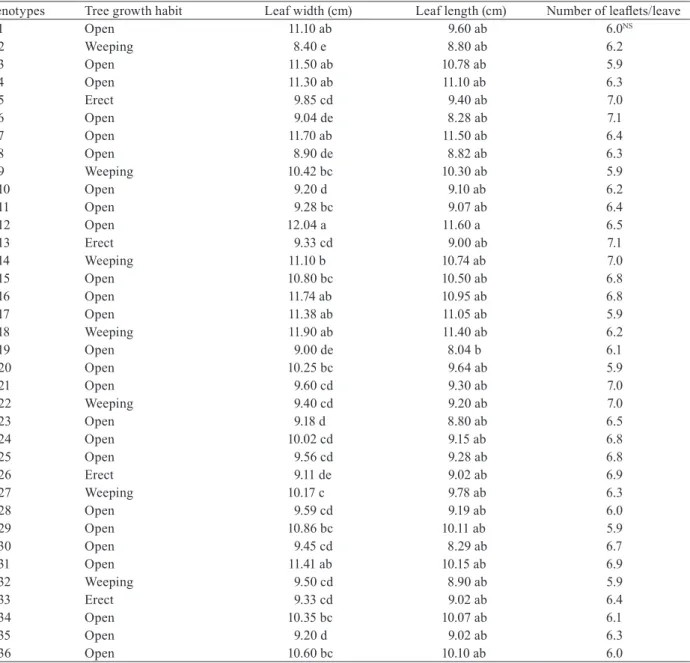
The genotypes exhibited three tree growth habits, such as open, weeping and erect, and among them open growth habit was dominant followed by weeping (Table 1). Batlle and Tous (1997) reported that open growth habit was dominant among carob cultivars from
Spain, Italy, Portugal, Greece, Tunisia and the USA followed by weeping growth habit.
The genotypes differed from each other statistically (p < 0.05) in terms of leaf width and length. However, the number of leaflets/leave was non-significant (Table 1). Leaf width and length were ranged from 8.40 cm (M2) to 12.04 cm (M12) and from 8.04 cm (M19) to 11.60 cm (M12), respectively (Table 1). The number of leaflets/ leave was insignificant among carob genotypes and was found between 5.9 and 7.1. In the literature, there was a limited report about leaf dimensions of carob because most of the morphological studies are concentrated on pod and seed characteristics. Ahmed et al. (2019) found leaf width and leaf length of carobs in Morocco between 9.53 and 10.77 cm and 10.19 and 11.45 cm, respectively. They also reported the number of leaflets per leave between 6.5 and 7.4 indicating similarities with our study.
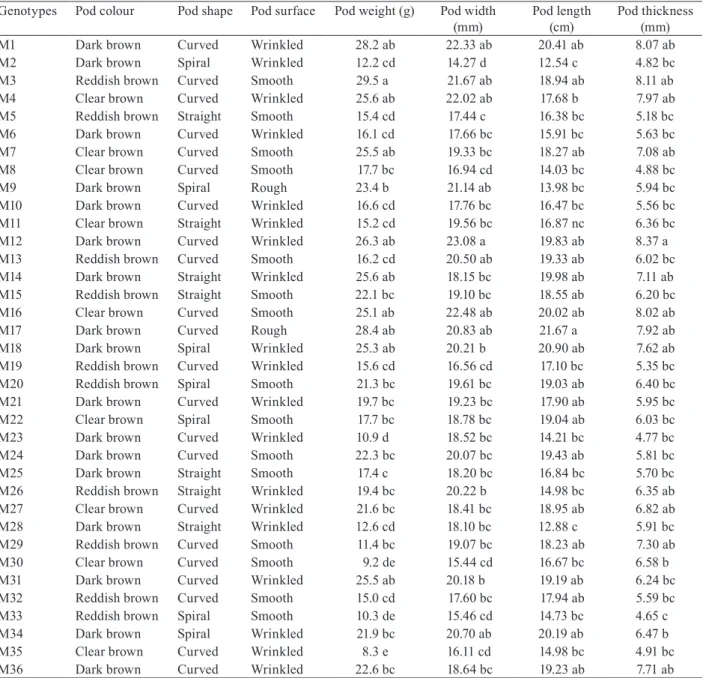
Pod characteristics (colour, shape, surface, weight, width, length and thickness) are provided in Table 2.
The majority of genotypes had dark-brown pod colour (47.22%) followed by reddish brown (27.78%) and clear brown (25.00%). Dark-brown, clear-brown and reddish-brown pod colours were previously reported in carob cultivars and genotypes (Batlle and Tous, 1997; Ait Chitt et al., 2007). Curved pod shape was dominant (61.11%) among genotypes followed by equally spiral and straight shape (19.44%). Batlle and Tous (1997) reported a curved, spiral and straight pod shape among carob cultivars and genotypes, which is in accordance with our study. In terms of pod surface, 19 genotypes had a wrinkled surface (52.78%) followed by 15 genotypes with a smooth surface (41.67%) and 2 genotypes with a rough surface (5.56%) (Table 2). Batlle and Tous (1997) reported that the pod surface varied from smooth to wrinkled in carobs.
Pod weight and pod dimensions (width, length, length and thickness) are shown in Table 2, and we found statistically significant differences among genotypes (p < 0.05) for pod weight, pod width, pod length and pod thickness.
Pod weight of 36 carob genotypes was quite variable and ranged from 8.3 g (M35) to 29.5 g (M3) among genotypes. The average pod dimensions (width, length and thickness) were found between 14.27 and 23.38 mm, 12.54 and 21.67 cm and 4.80–8.37 mm for the wild genotypes (Table 2). La Malfa et al. (2012) investigated morphological and technological characteristics of eight carob cultivars grown in Sicily, Italy, and reported average pod weight, pod width, pod length and pod thickness as 13.7–33.4 g, 19.3–26.8 mm, 14.9–22.9 cm and 6.8–14.0 mm, respectively. In Algeria, a study examined wild-grown carobs in 10 regions and reported average pod weight, pod width, pod length and pod thickness as 7.04–30.57 g, 18.10–31.80 mm, 10.30–18.75 cm and 4.50–8.20 mm, respectively (Boublenza et al., 2019). Barracosa et al. (2007) stated pod weight, pod width, pod length and pod thickness of 15 carob cultivars from Portugal as 13.20–26.39 g;
16.16–23.38 mm; 12.95–20.35 cm and 7.19–10.86 mm, respectively. Albanell et al. (1991) reported the highest pod weight (14.88 g), pod length (15.83 cm) and pod width (21.10 mm) among 182 common carob trees from various areas in Spain. Haddarah et al. (2013) reported pod weight (8.93–36.85 g), pod length (11.42–24.25 cm), pod width (17.30–27.40 mm) and pod thickness (4.8– 9.2 mm) among wild carob genotypes in Lebanon. Russo and Polignano (1996) found mean pod length and width as 17.1 cm and 22.7 mm, respectively. Gharnit et al. (2006) reported average pod length, width and thickness as 13.5 cm, 19.5 mm and 6.9 mm in Morocco. Our results are in good agreement with the aforementioned studies. The main selection criteria in carobs have traditionally focussed on large pod size, high pulp and sugar content. Carob pod size is also important to withstand strong
winds during spring to prevent premature fruit drop (Batlle and Tous, 1997).
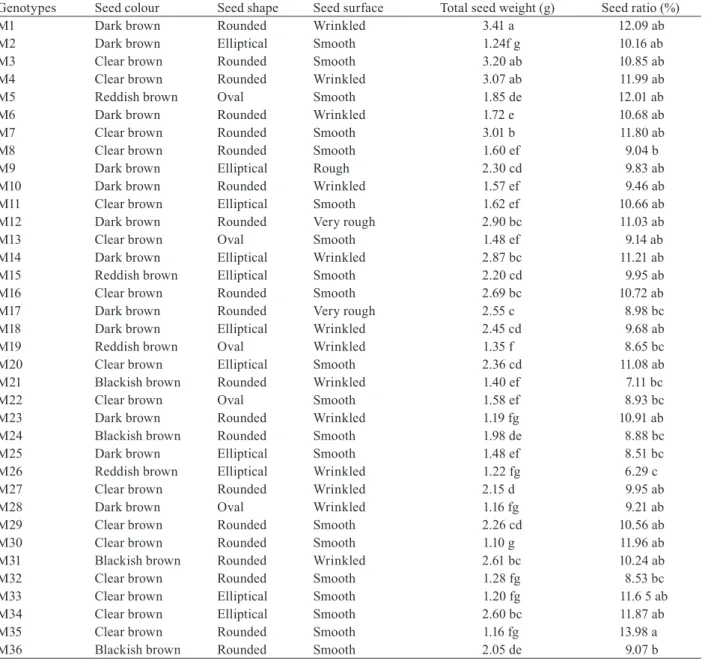
Seed colour, seed shape, seed surface, total seed weight and seed ratio are shown in Table 3. Most of the genotypes had clear-brown pod colour (44.4%) followed by dark brown (33.3%), reddish brown (11.1%) and blackish brown (11.1%). Rounded pod shape was dominant (55.5%) among genotypes followed by elliptical (30.5%) and oval seed shape (13.8%). In terms of seed surface, 55.5% of the genotypes had smooth seed surface, 36.1% of the genotypes had wrinkled surface, 5.55% of the genotypes had very rough and 2.77% of the genotypes had rough seed surface (Table 3). Albanell et al. (1991) and Batlle and Tous (1997) reported that the majority of carob seeds had a smooth seed surface.
Table 1. Tree and leaf characteristics of carob genotypes
Genotypes Tree growth habit Leaf width (cm) Leaf length (cm) Number of leaflets/leave
M1 Open 11.10 ab 9.60 ab 6.0NS M2 Weeping 8.40 e 8.80 ab 6.2 M3 Open 11.50 ab 10.78 ab 5.9 M4 Open 11.30 ab 11.10 ab 6.3 M5 Erect 9.85 cd 9.40 ab 7.0 M6 Open 9.04 de 8.28 ab 7.1 M7 Open 11.70 ab 11.50 ab 6.4 M8 Open 8.90 de 8.82 ab 6.3 M9 Weeping 10.42 bc 10.30 ab 5.9 M10 Open 9.20 d 9.10 ab 6.2 M11 Open 9.28 bc 9.07 ab 6.4 M12 Open 12.04 a 11.60 a 6.5 M13 Erect 9.33 cd 9.00 ab 7.1 M14 Weeping 11.10 b 10.74 ab 7.0 M15 Open 10.80 bc 10.50 ab 6.8 M16 Open 11.74 ab 10.95 ab 6.8 M17 Open 11.38 ab 11.05 ab 5.9 M18 Weeping 11.90 ab 11.40 ab 6.2 M19 Open 9.00 de 8.04 b 6.1 M20 Open 10.25 bc 9.64 ab 5.9 M21 Open 9.60 cd 9.30 ab 7.0 M22 Weeping 9.40 cd 9.20 ab 7.0 M23 Open 9.18 d 8.80 ab 6.5 M24 Open 10.02 cd 9.15 ab 6.8 M25 Open 9.56 cd 9.28 ab 6.8 M26 Erect 9.11 de 9.02 ab 6.9 M27 Weeping 10.17 c 9.78 ab 6.3 M28 Open 9.59 cd 9.19 ab 6.0 M29 Open 10.86 bc 10.11 ab 5.9 M30 Open 9.45 cd 8.29 ab 6.7 M31 Open 11.41 ab 10.15 ab 6.9 M32 Weeping 9.50 cd 8.90 ab 5.9 M33 Erect 9.33 cd 9.02 ab 6.4 M34 Open 10.35 bc 10.07 ab 6.1 M35 Open 9.20 d 9.02 ab 6.3 M36 Open 10.60 bc 10.10 ab 6.0
Means with different letters in the same column differ significantly (p < 0.05). NS, Non-significant.
Table 2. Pod characteristics of carob genotypes
Genotypes Pod colour Pod shape Pod surface Pod weight (g) Pod width
(mm) Pod length (cm) Pod thickness (mm) M1 Dark brown Curved Wrinkled 28.2 ab 22.33 ab 20.41 ab 8.07 ab M2 Dark brown Spiral Wrinkled 12.2 cd 14.27 d 12.54 c 4.82 bc M3 Reddish brown Curved Smooth 29.5 a 21.67 ab 18.94 ab 8.11 ab M4 Clear brown Curved Wrinkled 25.6 ab 22.02 ab 17.68 b 7.97 ab M5 Reddish brown Straight Smooth 15.4 cd 17.44 c 16.38 bc 5.18 bc M6 Dark brown Curved Wrinkled 16.1 cd 17.66 bc 15.91 bc 5.63 bc M7 Clear brown Curved Smooth 25.5 ab 19.33 bc 18.27 ab 7.08 ab M8 Clear brown Curved Smooth 17.7 bc 16.94 cd 14.03 bc 4.88 bc
M9 Dark brown Spiral Rough 23.4 b 21.14 ab 13.98 bc 5.94 bc
M10 Dark brown Curved Wrinkled 16.6 cd 17.76 bc 16.47 bc 5.56 bc M11 Clear brown Straight Wrinkled 15.2 cd 19.56 bc 16.87 nc 6.36 bc M12 Dark brown Curved Wrinkled 26.3 ab 23.08 a 19.83 ab 8.37 a M13 Reddish brown Curved Smooth 16.2 cd 20.50 ab 19.33 ab 6.02 bc M14 Dark brown Straight Wrinkled 25.6 ab 18.15 bc 19.98 ab 7.11 ab M15 Reddish brown Straight Smooth 22.1 bc 19.10 bc 18.55 ab 6.20 bc M16 Clear brown Curved Smooth 25.1 ab 22.48 ab 20.02 ab 8.02 ab
M17 Dark brown Curved Rough 28.4 ab 20.83 ab 21.67 a 7.92 ab
M18 Dark brown Spiral Wrinkled 25.3 ab 20.21 b 20.90 ab 7.62 ab M19 Reddish brown Curved Wrinkled 15.6 cd 16.56 cd 17.10 bc 5.35 bc M20 Reddish brown Spiral Smooth 21.3 bc 19.61 bc 19.03 ab 6.40 bc M21 Dark brown Curved Wrinkled 19.7 bc 19.23 bc 17.90 ab 5.95 bc M22 Clear brown Spiral Smooth 17.7 bc 18.78 bc 19.04 ab 6.03 bc M23 Dark brown Curved Wrinkled 10.9 d 18.52 bc 14.21 bc 4.77 bc M24 Dark brown Curved Smooth 22.3 bc 20.07 bc 19.43 ab 5.81 bc M25 Dark brown Straight Smooth 17.4 c 18.20 bc 16.84 bc 5.70 bc M26 Reddish brown Straight Wrinkled 19.4 bc 20.22 b 14.98 bc 6.35 ab M27 Clear brown Curved Wrinkled 21.6 bc 18.41 bc 18.95 ab 6.82 ab M28 Dark brown Straight Wrinkled 12.6 cd 18.10 bc 12.88 c 5.91 bc M29 Reddish brown Curved Smooth 11.4 bc 19.07 bc 18.23 ab 7.30 ab M30 Clear brown Curved Smooth 9.2 de 15.44 cd 16.67 bc 6.58 b M31 Dark brown Curved Wrinkled 25.5 ab 20.18 b 19.19 ab 6.24 bc M32 Reddish brown Curved Smooth 15.0 cd 17.60 bc 17.94 ab 5.59 bc M33 Reddish brown Spiral Smooth 10.3 de 15.46 cd 14.73 bc 4.65 c M34 Dark brown Spiral Wrinkled 21.9 bc 20.70 ab 20.19 ab 6.47 b M35 Clear brown Curved Wrinkled 8.3 e 16.11 cd 14.98 bc 4.91 bc M36 Dark brown Curved Wrinkled 22.6 bc 18.64 bc 19.23 ab 7.71 ab
Means with different letters in the same column differ significantly (p < 0.05).
There were statistically significant differences (p < 0.05) among genotypes in terms of total seed weight and seed ratio (%) (Table 3). The highest total seed weight was observed in M1 genotype as 3.41 g, followed by M3 as 3.20 g and M4 as 3.07 g, while the lowest total seed weight was obtained from M30 genotype as 1.10 g (Table 3). The seed ratio was found between 6.29% (M26) and 13.98% (M35) (Table 3). La Malfa et al. (2012) reported total seed weight and seed ratio between 1.57 and 2.34 g and 4.9 and 16.9%, respectively. Barracosa et al. (2007) stated the total seed weight among 15 carob cultivars in Portugal as 1.83–2.99 g. Boublenza et al. (2019) investigated carobs from Algeria and determined the total seed weight and seed ratio as 0.98–2.30 g and 7.35–14.58%, respectively. Albanell et al. (1991) reported seed ratio (12.11%) among 182 common carob trees from various areas in Spain.
Haddarah et al. (2013) reported total seed weight (1.36– 3.10 g) and seed ratio (8.41–20.10%) among wild carob genotypes in Lebanon. Gharnit et al. (2006) reported average total seed weight and seed ratio between 1.88 and 28 g and 16.6 and 22.0% in Morocco. These studies indicate similarities with our results.
The biochemical characteristics of carob genotypes fruits are shown in Table 4. SSC, titratable acidity, protein and dietary fibre contents differed significantly among genotypes (p < 0.05). However, no differences were found among genotypes in terms of vitamin C (Table 4).
The highest SSC content was seen in genotype M12 as 69.36% followed by M3 (68.41%) and M7 (68.23%), while the lowest SSC content was obtained from M23 genotype as 49.36% (Table 4). Titratable acidity and vitamin C were less variable than SSC and ranged from
Table 3. Seed characteristics of carob genotypes
Genotypes Seed colour Seed shape Seed surface Total seed weight (g) Seed ratio (%)
M1 Dark brown Rounded Wrinkled 3.41 a 12.09 ab
M2 Dark brown Elliptical Smooth 1.24f g 10.16 ab
M3 Clear brown Rounded Smooth 3.20 ab 10.85 ab
M4 Clear brown Rounded Wrinkled 3.07 ab 11.99 ab
M5 Reddish brown Oval Smooth 1.85 de 12.01 ab
M6 Dark brown Rounded Wrinkled 1.72 e 10.68 ab
M7 Clear brown Rounded Smooth 3.01 b 11.80 ab
M8 Clear brown Rounded Smooth 1.60 ef 9.04 b
M9 Dark brown Elliptical Rough 2.30 cd 9.83 ab
M10 Dark brown Rounded Wrinkled 1.57 ef 9.46 ab
M11 Clear brown Elliptical Smooth 1.62 ef 10.66 ab
M12 Dark brown Rounded Very rough 2.90 bc 11.03 ab
M13 Clear brown Oval Smooth 1.48 ef 9.14 ab
M14 Dark brown Elliptical Wrinkled 2.87 bc 11.21 ab
M15 Reddish brown Elliptical Smooth 2.20 cd 9.95 ab
M16 Clear brown Rounded Smooth 2.69 bc 10.72 ab
M17 Dark brown Rounded Very rough 2.55 c 8.98 bc
M18 Dark brown Elliptical Wrinkled 2.45 cd 9.68 ab
M19 Reddish brown Oval Wrinkled 1.35 f 8.65 bc
M20 Clear brown Elliptical Smooth 2.36 cd 11.08 ab
M21 Blackish brown Rounded Wrinkled 1.40 ef 7.11 bc
M22 Clear brown Oval Smooth 1.58 ef 8.93 bc
M23 Dark brown Rounded Wrinkled 1.19 fg 10.91 ab
M24 Blackish brown Rounded Smooth 1.98 de 8.88 bc
M25 Dark brown Elliptical Smooth 1.48 ef 8.51 bc
M26 Reddish brown Elliptical Wrinkled 1.22 fg 6.29 c
M27 Clear brown Rounded Wrinkled 2.15 d 9.95 ab
M28 Dark brown Oval Wrinkled 1.16 fg 9.21 ab
M29 Clear brown Rounded Smooth 2.26 cd 10.56 ab
M30 Clear brown Rounded Smooth 1.10 g 11.96 ab
M31 Blackish brown Rounded Wrinkled 2.61 bc 10.24 ab
M32 Clear brown Rounded Smooth 1.28 fg 8.53 bc
M33 Clear brown Elliptical Smooth 1.20 fg 11.6 5 ab
M34 Clear brown Elliptical Smooth 2.60 bc 11.87 ab
M35 Clear brown Rounded Smooth 1.16 fg 13.98 a
M36 Blackish brown Rounded Smooth 2.05 de 9.07 b
Means with different letters in the same column differ significantly (p < 0.05).
0.45% (M13) to 1.12% (M9) and from 5.9 mg ∙ 100 g−1
(M19 and M22) to 10.2 mg ∙ 100 g−1 (M12), respectively
(Table 4). SSC values of carob genotypes have been reported to be between 32 and 70% (Marakis et al., 1988).
Protein and dietary fibre contents were found between 3.73% (M6) and 6.95% (M12) and 4.9% (M11 and M17) and 7.7% (M3), respectively (Table 4). Haddarah et al. (2013) reported protein content between 3.61 and 4.82% and dietary fibre content between 4.80 and 7.74% among wild carob genotypes in Lebanon. Ozcan et al. (2007) found that carob pods had 4.71% protein content and 9.69% crude fibre content.
The study showed variation among wild carob populations for leaf, pod and seed morphology. In the perspective of identifying the best genotypes for breeding programmes and/or accession collection, additional descriptors should be examined such as regular bearing
(Keles and Bilir, 2015); gender and harvest period or fruit ripening (Tous et al., 2009), pedicel length as a criterion of pod abscission (Tous et al., 2009); trunk cross-section and canopy volume (Tous et al., 2009), fruit sweetness, flowering and fruiting phenology and precocity (Haddarah et al., 2013).
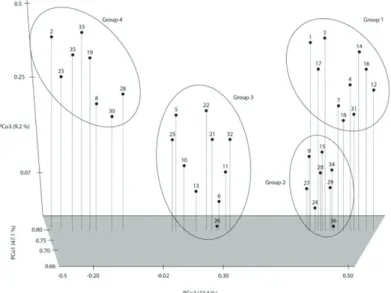
PCoA was applied to the data using NTSYS 2.10e software, and the contribution rates of the first three principal coordinates were 47.1, 22.4 and 9.2%, respectively, accounting for 78.7% of the variance. The first principal coordinate (PCoA1), which explains 47.1% of the overall variance, is identified with the pod weight, pulp weight and seed weight, while the second principal coordinate (PCoA2) is related to the leaf and leaflet dimensions, pod length and pulp and seed ratio (Table 5). Carob genotypes samples were partitioned into four distinct groups. PCoA Groups 1, 2, 3 and 4 included 10, 8, 10 and 8 samples, respectively
(Figure 2). The first group characterised by high pod and seed weight, larger and longer leaves, high seed size and high SSC content. The second and third groups had medium-sized leaves, pods and seeds and medium sugar content. The last group had lower pod and seed weight, low leaf dimensions and low sugar content. PCoA revealed useful information on the characterisation and comparison of carob germplasm collections in terms of morphological and biochemical data. At the same time, PCoA indicated some common features of wild carob genotypes, thanks to which it is possible to divide the analysed wild carobs into bigger fruited ones, more sweet ones, or those with a higher content of pulp and seed ratio. The substantial dispersion of Turkish wild carob genotypes in the PCoA plot suggests a high level of diversity, which can make them attractive for future Table 4. Biochemical characteristics of carob pods
Genotypes SSC (%) Acidity (%) Vitamin C (mg ∙ 100 g–1) Protein (%) Dietary fibres (%)
M1 67.21 ab 0.76 bc 10.1NS 3.88 bc 7.0 b M2 53.12 d 0.88 ab 9.3 6.50 ab 6.0 cd M3 68.41 ab 0.60 bc 8.3 4.77 bc 7.7 a M4 65.45 ab 0.80 bc 9.4 4.59 bc 5.8 cd M5 59.56 c 0.68 bc 7.6 5.25 bc 5.5 de M6 57.23 cd 0.55 bc 9.8 3.73 c 5.0 de M7 68.23 ab 0.92 ab 7.1 5.40 ab 6.8 bc M8 54.14 cd 0.85 b 7.5 5.04 bc 6.3 c M9 64.11 b 1.12 a 7.6 4.94 bc 6.1 cd M10 58.28 cd 1.02 ab 8.0 3.96 bc 5.0 de M11 57.45 cd 1.05 ab 6.6 4.11 bc 4.9 e M12 69.36 a 0.55 bc 10.2 6.95 a 5.3 de M13 59.98 bc 0.45 c 9.4 4.20 bc 6.6 bc M14 67.56 ab 0.78 bc 8.7 5.35 b 5.8 cd M15 63.44 bc 0.83 b 7.6 4.30 bc 5.3 de M16 65.45 ab 0.90 ab 7.5 4.22 bc 5.6 d M17 68.22 ab 0.66 bc 8.0 6.02 ab 4.9 e M18 66.44 ab 0.59 bc 8.4 6.18 ab 5.0 de M19 51.56 de 0.62 bc 5.9 5.44 ab 5.3 de M20 63.30 bc 0.75 bc 6.2 5.50 ab 7.1 ab M21 58.12 cd 0.84 b 5.8 4.33 bc 5.4 de M22 57.64 cd 0.90 ab 5.9 5.10 bc 5.7 cd M23 49.36 e 1.00 ab 7.1 4.60 bc 7.0 b M24 62.55 bc 1.05 ab 7.7 4.11 bc 5.9 cd M25 56.35 cd 0.96 ab 8.5 4.70 bc 5.6 d M26 55.83 cd 0.92 ab 9.2 4.15 bc 6.4 bc M27 63.13 bc 0.71 bc 7.4 6.44 ab 7.0 b M28 52.35 de 0.77 bc 8.1 5.33 b 6.2 cd M29 61.21 bc 0.84 b 7.7 5.30 b 5.0 de M30 50.45 de 0.55 bc 6.8 5.04 bc 5.5 de M31 67.40 ab 0.80 bc 7.3 4.27 bc 7.4 ab M32 51.80 de 0.93 ab 6.4 4.41 bc 6.4 bc M33 49.74 de 0.76 bc 7.7 4.50 bc 6.0 cd M34 60.80 bc 0.64 bc 8.2 4.90 bc 5.8 cd M35 49.56 de 0.68 bc 8.0 3.95 bc 5.4 de M36 62.26 bc 0.91 ab 7.5 4.44 bc 5.0 de
Means with different letters in the same column differ significantly (p < 0.05). NS, Non-significant.
breeding programmes and long-term conservation strategies.
CONCLUSION
Our findings showed that morphological characteristics and biochemical composition were considerably influenced by the genotype factor. Even though such variation did not seem to be geographically structured because all genotypes are from similar ecological and soil conditions, and the analysed traits could be considered under an agronomic and an industrial perspective (seed yield and pulp weight). Such descriptors, together with additional ones, would contribute to the characterisation of carob genetic resources and guide the choice of populations for in situ conservation or be a source of
material for restoration, breeding programmes and germplasm collections.
FUNDING
This study was supported by Atatürk University, Erzurum, Turkey.
AUTHOR CONTRIBUTIONS
N.K. and S.E. designed the study and performed the field work. M.A. and S.P.E. was involved in the statistical analysis. A.K., G.I. and H.I.S performed the laboratory study. All authors contributed to data analysis, discussion of results and the writing and editing of the manuscript.
CONFLICT OF INTEREST
The authors declare that there are no potential conflicts of interest regarding the research, authorship and publication of this manuscript.
REFERENCES
Ahmed, E. B., Adil, E., AbderAhmAn, M., lAhcen, H.,
And Ali, M. (2019). Characterization of carob
trees suggests high morphological variability in populations of the Middle Atlas Region, Morocco: Towards use of carob germplasm in breeding program. International Journal of Pure & Applied
Bioscience, 7(1), 22–34.
Ait chitt, A., belmir, H., And lAzrAk, A. (2007).
Production des plants sélectionnés et greffées du caroubier. Transfert de technologie en Agriculture.
Bulletin mensuel d’information et de liaison du PNTTA MAPM/DERD, 153, 1–4.
Akin, M., eydurAn, S. P., ercisli, S., KApchinA-totevA,
V., And eydurAn, E. (2016). Phytochemical profiles
of wild blackberries, black and white mulberries from Southern Bulgaria. Biotechnology &
Biotechnological Equipment, 30(5), 899–906.
AlbAnell, E., cAjA, G., And plAixAts, J. (1991).
Characteristics of Spanish carob pods and nutritive Table 5. Factor loadings for each variable on the
components of PCoA analysis
Variable PC1 PC2 PC3 Leaf length 5.54 13.11 1.20 Leaf width 1.12 18.74 1.03 Number of leaflets 4.13 10.11 0.17 Length of leaflets 0.03 16.13 1.67 Pod weight 22.71 0.10 0.55 Pod width 9.22 0.50 9.15 Pod length 2.45 11.23 4.66 Pod thickness 7.11 0.08 7.57 Pulp weight 22.13 0.80 6.21 Seed weight 10.06 0.57 14.13 Seed number 7.06 0.09 25.11 Pulp weight 3.41 2.23 8.62 Seed ratio 1.45 12.09 15.37 Pulp ratio 2.23 10.53 4.22 pH 0.34 1.03 0.07 SSC 0.49 0.90 0.05 Acidity 0.13 0.56 0.13 Vitamin C 0.04 0.08 0.00 Protein 0.23 0.09 0.05 Dietary fibre 0.12 0.03 0.04 Eigenvalue 5.43 2.98 1.67 % of variance 47.1 22.4 9.2 Cumulative variance 47.1 69.5 74.7
Figure 2. PCoA plot for the 36 analyzed wild carob genotypes (the genotype number codes on the plot refer to Tables 1–4).
value of carob kibbles. Options Méditerranéennes,
16, 135–136.
AltindAg, M., sAhin, M., esitken, A., ercisli, S.,
guleryuz, M., donmez, M. F., And sAhin, F. (2006).
Biological control of brown rot (Moniliana laxa Ehr.) on apricot (Prunus armeniaca L. cv. Hacihaliloglu) by Bacillus, Burkholderia and Pseudomonas application under in vitro and in vivo conditions.
Biological Control, 38, 369–372.
AoAc. (2007). Official methods of analysis of AOAC
International. Maryland, USA.
bArrAcosA, P., osorio, J., And crAvAdor, A. (2007).
Evaluation of fruit and seed diversity and characterization of carob (Ceratonia siliqua L.) cultivars in Algarve region. Scientia Horticulturae,
114, 250–257.
bAtlle, I., And tous, J. (1997). Carob tree (Ceratonia siliqua L.). Rome, Italy: International Plant Genetic
Resources Institute.
bhAt, Z. A., dhillon, W. S., rAshid, R., bhAt, J. A.,
dAr, W. A., And gAnAie, M. Y. (2010). The role of
molecular markers in improvement of fruit crops.
Notulae Scientia Biologicae, 2(2), 22–30.
boublenzA, I., El hAitoum, A., ghezlAoui, S., mAhdAd,
M., vAsAi, F., And chemAt, F. (2019). Algerian carob
(Ceratonia siliqua L.) populations. Morphological and chemical variability of their fruits and seeds.
Scientia Horticulturae, 256, 108537.
Butiuc-keul, A., coste, A., FArkAs, A., cristeA,
V., isAc, V., And hAlmAgyi, A. (2019). Molecular
characterization of apple (Malus × domestica Borkh.) genotypes originating from three complementary conservation strategies. Turkish Journal of
Agriculture and Forestry, 43, 464–477.
De pAduA, M., FontourA, P. S. G., And mAthiAs, A. L.
(2004). Chemical composition of Ulvaria oxysperma (Kützing) bliding, Ulva lactuca (Linnaeus) and Ulva
fascita (Delile). Brazilian Archives of Biology and Technology, 47, 49–55.
durmAz, U., And ozel, M. B. (2019). An experimental
study on extraction of sugar from carob using by Taguchi method. Sakarya University Journal of
Science, 23(5), 916–923.
ercisli, S. (2004). A short review of the fruit germplasm
resources of Turkey. Genetic Resources and Crop
Evolution, 51, 419–435.
ercisli, S., Akbulut, M., ozdemir, O., sengul, M., And
orhAn, E. (2008). Phenolic and antioxidant diversity
among persimmon (Diospyrus kaki L.) genotypes in Turkey. International Journal of Food Sciences and
Nutrition, 59(6), 477–482.
ercisli, S., ipek, A., And bArut, E. (2011). SSR
marker-based DNA fingerprinting and cultivar identification of olives (Olea europaea). Biochemical Genetics,
49(9–10), 555–561.
ercisli, S., tosun, M., kArlidAg, H., dzubur, A.,
hAdziAbulic, S., And AlimAn, Y. (2012). Color
and antioxidant characteristics of some fresh fig
(Ficus carica L.) genotypes from Northeastern Turkey. Plant Foods for Human Nutrition, 67(3), 271–76.
eydurAn, S. P., ercisli, S., Akin, M., beyhAn, O., And
gecer, A. E. K. (2015). Organic Acids, sugars,
vitamin C, antioxidant capacity, and phenolic compounds in fruits of white (Morus alba L.) and black (Morus nigra L.) mulberry genotypes. Journal
of Applied Botany and Food Quality, 88, 134–138.
FAostAt. (2018). FAO statistical databases: Agriculture.
Available at: http://faostat.fao.org (accessed 12 January 2020).
FAzendA, P., pereirA, R., FonsecA, M., cArlier, J., And
leitão, J. (2019). Identification and validation of
microsatellite markers in strawberry tree (Arbutus
unedo L.). Turkish Journal of Agriculture and Forestry, 43, 430–436.
gepts, P. (2006). Plant genetic resources conservation
and utilization: The accomplishments and future of a societal insurance policy. Crop Science, 46, 2278– 2292.
gezer, B. (2018). Adsorption capacity for the removal
of organic dye pollutants from wastewater using carob powder. International Journal of Agriculture
Forestry and Life Sciences, 2(1), 1–14.
ghArnit, N., El mtili, N., ennAbili, A., And sAyAh,
F. (2006). Pomological characterization of carob tree (Ceratonia siliqua L.) from the province of Chefchaouen (NW of Morocco). Moroccan Journal
of Biology, 2–3, 1–11.
hAddArAh, A., ismAil, A., bAssAl, A., hAmieh, T.,
ioAnnou, I., And ghoul, M. (2013). Morphological
and chemical variability of Lebanese carob varieties.
European Scientific Journal, 9, 353–359.
hAlAsz, J., pedryc, A., ercisli, S., yilmAz, K. U., And
hegedus, A.. (2010). S-genotyping supports the
genetic relationships between Turkish and Hungarian apricot germplasm. Journal of the American Society
for Horticultural Science, 135(5), 410–417.
kAFkAs, E., ozgen, M., ozogul, Y., And turemis, N.
(2008). Phytochemical and fatty acid profile of selected red raspberry cultivars: A comparative study. Journal Fruit Quality, 31, 67–78.
kAFkAs, N. E., kosAr, M., oz, A. T., And mitchell,
A. E. (2018). Advanced analytical methods for phenolics in fruits. Journal Food Quality, 2018, 3836064.
keles, H., And bilir, N. (2015). Interaction of growth
and reproduction characteristics in Carob tree (Ceratonia siliqua L.) populations. Agriculture and
Forestry, 61, 369–377.
lA mAlFA, S., AvolA, C., brugAlettA, M., lA rosA,
G., And murAtore, G. (2012). Morphological and
technological characterization of different carob cultivars in Sicily. Acta Horticulturae, 940, 207–212. mArAkis, S., kAlAitzAkis, J., And mitrAkos, K. (1988).
Criteria for recognizing carob tree varieties. In
International Carob Symposium (pp. 558–566)
Valencia, Spain.
ozcAn, M. M., ArslAn, D., And gokcAlik, H. (2007).
Some compositional properties and mineral contents of carob (Ceratonia siliqua) fruit, flour and syrup. International Journal of Food Sciences and
Nutrition, 58, 652–658.
pAzir, F., And Alper, Y. (2018). Carob bean (Ceratonia siliqua L.) and its products. Anadolu, 28(1), 108–112.
russo, G., And polignAno, G. B. (1996). Variation of
seed and fruit characters in Ceratonia siliqua L. cultivars. Genetic Resources and Crop Evolution,
43(6), 525–531.
sAhin, U., AnApAli, O., And ercisli, S. (2002).
Physico-chemical and physical properties of some substrates used in horticulture. Gartenbauwissenschaft, 67(2), 55–60.
sAhin, G., And tAsligil, N. (2016). Agricultural
geography analysis of carob tree (Ceratonia siliqua L.) from Turkey. Turkish Journal of Agriculture:
Food Science and Technology, 4(12), 1192–1200.
tous, J., romero, A., hermoso, J. F., ninot, A., plAnA,
J., And bAtlle, I. (2009). Agronomic and commercial
performance of four Spanish carob cultivars.
HortTechnology, 19, 465–470.
turhAn, I., Aksu, M., kArhAn, M., And tetik, N.
(2006). Liquid-solid extraction of soluble solids and total phenolic compounds of carob bean (Ceratonia
siliqua L.). Journal of Food Process Engineering, 29, 498–507.
vAn, K., kim, D. H., shin, J. H., And lee, S. H. (2011).
Genomics of plant genetic resources: Past, present and future. Plant Genetic Resources-C, 9(2), 155–158.
ZiA-ul-hAq, M., AhmAd, S., bukhAri, S. A.,
AmArowicz, R., ercisli, S., And jAAFAr, H. Z. E.
(2014). Compositional studies and biological activities of some mash bean (Vigna mungo (L.) Hepper) cultivars commonly consumed in Pakistan.
Biological Research, 47, 23.