THE X-EFFICIENCY IN TURKISH BANKS
ENGİN ÖZÖREN 109664029
ISTANBUL BILGI UNIVERSITY
FACULTY OF ECONOMICS AND ADMINISTRATIVE SCIENCES INSTITUTE OF SOCIAL SCIENCES
Master of Science International Finance
Academic Advisor: Assc.Prof. Cenktan ÖZYILDIRIM Submitted: 29/12/2015
Engin ÖZÖREN 109664029
Tez Danışmanı: Associated Prof. Cenktan ÖZYILDIRIM Jüri Üyesi: Assistant Prof. Deniz İKİZLERLİ Jüri Üyesi: Assistant Prof. Ebru REİS
Tezin Onaylandığı Tarih:
Toplam Sayfa Sayısı: number of total pages 31
Anahtar Kelimeler: Key Words:
1) 2014 Türk Bankacılığı 1) 2014 Turkish Banking
2) Verimlilik 2) X-Efficiency
3) Mevduat 3) Deposit
4) Çalışan sayısı 4) Labor Force
i
ABSTRACT
This paper investigates the relative efficiency of Turkish banking industry by analyzing data of 4 groups of banks for the year 2014. 32 Turkish banks are investigated accordingly. In the first place, brief information about the Turkish banking industry is given. Secondly, the concept of efficiency this paper has considered is clarified. Thirdly, methodology used is explained. The methodology mainly used is as follows: a stochastic translog cost and profit function is applied in order to derive a single score of efficiency of banks in Turkey. The efficiencies are calculated and scored accordingly. The results show us State-owned Deposit Banks operates the most efficient in Turkish Banking industry being Ziraat Bankası the leader, followed by Privately-owned Deposit Banks, being İş Bankası the leader. Furthermore, Findings suggested that X-efficiency directly relates to some certain abilities of banks such as collecting deposits and generating loans. Furthermore, investigations indicated that X-efficiency of banks in Turkey highly correlates with employee numbers and expenditures made on bank’s employees.
ii
Özet
Bu çalışma 4 banka grubunun 2014 verilerini kullanarak Türk Bankacılık Sektörünün X Verimliliğini araştırmaktadır. Bu amaç altında 32 banka incelenmiştir. İlk olarak Türk bankacılık sektörüne ilişkin kısa bir bilgi verilmiştir. Daha sonra bu çalışmanın kullandığı verimlilik konsepti açıklanmıştır. Üçüncü olarak kullanılan metodlar açıklanmıştır. Bu çalışmada stokastik translog maliyet fonksiyonu ve kar fonksiyonu, her banka için ayrıca uygulanıp, karşılaştırma için tek bir skor elde edilmiştir. Çalışma sonucunda hesaplanıp analiz edilen verilere bakıldığında, Ziraat Bankası başta olmak üzere kamusal sermayeli mevduat bankalarının sektörde en verimli olduğu, İş bankası başta olmak üzere özel sermayeli mevduat bankalarının kamusal sermayeli bankalardan sonra geldiği sonuçlarına ulaşılmıştır. Ayrıca X-verimliliğin direkt olarak bankaların kredi yaratma, mevduat toplama gibi yetilerine bağlı olduğu görülmüştür. Ayrıca araştırmalar sonucunda X-Verimliliğin bankaların çalışan sayıları ve çalışanlarına yaptığı harcama miktarıyla yüksek bir korelasyon içerisinde olduğu gözlemlenmiştir
iii
Acknowledgments
I would like to express my gratitude to my dissertation supervisor Assist. Prof. Dr. Cenktan Özyıldırım, for his guidance and contribution. I owe him for his support, motivation, collaboration and respect in every stage of this study. Without his emotional support i couldn’t finish this program 10 more years.
I would also like to express my special thanks to my familyAyşegül-Rabia-Mehmet ÖZÖREN and my company for their support.
Finally, I dedicate this work to ‘my lifetime learning enthusiasm’’ who always supports, motivates and helps me to develop my career.
iv
Contents
List of Tables ... v List of Graphs ... vi Abbreviations ... vi 1. INTRODUCTION ... 12. LITERATURE AND THE CONCEPT OF EFFICIENCY ... 2
2.1 Parametric Cost Efficiency ... 3
2.2 Alternative Profit Efficiency ... 4
3. DATA & METHODOLOGY ... 5
3.1 History of Turkish Banking ... 5
3.2 Data Selection & Grouping ... 6
3.3 Methodology to find X-Efficiency ... 8
3.3.1 Cost Efficiency ... 9
3.3.2 Profit Efficiency ... 10
4. DISCUSSION, INTERPRETATION ... 12
4.1 X-Efficiency Scores ... 12
4.2 The findings of the study ... 15
4.2.1 Which Banking Groups more efficient? ... 15
4.2.2 Foreign Bank’s special products & services... 16
4.2.3 The Role of effectiveness of Deposits ... 16
4.2.4 Personnel Numbers and Expenditures effects on Efficiency ... 17
5. CONCLUSION ... 19
REFERENCES ... 21
v
List of Tables
1. List of Academic Papers related with X-Efficiency………3
2. List of banks under each group investigated ………7-8 3. Inputs and Outputs used in study………..9
4. X-Efficiency scores of Banks……….12-13 5. Banks and Total Credits as input………25
6. Banks and Total Securities as input………26
7. Banks and Labor Price as output……….27
8. Banks and Labor Price as output (vs capital)………..28
9. Banks and Deposit Price as output………..29
10. Banks and Personnel Expenditures in thousand………..30
vi
List of Graphs
1. X-Efficiency scores of Bank Groups……….14
2. Graph of X-Efficiency scores of bank………...14
3. Correlation of X-Efficiency and Personnel Expenditures……….18
4. Correlation of X-Efficiency and Personnel Number as of 2014………...18
Abbreviations
BDDK: Bankacılık Düzenleme ve Denetleme Kurumu www.bddk.org.tr
BRSA: Banking regulation and supervision agency www.bddk.org.tr/WebSitesi/English.aspx
TBB: Türkiye Bankalar Birliği www.tbb.org.tr
TBAOT: The Banks Association of Turkey www.tbb.org.tr/en/home
TMSF: Tasarruf Mevduatı Sigorta Fonu www.tmsf.org.tr
SDIF: Saving Deposits Insurance Fund www.tmsf.org.tr/default-en.html
TKBB: Türkiye Katılım Bankaları Birliği www.tkkb.org.tr
PBAT: Participation Banks Association of Turkey www.tkbb.org.tr/homepage
1
1.
INTRODUCTION
Firstly, Profitability is not the main concern for the banks itself. To catch accurate profitability level in the manner of acquiring and maintaining long term profit, it is crucial to be aware of the fact that it is succeeded with only optimum cost management. Most of the time, Banks intervene their total operational costs in the way of reducing them regardless of their long term effects in order to execute their short term purposes. However, findings of this study indicates that accurate interventions to costs to increase profitability is significant for persistence of the banking sector. It does not mean that lower cost brings higher profitability. On the contrary, sometimes, you have to spend more money to get long term profit. For example, making investments to marketing activities, formation of new branding system and any payment to increase the awareness of the entity will have a huge and intense influence on long term profitability of the corporation. In this point, efficient profit level is not only came into existence with reducing costs.
This study will yield valuable information about the efficiency level of Turkish economy’s most important players, banks which has total outstanding credits of 1.1 Trillion TL and net profit of 13 billion TL as of 2014. The profit efficiency is more valuable when determining the financial performance of a firm since it considers mainly the goals of the banks which is profit maximization rather than cost minimization. It is mainly succeeded by sustaining the higher X-efficiency level. In this study, the banks are examined according to their efficiencies. The results indicate that the leader bank in terms of efficiency changes in every decade due to environmental factors such as regulations, economic conditions, improvement of technology. Furthermore, bigger banks tend to operate more efficient than small banks as Kisaka (2014) and banks generating more loans and collecting more deposits operates more efficient.
To be concluded, this paper concentrates mainly the X-Efficiency which is so important for not only for the banks, but also overall economy of Turkey, like employment and goods and services produced, that affects banking operations. This study investigates the X-Efficiency of 4 bank groups in Turkey by utilizing economical approaches. The aim of this study is to
2 determine the X-Efficiency of different banking groups and comparison among 4 main bank groups operates in Turkish banking industry. X-Efficiency is not just important for the banks, it is also important for overall economy of Turkey since outputs produced and the resources used in operations by banks are directly related to economy such as employment and labor force participation etc. The first section provides a brief summary of Turkish banking history. In the second section, literature and concept of efficiency are examined detailed with the main subunits, parametric cost efficiency and alternative profit efficiency. In the data and methodology section, figures, inputs and outputs are indicated and last section concludes the study with findings of investigations and interpretation of the analysis and results in the light of these general data and inputs.
2.
LITERATURE AND THE CONCEPT OF EFFICIENCY
The concept of efficiency dealt with in this paper is composed of 2 forms. The efficiency measures have its’ roots in groundbreaking study of Farrell (1957) that allocative and technical efficiency can be determined by employing some measures. And Leibenstein (1966) concluded that people and corporations do not work as hard or effective as they can due to variety of reasons. The cost efficiency and the profit efficiency both being the majorly used approaches in the studies alike in literature such as Ozyildirim (2008), Dikmen (2013), Kwan (2001), Hassan(2006), Kisaka (2014), Frantz (2015). The cost and profit efficiency approach and DEA methods are widely used in the literature of efficiency. Results of all these studies indicates an average efficiency of %77 and median efficiency of %82 and results vary across countries. (Berger and Humphrey, 1997). You can see the different papers from all over the world to describe efficiency in its banking sectors from 1990 to 1997 in the table below. Using the same outputs, according to Kwan (2001), a standard large bank is found to be less efficient than the standard small bank, particularly during the earlier time periods. On the other hand, Kwan and Eisenbeis (1996) suggested that large banks are more efficient in terms of X-Efficiency than small banks. And Kisaka (2014) stated that large banks in Kenya operates more efficient than small banks in Kenyan banking industry.
3 Table 1: Literature search from 1990 to 1997
PAPER YEAR COUNTRY
Field 1990 UK Vassiloglou 1990 Greece Giokas 1990 Greece Berg 1991 Norway Drake 1992 UK Weyman-Jones 1992 UK Forsund 1992 Norway Jansen 1992 Norway Zieschang 1993 US Fixler 1993 US Hayes 1993 US Grosskopf 1993 US Ferrier 1993 US Fukuyama 1993 Japan
Al-Faraj 1993 Saudi Arabia
Alidi 1993 Saudi Arabia
Bu-Bshait 1993 Saudi Arabia
Favero 1995 Italy Papi 1995 Italy Grifell-Tatje 1997 Spain Lovell 1997 Spain Taylor 1997 Mexico Thompson 1997 Mexico Thrall 1997 Mexico Dharmapala 1997 Mexico
2.1 Parametric Cost Efficiency
Cost efficiency is the measure of how far is a bank’s costs when producing same output under the same environmental properties. Nonparametric and Parametric approaches are use in this framework. Nonparametric approaches are employed utilizing linear programming technique. Parametric approach, stochastic approach in other words, is derived from a standard cost function of which the output, costs, depend on the input prices, quantities of variable outputs, random error value, and inefficiency value.
4 Duality theory states that under certain environmental and dynamic conditions, properties of production function can be conducted indirectly by utilizing a profit function or a cost function.
Accordingly, Meeusen and Broeck (1977) and also Aigner (1977) Define cost function of a bank as;
Cb stands for the bank’s total operational costs, yi represents the vector of quantities of the bank’s variable outputs, pk is the vector of prices of the bank’s variable inputs, and ε b is a composite error term, through which the cost function varies stochastically.
The term ε b can be partitioned into two parts as follows:
where, ub refers to endogenous factors and eb refers to exogenous factors, which has distinctive effect on cost of the bank production. Thus the term ub notes a significant rise in the cost of bank production due to factor f inefficiency that may result from the faulty management level decisions, such as non-optimal employment of the quantity or input portfolio. Whereas, eb represents a non-permanent increase or decreasing the cost of bank due to the random factor that may stem from a data or measurement errors, or unexpected or uncontrollable factors as going on strikes, bad luck, political crisis and so on as also indicate by Hassan (2006). The common point of this factors are that these are not under the management’s influence.
2.2 Alternative Profit Efficiency
Berger and Master (1977) states that the profit efficiency is more valuable when determining the financial performance of a firm since it considers mainly the goals of the firms which is profit maximization rather than cost minimization. There are 2 main ways to estimate profit efficiency: The Standard Profit Function and the Alternative Profit Function. While two main differences of the different functions is the terms of utilized output. The standard one uses the output prices while the alternative one uses the output quantities. Berger and Master (1977) reports that the alternative profit efficiency is closer to the reality since the perfect
5 market assumptions do not hold most of the times. 4 condition is determined when which satisfied the alternative profit function provides better results.
They are
i) Important unmeasured differences in sector
ii) Product mix with the scale of output cannot be reached iii) Perfectly competitive markets do not exist
iv) Output prices are not measured correctly.
The formula for the Alternative Profit Function is as follows:
Alternative profit efficiency measures how close a bank generating profits while considering the output levels it employs. A 40% profit efficiency score indicates that a firm would earn 60% more profits than what it is generating right now if it were operating on efficient frontier which is different than what it operates on currently.
3.
DATA & METHODOLOGY
3.1 History of Turkish Banking
The first financial banking activities were started by Ottoman money changers and Galatea bankers in early 1800s. After the famous Crimean war, catastrophic effects in the financial health of Ottoman Empire took place. Ottoman needed external financial help in order to survive. After the news had spread, several foreign bank representatives came to Ottoman, offering high interest rate credits. That was the first establishment of Ottoman bank in 1856, headquarter in London. The bank was operating as a central bank in Ottoman until the establishment of Central Bank in 1930s. The new central bank was fulfilling its duties as a standard central bank, issuing banknotes, protecting currency and so on. However, in 1980s central bank undertook a more authoritical and game-changer role. Bank started to cut down
6 lending activities and regulate the markets more. In 1980s, the government liberalized the characteristics of banking sector. New reforms were adopted; exchange rates and interests were liberalized, new market entrants were encouraged, Turkish banking sector was promoted in order to attract foreign players. The number has increased from 4 to 50 foreign banks operating in Turkey today.
The banking sector in Turkey is one of the biggest banking industries in Emerging Europe, taking the 2nd place after the Russia with the industry size of 833 billion US Dollars. Turkey has 33 Commercial banks including 3 State owned banks (%90.4 in asset shares), 13 Investment and Development banks (%4.4 in asset shares) and 5 participation banks (%5.2 in asset shares). The sector is highly regulated by 2 main authorities, Central Bank of Turkey (CBRT) and Banking Regulation and Supervision Agency (BRSA). In 2015, Turkish banks raised US$ 7.7 billion as syndicated loans; US$ 770 million was received from multilateral development banks and US$ 2.1 billion issuances under Global Medium Term Notes (GMTN) programs as reported in Turkish Banking in Brief (2014).
In this paper, the X-efficiency comparison is made for Turkish banks for the year 2014. Data used in this study directly taken from BDDK & TBB for 2014 (Turkish Banking Regulation and Supervision Agency & The Banks Association of Turkey).
3.2 Data Selection & Grouping
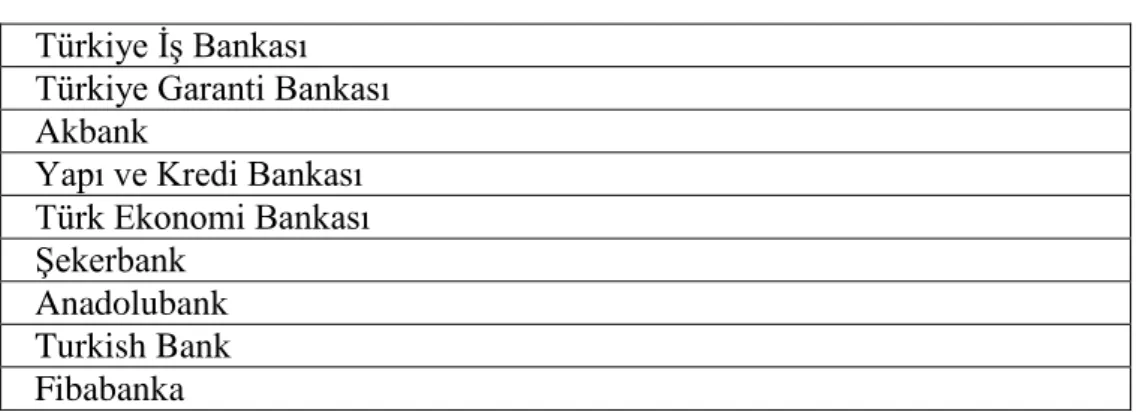
Study includes 32 banks belonging to 4 Main groups; State Owned Deposit Banks, Privately Owned Deposit Banks, Foreign Banks Founded in Turkey, foreign Banks Having Branches in Turkey as seen in Table 1.Adabank is not included in the study since it was sequestrated by TMSF (Saving Deposits Insurance Fund) and BDDK in 2004.
Participation banks is not included due to data gathering problems. They belongs to TKBB (The Participation Banks Association of Turkey instead of TBB The Banks Association of
7 Turkey) regulating by BDDK on the other hand their balance sheets and operating system is not the same as conventional banks. They are very unique bank types which we could only see in Muslim countries.
Table 2: List of banks under each group investigated a-State Owned Deposit Banks
Türkiye Cumhuriyeti Ziraat Bankası Türkiye Vakıflar Bankası
Türkiye Halk Bankası
b-Privately Owned Deposit Banks Türkiye İş Bankası Türkiye Garanti Bankası Akbank
Yapı ve Kredi Bankası Türk Ekonomi Bankası Şekerbank
Anadolubank Turkish Bank Fibabanka
c-Foreign Banks Founded in Turkey Finans Bank Denizbank HSBC Bank ING Bank Odea Bank Alternatifbank Burgan Bank Turkland Bank Citibank Tekstil Bankası Arap Türk Bankası Rabobank Deutsche Bank
8 d-Foreign Banks Having Branches in Turkey
Bank Mellat
Intesa Sanpaolo S.p.A. Habib Bank Limited
JPMorgan Chase Bank N.A. Société Générale (SA)
The Royal Bank of Scotland Plc.
3.3 Methodology to find X-Efficiency
The methodology used to find the X-efficiency is comprised of mainly 2 methods; The Translog Alternative Profit Function for profit efficiency and Stochastic Frontier Analysis for cost efficiency.
Profit efficiency refers to a firm’s ability to reach the optimum profit by utilizing input and output prices. The activity of profit maximization includes both revenue maximization and cost minimization. Firms tend to search for ways to both increase the revenues and minimize the costs for the production or service. The concept of profit efficiency consists of both inputs and outputs and therefore would be more effective when assessing the banks in the industry. If a firm gains outputs that is less or non-optimal in terms of input prices, then it operates as an inefficient firm. In other words, a firm might not be just inefficient in terms of cost, might be as well inefficient in terms of revenues.
This section of the paper is providing us with the analysis of banks in the industry and would provide us a structured and analytical way of assessing the performances of players in the sector and finally create a chart of scores of activity by employing Cost and Profit functions derived from Stochastic Frontier Approach. In the first step, the scores of cost efficiencies are investigated and the profit efficiency is followed. As we infer form the latest researches, the high profit efficiency does not necessarily bring the cost efficiency with itself. Providing the top-tier service might incur lots of expenses therefore the firms would end up with unbearable costs that harm the cost efficiency of the firm.
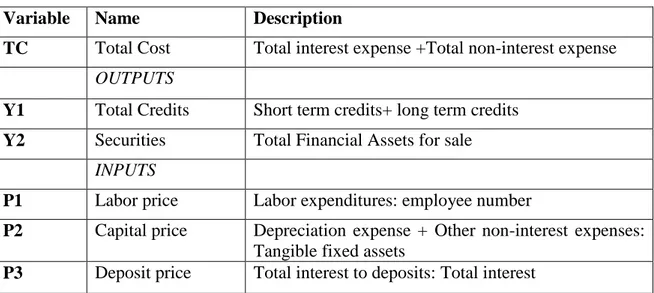
9 This paper utilizes the most used inputs and outputs in the process of thriving scores of efficiency. 3 inputs and 2 outputs are used in the investigations as stated in the Table 1.a below.
Table 3. Inputs and Outputs used in study
Variable Name Description
TC Total Cost Total interest expense +Total non-interest expense OUTPUTS
Y1 Total Credits Short term credits+ long term credits Y2 Securities Total Financial Assets for sale
INPUTS
P1 Labor price Labor expenditures: employee number
P2 Capital price Depreciation expense + Other non-interest expenses: Tangible fixed assets
P3 Deposit price Total interest to deposits: Total interest
Total credits and securities are chosen since they are the most significant instruments in generating revenue for banks making them the most prominent variables in process of achieving revenue and profit maximization. Labor price, Capital price and deposit price are employed also since the most significant expenditures are made on these 3 for a bank which makes them a major player in cost minimization activities of a bank. Moreover, these 2 inputs and 3 outputs are the most popular and widely used in papers of efficiency studies all around the world. The deposits here can be said to have more important role than the other input and outputs since overall it has relatively more impact on derived scores of efficiency. As Özyıldırım (2008) stated, banks choose to rely on deposits more than bonds and loans due to liquidity risk since deposits are more dependable and stable.
3.3.1 Cost Efficiency
The function used in cost investigations is in the Translog form that is a second degree Taylor series approximation. As indicated by Dikmen (2013), The best advantage of this form of function is it allows for variable yield
10 The Cost efficiency function utilized in this study is shown below;
Where;
: Total cost of bank b in t
input prices for bank b in t
output prices for bank b in t
= 1, 2, 3 İ= 1,2
are parameters to be guessed And homogeny constraints;
3.3.2 Profit Efficiency
As indicated by Noelle and DeYoung (1996), cost-based models might lead to unrealistic and distorted results when evaluating banks for inefficiency. A bank might gain more edge by increasing its cost such as hiring more direct marketer or investing heavily on advertisements and etc.
11 Berger and Master (1997) suggests that maximizing profits is more valuable than cost minimization for comparing and evaluating a bank’s performance since it addresses more specifically for economic goals of the investors and owners who considers the costs for generating profits as well.
Profit efficiency employed in this study indicates how close or far away a bank is when making profits employing the given output levels as indicated by Dikmen (2013). Berger and Mester (1997) reports that alternative profit efficiency is closer to the reality when assumptions for standard markets do not actually exist in investigated markets.
The profit function utilized in this study is shown below;
Where;
: Total cost of bank b in t
Input prices for bank b in t
Output prices for bank b in t
= 1, 2, 3 İ= 1,2
12 And homogeny constraints;
4.
DISCUSSION, INTERPRETATION
Banks investigated and analyzed in this paper are grouped as State Owned Deposit Banks, Privately Owned Deposit Banks, and Foreign Banks Founded in Turkey and Foreign Banks Having Branches in Turkey.
4.1 X-Efficiency Scores
List of banks under each group is shown in Table 1, TBB (2014). The results obtained from the data of 2014 for the Turkish banking sector by utilizing the methods are used to derive a score for each bank investigated as seen in Table 2, Table 3 and Table 4. In which data are obtained from TBB (2014) (The Banks Association of Turkey)
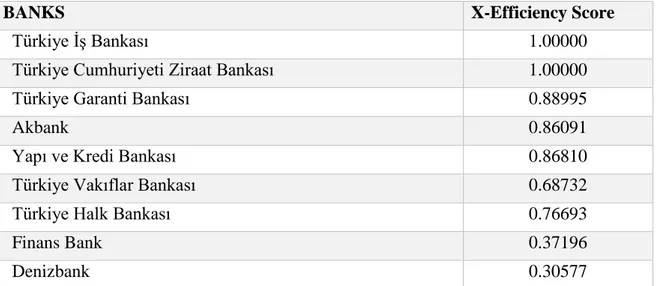
Table 4. X-Efficiency scores of Banks.
BANKS X-Efficiency Score
Türkiye İş Bankası 1.00000
Türkiye Cumhuriyeti Ziraat Bankası 1.00000
Türkiye Garanti Bankası 0.88995
Akbank 0.86091
Yapı ve Kredi Bankası 0.86810
Türkiye Vakıflar Bankası 0.68732
Türkiye Halk Bankası 0.76693
Finans Bank 0.37196
13 Türk Ekonomi Bankası 0.30325 HSBC Bank 0.11371 ING Bank 0.18013 Şekerbank 0.07323 Odea Bank 0.14868 Alternatifbank 0.03529 Anadolubank 0.03904 Burgan Bank 0.03680 Fibabanka 0.03652 Turkland Bank 0.01932 Citibank 0.02556 Tekstil Bankası 0.01880 Deutsche Bank 0.00497 Arap Türk Bankası 0.06124
The Royal Bank of Scotland Plc. 0.00374
Société Générale 0.00137
Turkish Bank 0.00691
JPMorgan Chase Bank 0.00004
Bank of Tokyo-Mitsubishi UFJ Turkey 0.02464
Rabobank 0.00654
Bank Mellat 0.06593
Intesa Sanpaolo S.p.A. 0.00151
Adabank A.Ş. 0.00000
14 Graph 1. X-Efficiency scores of Bank Groups
Graph 2. Graph of X-Efficiency scores of bank 0,01218 0,45310 0,81808 0,09667 0 0,1 0,2 0,3 0,4 0,5 0,6 0,7 0,8 0,9 Foreign Banks Having Branches in Turkey Privately Owned Deposit Banks State Owned Deposit Banks Foreign Banks Founded in Turkey 0,00 0,10 0,20 0,30 0,40 0,50 0,60 0,70 0,80 0,90 1,00 Türki ye İş Ban ka sı Türki ye Cumhuri ye ti Zi ra at … Tür ki ye Gar ant i B ankas ı A kba nk Y apı ve K redi B ank as ı Türki ye Va kıf la r Ba nk as ı Tür ki ye Hal k B ank as ı Fi nans B ank D eni zba nk Tür k Ekon om i B ank as ı H SB C B ank I N G B an k Şek er bank O dea B ank A lt er nat if ban k A nad ol ub ank B ur gan Ba nk Fi baba nka Tur kl and B an k C it ibank T ek st il B anka sı D eut sc he Ban k A ra p Tür k B anka sı The R oyal B ank of Sc ot land Plc . S oc ié té G énér al e (SA ) Tur ki sh B ank JPM or gan Cha se B ank B an k of To kyo-Mi ts ubi shi … R ab obank B an k Me ll at I nt esa Sa npao lo S.p .A . H abi b B an k Lim it ed
15
4.2 The findings of the study
The Banking industry in Turkey has been volatile for the last few decades due to unstable economy, newly imposed regulations and economic crisis. In this environment, utilizing both profit and cost efficiency is sometimes hard to sustain for both the profitability and achievement of long term goals of the banks. The main handicap of banks in Turkey has been the cost inefficiency. This finding also confirms the earlier studies of Işık and Hassan (2002). On the other hand, even the banks are generally cost inefficient, they achieve and enhance their profitability along with profit efficiency. Banks find more and diverse way to generate profit even though they are suffering from cost inefficiency.
4.2.1 Which Banking Groups more efficient?
The findings suggest that the highest scored bank group is State-owned deposit banks sustaining the highest X-efficiency level among other players in the industry, Ziraat Bankası being the leading efficient in the segment. Privately owned deposit banks follows the state-owned counterparts being the second efficient in terms of cost and profit
efficiency combined, İş bankası being the leading in its segment as Ziraat Bankası in its’ State-owned counterpart. The least scored bank groups are foreign banks in Turkey. This finding confirms the early study of Kwan and Eisenbeis (1996) using the same input and outputs and utilizing Stochastic Efficient Frontier approach, suggested that big banks are operating more efficiently than smaller banks in US. Alos Kisaka (2014) stated that large banks in Kenya operates more efficient than small banks in Kenyan banking industry which is parallel with 2014 x-efficiency in Turkish banks results..
The results indicate that the leader bank in terms of efficiency changes in every decade due to environmental factors such as regulations, economic conditions, improvement of
technology. Furthermore, bigger banks tend to operate more efficient than small banks. And banks generating more loans and collecting more deposits operates more efficient. Which also confirms the study of Kwan (2001), Banks making more loans, and gathering more deposits tend to be more efficient than its counterparts in the same industry.
16 As of 2014, Ziraat Bank being the leader in the leader group of banks scored the highest and this could be attributed to its changing missions and shaping of the standard state-owned bank to operate as a leading and innovative bank in terms of business as of 2001 with merger of Emlak Bank. State-owned Banks operates widely with hundreds of
branches employing thousands of labor force. This outspread and complex operation grants these banks the power of price-setting and consequently the dominance in the industry of banking. Even though they generate higher revenues and operates more profit efficient, the employment policy for both first line employees and management causes inefficiency in terms of utilizing the labor force.
4.2.2 Foreign Bank’s special products & services
Foreign Banks operates more profitable and less costly but their ability to collect deposits and grant loans are significantly lower than the Privately-owned and State-owned banks in Turkey, causing them to score lower in this study. Foreign banks benefit from
Oligopolistic structure of Turkish banking industry and after 2001, the year of initiation of a program called “Restructuring of Banking Industry” (BSYYP) their way of doing
business changes along with their policies. Moreover, these banks set their prices by considering more of the profits not the costs as their big competitors who have to consider their costs to set prices. Advantages above suggests that foreign banks in Turkey shows steady potential which could in the future, plays a role as game-changers in the industry if they are to take advantage of the industrial potentials and opportunities.
4.2.3 The Role of effectiveness of Deposits
It can be inferred from the study that Deposits play a huge role in determining X-efficiency scores. The main reason is deposits are the main assets of bank that a bank can easily and cheaply use in order to generate income. As also stated by the Özyıldırım (2008) the cost of deposits are more affordable and cheap for banks than other kinds of funding sources. In
17 addition to that, deposits are stable and do not show volatility as bonds or stocks. The ability to collect deposits majorly determines market leaders.
From the findings of this study, we can conclude that foreign banks in Turkey and Foreign banks having branches in Turkey are short of collecting deposits. This can be attributed to insufficient brand awareness o banks or insufficient marketing activities. Furthermore, as a country whose citizens can be said to just started to trust and use the banks with depositing their pay checks, earnings, luxurious items and etc. The degree of trust makes the major impact on selection of which bank to deposit. Therefore, as we can see in founding of this study, banks like Türkiye İş Bank and Türkiye Ziraat Bank have strong ability to collect deposits thanks to their brand awareness in Turkey and gained reputation throughout the years of existence. That also may be the reason of why foreign banks who is relatively new on the market and have inadequate brand awareness, marketing or advertisements come in short when collecting deposits.
4.2.4 Personnel Numbers and Expenditures effects on Efficiency
Labor participation and their expenditure tendency are important for firms and entities. When it is considered for the banks, beginning of the any crisis, they are firstly
investigating these parameters for decreasing their costs. In the light of correlation between X- Efficiency, personnel numbers and personnel expenditures.
18 Graph 3. Correlation of X-Efficiency and Personnel Number as of 2014
Graph 4. Correlation of X-Efficiency and Personnel Expenditures
Analysis on X-efficiency and labor expenditures and personnel number are examined in the tables above. When it is considered that how well data fit a statistical model sometimes simply a line or a curve, an R2 indicates that the magnitude of the regression line fits the data. An R2 of 1 indicates that the regression line perfectly fits the data, while an R2 of 0 indicates that the line does not fit the data at all. Accordingly, X- efficiency and personnel expenditure figures show that it has 0,93 R2 and the other parameter, personnel numbers and
0,00 0,10 0,20 0,30 0,40 0,50 0,60 0,70 0,80 0,90 1,00 0 5.000 10.000 15.000 20.000 25.000 X EF F IC IEN CY PERSONNEL NUMBERS 0,00 0,10 0,20 0,30 0,40 0,50 0,60 0,70 0,80 0,90 1,00 0 500.000 1.000.000 1.500.000 2.000.000 2.500.000 X -EF F IC IEN CY PERSONNEL EXPENDITURE
19 X efficiency have a little bit higher R2 result than the former as 0,94. It means there is nearly
perfect fit between X efficiency and personnel numbers and personnel expenditures. The analysis contains data for 32 banks and their expenditures made on labor and their personnel number as of 2014. The result of the analysis indicated a positive correlation between X-efficiency score of a bank and its expenditures on labor force with correlation coefficient of 0,968333 as in table 10. Also it is true for a bank’s X-Efficiency and number of personnel it employs nationwide with correlation coefficient of 0,971636 as in table 11. These numbers indicates a strong correlation between the X- Efficiency and a bank’s expenditures made on its personnel and its personnel number. A bank spending more on its’ personnel by means of training for employees, healthcare packages, corporate activities and etc. is found out to be more efficient . Furthermore, a bank employing more labor is more efficient than its rivals in the industry in terms of X-Efficiency.
5.
CONCLUSION
An overall comment can be made as the state of banks that has scored the highest, İş bankası and Ziraat bankası, shows a promising potential for further growth meaning that they will sustain their position with their strong deposit and credit portfolio along with their respected and trustworthy brand name in Turkey and continue to increase their X-Efficiency even more. On the other hand, foreign banks will try and improve their positioning and market share in Turkey by investing the capital produced in countries where they are operating bigger than here in Turkey by means of advertisement, better interest rates, differentiated services etc.
The smaller banks in other groups can be said to try to capture more customers in order to increase their positions in the oligopolistic Turkish banking industry. For every banks in every bank group, this enhancement can be done better investing in collecting more
deposits since it is the most important item in increasing overall X-Efficiency of a bank, as the study concluded. If the labor, capital and other resources are allocated towards gaining more deposits rather than side services of EFT or money transfer and etc. banks will gain edge in terms of X-Efficiency by experiencing more return on their resources spent.,
20 The information obtained from this study can be useful for investors, regulation setters, market analysts, new entrants in the industry and management of banks. Strategy setting, employment practices and business policies can benefit from the study in order to help with decisions related by analyzing the inputs, outputs, structures and best practices of current high and low efficient banking industry players.
21
REFERENCES
Aigner, D.J., Lovell, C.A.K., Schmidt, P. (1977), ‘Formulation and Estimation of Stochastic Frontier Production Function Models’, Journal of Econometrics, 6, 21–37.
Berger, A.N. & Mester, L. J. (1997). “Inside the Black Box: What Explains Differences in the Efficiencies of Financial İnstitutions” Journal of Banking and Finance, 21, 895-947.
Berger, A.N. & Humphrey, D. B. (1997). “Efficiency of Financial Institutions:
International Survey and Directions for Future Research”, Europen Journal of Operational Research, 98(2), 175–212.
Özyıldırım, Cenktan (2008) , “‘How Do the Risk Taking Behaviors Of Banks Impact Their Profitability: An Analysis Of Risk Efficiency Of Turkish Banks” WSEAS Management, Marketing and Finances Conference (MMF'08), 2008 ,Boston-USA
Dikmen, Fatih Hakan (2013), “Türk Bankacılık Sektörü İçin Bir Etkinlik Analizi: 2003-2007”, Ekonomik Yaklaşım 23(85), 83-120.
Hassan, M.Kabir (2006), “The X-Efficiency in Islamic Banks”, Islamic Economic Studies, 13(2),51-74
Meeusen, Wim and Julien Van Den Broeck (1977), ‘Efficiency Estimation From Cobb-Douglas Production Functions with Composed Errors’, International Economic Review, 18(2), 435-44.
DeYoung, Robert and Daniel E. Nolle (1996), ‘Foreign-Owned Banks in the United States: Earning Market Share or Buying It?’, Journal of Money, Credit & Banking, 28(4), 622-36.
22 TBB (2014). Türk Bankacılık Sistemi 2013, İstanbul: Türkiye Bankalar Birliği Yayını.
Turkish Banking Sector in Brief (2014). Retrieved:
https://www.garantiinvestorrelations.com
Kwan, S. H. and Eisenbeis, R. A. E. (1996), “An Analysis of Inefficiencies in Banking: A Stochastic Cost Frontier Approach” Economic Review, 2, 16-26, Federal Reserve Bank of San Fransisco.
Ferrier, G. D. and C. A. K. Lovell (1990), ‘Measuring Cost Efficiency in Banking: Econometric and Linear Programming Evidence’, Journal of Econometrics, 46, 229-45.
Fixler, D. and K. Zieschang (1993), ‘An Index Number Approach to Measuring Bank Efficiency: An Application to Mergers’, Journal of Banking and Finance, 17, 437- 50.
Giokas, D, and M. Vassiloglou (1991), ‘A goal programming model for bank assets and liabilities management’, European Journal of Operational Research,
(January), 50 (1), 48-60.
Grifell-Tatje, E. and C. A. K. Lovell (1996), ‘Deregulation and Productivity Decline: The Case of Spanish Savings Banks’, European Economic Review, 40, 1281-1303.
Grifell-Tatje, E. and C. A. K. Lovell (1997), ‘The Sources of Productivity Change in Spanish Banking’, European Journal of Operational Research, 5, 257-64.
Berg, S. A., F. Forsund and E. Jansen (1991), ‘Technical Efficiency of Norwegian Banks: a Nonparametric Approach to Efficiency Measurement’, Journal of
23 Productivity Analysis, 2,127-42.
Berg, S. A., Forsund, F. and Jansen, E. (1992), ‘Malmquist indices of productivity growth during the deregulation of Norwegian banking, 1980-89’, Scandinavian Journal of Economics, 94, S211--S28.
Berger, A. N., W. C. Hunter, and S. G. Timme (1993), ‘The Efficiency of Financial Institutions: a Review and Preview of Research Past, Present, and Future’, Journal of Banking and Finance, 17(2-3),221-50.
Favero, C. and L. Papi (1995), ‘Technical Efficiency and Scale Efficiency in the Italian Banking Sector: A Nonparametric Approach’, Applied Economics, 27, 385- 95.
Humphrey, D. B (1993), ‘Cost and Technical Change: Effects from Bank Deregulation’, Journal of Productivity Analysis, 4 (June ), 5-34.
Humphrey, D.B. (1985), ‘Cost and scale economies in bank intermediation’, in: R. Aspinwall and R. Eisenbeis (eds), Handbook for banking strategy, New York: Wiley & Sons.
Taylor, W. M., R. G. Thompson, R. M. Thrall, and P. S. Dharmapala (1997), ‘DEA/AR Efficiency and Probability of Mexican Banks: A Total Income Model’, European Journal of Operational Research, 98(2), 346-63.
Al-Faraj, T.N., A.S. Alidi, K.A. Bu-Bshait (1993), ‘Evaluation of Bank Branches by Means of Data Envelopment Analysis’, International Journal of Operations and Production Management, 13, 45-52.
24 Kisaka, S.E (2014), ‘X-Efficiency of Commercial Banks in Kenya’, Research Journal of Finance and Accounting, 14(5), 105-110.
Frantz (2015), ‘X-Efficiency among Chinese Banks’, Open Journal of Social Sciences, 3, 69-75
31 December 2014 Turkish Banking System Branch Numbers: https://www.tbb.org.tr/tr/banka-ve-sektor-bilgileri/istatistiki-raporlar/Banka,_Sube_ve_Personel_Bilgileri_/2475
31 December 2014 Turkish Banking System 2014 Employee Numbers:
https://www.tbb.org.tr/tr/banka-ve-sektor-bilgileri/istatistiki-raporlar/aralik--2014---banka,-sube-ve-personel-bilgileri-/1318
31 December 2014 Reports / Banks ve Group Information (Selected Balance sheet Facts)
https://www.tbb.org.tr/tr/banka-ve-sektor-bilgileri/istatistiki-raporlar/Banka_ve_Grup_Bilgileri_
25
APPENDIX
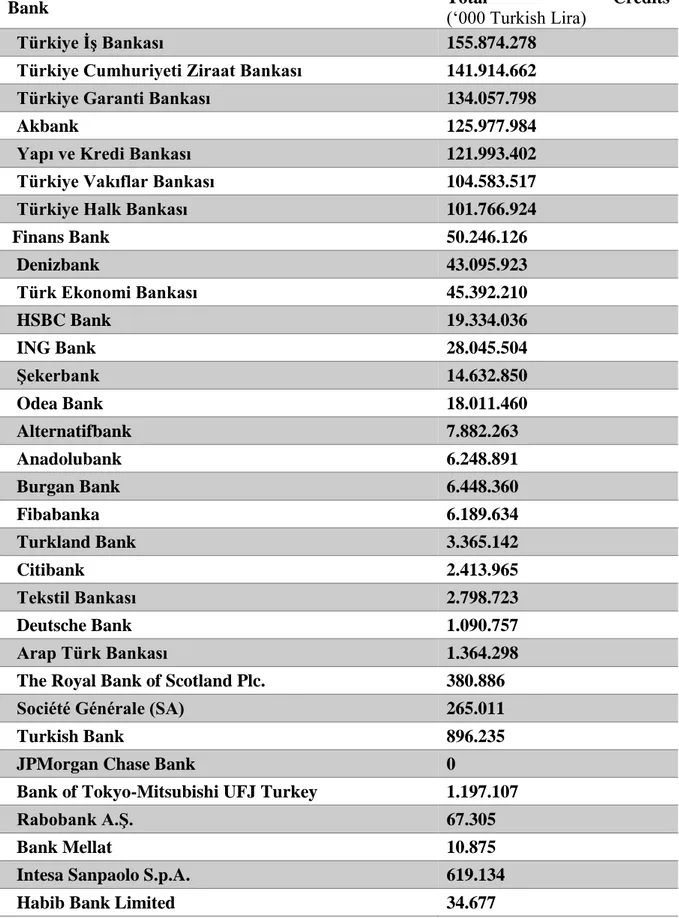
Table 4. Banks and Total Credits as input Y1
Bank Total (‘000 Turkish Lira) Credits
Türkiye İş Bankası 155.874.278
Türkiye Cumhuriyeti Ziraat Bankası 141.914.662
Türkiye Garanti Bankası 134.057.798
Akbank 125.977.984
Yapı ve Kredi Bankası 121.993.402
Türkiye Vakıflar Bankası 104.583.517
Türkiye Halk Bankası 101.766.924
Finans Bank 50.246.126 Denizbank 43.095.923 Türk Ekonomi Bankası 45.392.210 HSBC Bank 19.334.036 ING Bank 28.045.504 Şekerbank 14.632.850 Odea Bank 18.011.460 Alternatifbank 7.882.263 Anadolubank 6.248.891 Burgan Bank 6.448.360 Fibabanka 6.189.634 Turkland Bank 3.365.142 Citibank 2.413.965 Tekstil Bankası 2.798.723 Deutsche Bank 1.090.757 Arap Türk Bankası 1.364.298
The Royal Bank of Scotland Plc. 380.886
Société Générale (SA) 265.011
Turkish Bank 896.235
JPMorgan Chase Bank 0
Bank of Tokyo-Mitsubishi UFJ Turkey 1.197.107
Rabobank A.Ş. 67.305
Bank Mellat 10.875
Intesa Sanpaolo S.p.A. 619.134
26 Table 5. Banks and Total Securities as input Y2
Bank Securities
(‘000 Turkish Lira)
Türkiye İş Bankası 41.829.320
Türkiye Cumhuriyeti Ziraat Bankası 64.562.651
Türkiye Garanti Bankası 43.116.657
Akbank 50.562.521
Yapı ve Kredi Bankası 25.058.369
Türkiye Vakıflar Bankası 23.558.085
Türkiye Halk Bankası 26.844.416
Finans Bank 12.505.508 Denizbank 10.775.949 Türk Ekonomi Bankası 5.369.238 HSBC Bank 1.541.488 ING Bank 3.434.821 Şekerbank 2.599.925 Odea Bank 1.210.259 Alternatifbank 931.383 Anadolubank 1.013.246 Burgan Bank 869.770 Fibabanka 414.549 Turkland Bank 876.913 Citibank 499.978 Tekstil Bankası 216.007 Deutsche Bank 581.682 Arap Türk Bankası 306.267
The Royal Bank of Scotland Plc. 196.172
Société Générale (SA) 108.861
Turkish Bank 75.452
JPMorgan Chase Bank 8.680
Bank of Tokyo-Mitsubishi UFJ Turkey 12.923
Rabobank A.Ş. 469.346
Bank Mellat 142.212
Intesa Sanpaolo S.p.A. 0
27 Table 6. Banks and Labor Price as output P1
Bank Labor Price Ratio
Türkiye İş Bankası 101
Türkiye Cumhuriyeti Ziraat Bankası 77
Türkiye Garanti Bankası 101
Akbank 88
Yapı ve Kredi Bankası 90
Türkiye Vakıflar Bankası 83
Türkiye Halk Bankası 72
Finans Bank 73 Denizbank 77 Türk Ekonomi Bankası 81 HSBC Bank 106 ING Bank 85 Şekerbank 131 Odea Bank 106 Alternatifbank 121 Anadolubank 100 Burgan Bank 104 Fibabanka 92 Turkland Bank 112 Citibank 184 Tekstil Bankası 87 Deutsche Bank 263 Arap Türk Bankası 150
The Royal Bank of Scotland Plc. 364
Société Générale (SA) 105
Turkish Bank 78
JPMorgan Chase Bank 233
Bank of Tokyo-Mitsubishi UFJ Turkey 234
Rabobank A.Ş. 86
Bank Mellat 117
Intesa Sanpaolo S.p.A. 222
28 Table 7. Banks and Labor Price as output P2
Bank Capital Price
Türkiye İş Bankası 0,77
Türkiye Cumhuriyeti Ziraat Bankası 1,05
Türkiye Garanti Bankası 1,59
Akbank 3,14
Yapı ve Kredi Bankası 1,34
Türkiye Vakıflar Bankası 1,66
Türkiye Halk Bankası 1,32
Finans Bank 1,78 Denizbank 1,87 Türk Ekonomi Bankası 3,12 HSBC Bank 9,21 ING Bank 4,63 Şekerbank 1,27 Odea Bank 3,64 Alternatifbank 2,73 Anadolubank 1,75 Burgan Bank 1,26 Fibabanka 8,52 Turkland Bank 4,02 Citibank 28,72 Tekstil Bankası 4,48 Deutsche Bank 5,95 Arap Türk Bankası 1,35
The Royal Bank of Scotland Plc. 25,84
Société Générale (SA) 7,66
Turkish Bank 1,34
JPMorgan Chase Bank 12,70
Bank of Tokyo-Mitsubishi UFJ Turkey 1,05
Rabobank A.Ş. 6,12
Bank Mellat 1,77
Intesa Sanpaolo S.p.A. 6,20
29 Table 8. Banks and Deposit Price as output P3
Bank Deposit Price
Türkiye İş Bankası 6,46%
Türkiye Cumhuriyeti Ziraat Bankası 6,24%
Türkiye Garanti Bankası 6,35%
Akbank 6,33%
Yapı ve Kredi Bankası 5,86%
Türkiye Vakıflar Bankası 7,33%
Türkiye Halk Bankası 6,11%
Finans Bank 8,10% Denizbank 6,59% Türk Ekonomi Bankası 6,69% HSBC Bank 7,14% ING Bank 7,65% Şekerbank 8,29% Odea Bank 5,02% Alternatifbank 10,40% Anadolubank 6,72% Burgan Bank 7,50% Fibabanka 7,55% Turkland Bank 7,24% Citibank 3,92% Tekstil Bankası 6,40% Deutsche Bank 11,31% Arap Türk Bankası 0,92%
The Royal Bank of Scotland Plc. 5,06%
Société Générale (SA) 26,92%
Turkish Bank 5,53%
JPMorgan Chase Bank 24,11%
Bank of Tokyo-Mitsubishi UFJ Turkey 2,01%
Rabobank A.Ş. 40,40%
Bank Mellat 0,21%
Intesa Sanpaolo S.p.A. 35,70%
30 Table 9. Banks and Personnel Expenditures in thousand TL
Bank Personnel Expenditures
(‘000 Turkish Lira)
Türkiye İş Bankası 2.456.179
Türkiye Cumhuriyeti Ziraat Bankası 1.820.293
Türkiye Garanti Bankası 1.928.327
Akbank 1.436.687
Yapı ve Kredi Bankası 1.562.826
Türkiye Vakıflar Bankası 1.232.995
Türkiye Halk Bankası 1.247.781
Finans Bank 941.283 Denizbank 1.009.579 Türk Ekonomi Bankası 824.495 HSBC Bank 601.908 ING Bank 520.554 Şekerbank 341.636 Odea Bank 147.550 Alternatifbank 149.335 Anadolubank 176.607 Burgan Bank 108.613 Fibabanka 112.495 Turkland Bank 71.802 Citibank 86.404 Tekstil Bankası 74.117 Deutsche Bank 30.227 Arap Türk Bankası 42.306
The Royal Bank of Scotland Plc. 27.648
Société Générale 32.613
Turkish Bank 20.559
JPMorgan Chase Bank 14.915
Bank of Tokyo-Mitsubishi UFJ Turkey 13.567
Rabobank 10.787
Bank Mellat 5.625
Intesa Sanpaolo S.p.A. 4.222
31 Table 10. Banks and Personnel Numbers
Bank Personnel Numbers
Türkiye İş Bankası 24.308
Türkiye Cumhuriyeti Ziraat Bankası 23.617
Türkiye Garanti Bankası 19.036
Akbank 16.305
Yapı ve Kredi Bankası 17.457
Türkiye Vakıflar Bankası 14.920
Türkiye Halk Bankası 17.314
Finans Bank 12.830 Denizbank 13.189 Türk Ekonomi Bankası 10.142 HSBC Bank 5.659 ING Bank 6.156 Şekerbank 2,600 Odea Bank 1.388 Alternatifbank 1.231 Anadolubank 1.761 Burgan Bank 1.046 Fibabanka 1.222 Turkland Bank 641 Citibank 469 Tekstil Bankası 852 Deutsche Bank 115 Arap Türk Bankası 282
The Royal Bank of Scotland Plc. 76
Société Générale 31
Turkish Bank 265
JPMorgan Chase Bank 64
Bank of Tokyo-Mitsubishi UFJ Turkey 58
Rabobank 126
Bank Mellat 48
Intesa Sanpaolo S.p.A. 19