arXiv:1506.05360v1 [hep-ex] 17 Jun 2015
η/η
′→
π
0π
0π
0 M. Ablikim1 , M. N. Achasov9,f, X. C. Ai1 , O. Albayrak5 , M. Albrecht4 , D. J. Ambrose44 , A. Amoroso48A,48C, F. F. An1 , Q. An45,a, J. Z. Bai1, R. Baldini Ferroli20A, Y. Ban31
, D. W. Bennett19
, J. V. Bennett5
, M. Bertani20A, D. Bettoni21A, J. M. Bian43
, F. Bianchi48A,48C, E. Boger23,d, I. Boyko23
, R. A. Briere5
, H. Cai50
, X. Cai1,a, O. Cakir40A,b, A. Calcaterra20A, G. F. Cao1, S. A. Cetin40B, J. F. Chang1,a, G. Chelkov23,d,e, G. Chen1, H. S. Chen1,
H. Y. Chen2
, J. C. Chen1
, M. L. Chen1,a, S. J. Chen29
, X. Chen1,a, X. R. Chen26
, Y. B. Chen1,a, H. P. Cheng17 , X. K. Chu31
, G. Cibinetto21A, H. L. Dai1,a, J. P. Dai34
, A. Dbeyssi14
, D. Dedovich23
, Z. Y. Deng1
, A. Denig22 , I. Denysenko23, M. Destefanis48A,48C, F. De Mori48A,48C, Y. Ding27, C. Dong30, J. Dong1,a, L. Y. Dong1, M. Y. Dong1,a, S. X. Du52
, P. F. Duan1
, E. E. Eren40B, J. Z. Fan39
, J. Fang1,a, S. S. Fang1
, X. Fang45,a, Y. Fang1 , L. Fava48B,48C, F. Feldbauer22
, G. Felici20A, C. Q. Feng45,a, E. Fioravanti21A, M. Fritsch14,22, C. D. Fu1
, Q. Gao1 , X. Y. Gao2, Y. Gao39, Z. Gao45,a, I. Garzia21A, C. Geng45,a, K. Goetzen10, W. X. Gong1,a, W. Gradl22, M. Greco48A,48C, M. H. Gu1,a, Y. T. Gu12
, Y. H. Guan1 , A. Q. Guo1 , L. B. Guo28 , Y. Guo1 , Y. P. Guo22 , Z. Haddadi25 , A. Hafner22 , S. Han50 , Y. L. Han1 , X. Q. Hao15 , F. A. Harris42 , K. L. He1 , Z. Y. He30 , T. Held4 , Y. K. Heng1,a, Z. L. Hou1, C. Hu28, H. M. Hu1, J. F. Hu48A,48C, T. Hu1,a, Y. Hu1, G. M. Huang6, G. S. Huang45,a,
H. P. Huang50, J. S. Huang15, X. T. Huang33, Y. Huang29, T. Hussain47, Q. Ji1, Q. P. Ji30, X. B. Ji1, X. L. Ji1,a, L. L. Jiang1
, L. W. Jiang50
, X. S. Jiang1,a, X. Y. Jiang30
, J. B. Jiao33
, Z. Jiao17
, D. P. Jin1,a, S. Jin1 , T. Johansson49 , A. Julin43 , N. Kalantar-Nayestanaki25 , X. L. Kang1 , X. S. Kang30 , M. Kavatsyuk25 , B. C. Ke5 , P. Kiese22, R. Kliemt14, B. Kloss22, O. B. Kolcu40B,i, B. Kopf4, M. Kornicer42, W. K¨uhn24, A. Kupsc49, J. S. Lange24,
M. Lara19 , P. Larin14 , C. Leng48C, C. Li49 , C. H. Li1 , Cheng Li45,a, D. M. Li52 , F. Li1,a, G. Li1 , H. B. Li1 , J. C. Li1 , Jin Li32 , K. Li13 , K. Li33 , Lei Li3 , P. R. Li41 , T. Li33 , W. D. Li1 , W. G. Li1 , X. L. Li33 , X. M. Li12 , X. N. Li1,a, X. Q. Li30, Z. B. Li38, H. Liang45,a, Y. F. Liang36, Y. T. Liang24, G. R. Liao11, D. X. Lin14, B. J. Liu1,
C. X. Liu1 , F. H. Liu35 , Fang Liu1 , Feng Liu6 , H. B. Liu12 , H. H. Liu16 , H. H. Liu1 , H. M. Liu1 , J. Liu1 , J. B. Liu45,a, J. P. Liu50
, J. Y. Liu1
, K. Liu39
, K. Y. Liu27
, L. D. Liu31
, P. L. Liu1,a, Q. Liu41
, S. B. Liu45,a, X. Liu26, X. X. Liu41, Y. B. Liu30, Z. A. Liu1,a, Zhiqiang Liu1, Zhiqing Liu22, H. Loehner25, X. C. Lou1,a,h, H. J. Lu17 , J. G. Lu1,a, R. Q. Lu18 , Y. Lu1 , Y. P. Lu1,a, C. L. Luo28 , M. X. Luo51 , T. Luo42 , X. L. Luo1,a, M. Lv1 , X. R. Lyu41 , F. C. Ma27 , H. L. Ma1 , L. L. Ma33 , Q. M. Ma1 , T. Ma1 , X. N. Ma30 , X. Y. Ma1,a, F. E. Maas14 , M. Maggiora48A,48C, Y. J. Mao31, Z. P. Mao1, S. Marcello48A,48C, J. G. Messchendorp25, J. Min1,a, T. J. Min1, R. E. Mitchell19
, X. H. Mo1,a, Y. J. Mo6
, C. Morales Morales14
, K. Moriya19
, N. Yu. Muchnoi9,f, H. Muramatsu43 , Y. Nefedov23
, F. Nerling14
, I. B. Nikolaev9,f, Z. Ning1,a, S. Nisar8
, S. L. Niu1,a, X. Y. Niu1
, S. L. Olsen32 , Q. Ouyang1,a, S. Pacetti20B, P. Patteri20A, M. Pelizaeus4
, H. P. Peng45,a, K. Peters10
, J. Pettersson49 , J. L. Ping28 , R. G. Ping1 , R. Poling43 , V. Prasad1 , Y. N. Pu18 , M. Qi29
, S. Qian1,a, C. F. Qiao41
, L. Q. Qin33
, N. Qin50 , X. S. Qin1
, Y. Qin31
, Z. H. Qin1,a, J. F. Qiu1
, K. H. Rashid47 , C. F. Redmer22 , H. L. Ren18 , M. Ripka22 , G. Rong1 , Ch. Rosner14 , X. D. Ruan12
, V. Santoro21A, A. Sarantsev23,g, M. Savri´e21B, K. Schoenning49
, S. Schumann22 , W. Shan31, M. Shao45,a, C. P. Shen2, P. X. Shen30, X. Y. Shen1, H. Y. Sheng1, W. M. Song1, X. Y. Song1, S. Sosio48A,48C, S. Spataro48A,48C, G. X. Sun1
, J. F. Sun15
, S. S. Sun1
, Y. J. Sun45,a, Y. Z. Sun1
, Z. J. Sun1,a, Z. T. Sun19 , C. J. Tang36 , X. Tang1 , I. Tapan40C, E. H. Thorndike44 , M. Tiemens25 , M. Ullrich24 , I. Uman40B, G. S. Varner42, B. Wang30, B. L. Wang41, D. Wang31, D. Y. Wang31, K. Wang1,a, L. L. Wang1, L. S. Wang1, M. Wang33
, P. Wang1
, P. L. Wang1
, S. G. Wang31
, W. Wang1,a, X. F. Wang39
, Y. D. Wang14
, Y. F. Wang1,a, Y. Q. Wang22
, Z. Wang1,a, Z. G. Wang1,a, Z. H. Wang45,a, Z. Y. Wang1
, T. Weber22
, D. H. Wei11
, J. B. Wei31 , P. Weidenkaff22, S. P. Wen1, U. Wiedner4, M. Wolke49, L. H. Wu1, Z. Wu1,a, L. G. Xia39, Y. Xia18, D. Xiao1,
Z. J. Xiao28
, Y. G. Xie1,a, Q. L. Xiu1,a, G. F. Xu1 , L. Xu1
, Q. J. Xu13
, Q. N. Xu41
, X. P. Xu37
, L. Yan45,a, W. B. Yan45,a, W. C. Yan45,a, Y. H. Yan18
, H. J. Yang34 , H. X. Yang1 , L. Yang50 , Y. Yang6 , Y. X. Yang11 , H. Ye1 , M. Ye1,a, M. H. Ye7, J. H. Yin1, B. X. Yu1,a, C. X. Yu30, H. W. Yu31, J. S. Yu26, C. Z. Yuan1, W. L. Yuan29,
Y. Yuan1, A. Yuncu40B,c, A. A. Zafar47, A. Zallo20A, Y. Zeng18, B. X. Zhang1, B. Y. Zhang1,a, C. Zhang29, C. C. Zhang1
, D. H. Zhang1
, H. H. Zhang38
, H. Y. Zhang1,a, J. J. Zhang1
, J. L. Zhang1
, J. Q. Zhang1 , J. W. Zhang1,a, J. Y. Zhang1
, J. Z. Zhang1 , K. Zhang1 , L. Zhang1 , S. H. Zhang1 , X. Y. Zhang33 , Y. Zhang1 , Y. N. Zhang41, Y. H. Zhang1,a, Y. T. Zhang45,a, Yu Zhang41, Z. H. Zhang6, Z. P. Zhang45, Z. Y. Zhang50, G. Zhao1,
J. W. Zhao1,a, J. Y. Zhao1
, J. Z. Zhao1,a, Lei Zhao45,a, Ling Zhao1
, M. G. Zhao30 , Q. Zhao1 , Q. W. Zhao1 , S. J. Zhao52 , T. C. Zhao1
, Y. B. Zhao1,a, Z. G. Zhao45,a, A. Zhemchugov23,d, B. Zheng46
, J. P. Zheng1,a, W. J. Zheng33, Y. H. Zheng41, B. Zhong28, L. Zhou1,a, Li Zhou30, X. Zhou50, X. K. Zhou45,a, X. R. Zhou45,a, X. Y. Zhou1
, K. Zhu1
, K. J. Zhu1,a, S. Zhu1
, X. L. Zhu39
, Y. C. Zhu45,a, Y. S. Zhu1
, Z. A. Zhu1
, J. Zhuang1,a, L. Zotti48A,48C, B. S. Zou1
, J. H. Zou1 (BESIII Collaboration) 1
Institute of High Energy Physics, Beijing 100049, People’s Republic of China 2
Beihang University, Beijing 100191, People’s Republic of China 3
4 Bochum Ruhr-University, D-44780 Bochum, Germany 5
Carnegie Mellon University, Pittsburgh, Pennsylvania 15213, USA 6
Central China Normal University, Wuhan 430079, People’s Republic of China 7
China Center of Advanced Science and Technology, Beijing 100190, People’s Republic of China
8 COMSATS Institute of Information Technology, Lahore, Defence Road, Off Raiwind Road, 54000 Lahore, Pakistan 9
G.I. Budker Institute of Nuclear Physics SB RAS (BINP), Novosibirsk 630090, Russia 10
GSI Helmholtzcentre for Heavy Ion Research GmbH, D-64291 Darmstadt, Germany 11 Guangxi Normal University, Guilin 541004, People’s Republic of China
12
GuangXi University, Nanning 530004, People’s Republic of China 13
Hangzhou Normal University, Hangzhou 310036, People’s Republic of China 14Helmholtz Institute Mainz, Johann-Joachim-Becher-Weg 45, D-55099 Mainz, Germany
15
Henan Normal University, Xinxiang 453007, People’s Republic of China 16
Henan University of Science and Technology, Luoyang 471003, People’s Republic of China 17 Huangshan College, Huangshan 245000, People’s Republic of China
18
Hunan University, Changsha 410082, People’s Republic of China 19
Indiana University, Bloomington, Indiana 47405, USA 20
(A)INFN Laboratori Nazionali di Frascati, I-00044, Frascati, Italy; (B)INFN and University of Perugia, I-06100, Perugia, Italy
21
(A)INFN Sezione di Ferrara, I-44122, Ferrara, Italy; (B)University of Ferrara, I-44122, Ferrara, Italy 22
Johannes Gutenberg University of Mainz, Johann-Joachim-Becher-Weg 45, D-55099 Mainz, Germany 23Joint Institute for Nuclear Research, 141980 Dubna, Moscow region, Russia
24
Justus Liebig University Giessen, II. Physikalisches Institut, Heinrich-Buff-Ring 16, D-35392 Giessen, Germany 25
KVI-CART, University of Groningen, NL-9747 AA Groningen, The Netherlands 26 Lanzhou University, Lanzhou 730000, People’s Republic of China 27
Liaoning University, Shenyang 110036, People’s Republic of China 28
Nanjing Normal University, Nanjing 210023, People’s Republic of China 29
Nanjing University, Nanjing 210093, People’s Republic of China 30
Nankai University, Tianjin 300071, People’s Republic of China 31
Peking University, Beijing 100871, People’s Republic of China 32Seoul National University, Seoul, 151-747 Korea 33
Shandong University, Jinan 250100, People’s Republic of China 34
Shanghai Jiao Tong University, Shanghai 200240, People’s Republic of China 35
Shanxi University, Taiyuan 030006, People’s Republic of China 36 Sichuan University, Chengdu 610064, People’s Republic of China
37
Soochow University, Suzhou 215006, People’s Republic of China 38
Sun Yat-Sen University, Guangzhou 510275, People’s Republic of China 39Tsinghua University, Beijing 100084, People’s Republic of China 40
(A)Istanbul Aydin University, 34295 Sefakoy, Istanbul, Turkey; (B)Dogus University, 34722 Istanbul, Turkey; (C)Uludag University, 16059 Bursa, Turkey
41University of Chinese Academy of Sciences, Beijing 100049, People’s Republic of China 42
University of Hawaii, Honolulu, Hawaii 96822, USA 43
University of Minnesota, Minneapolis, Minnesota 55455, USA 44 University of Rochester, Rochester, New York 14627, USA
45 University of Science and Technology of China, Hefei 230026, People’s Republic of China 46
University of South China, Hengyang 421001, People’s Republic of China 47
University of the Punjab, Lahore-54590, Pakistan
48 (A)University of Turin, I-10125, Turin, Italy; (B)University of Eastern Piedmont, I-15121, Alessandria, Italy; (C)INFN, I-10125, Turin, Italy
49
Uppsala University, Box 516, SE-75120 Uppsala, Sweden 50Wuhan University, Wuhan 430072, People’s Republic of China 51
Zhejiang University, Hangzhou 310027, People’s Republic of China 52
Zhengzhou University, Zhengzhou 450001, People’s Republic of China
a Also at State Key Laboratory of Particle Detection and Electronics, Beijing 100049, Hefei 230026, People’s Republic of China
b Also at Ankara University,06100 Tandogan, Ankara, Turkey c Also at Bogazici University, 34342 Istanbul, Turkey
d Also at the Moscow Institute of Physics and Technology, Moscow 141700, Russia e Also at the Functional Electronics Laboratory, Tomsk State University, Tomsk, 634050, Russia
g Also at the NRC ”Kurchatov Institute, PNPI, 188300, Gatchina, Russia hAlso at University of Texas at Dallas, Richardson, Texas 75083, USA
i Currently at Istanbul Arel University, 34295 Istanbul, Turkey
Based on a sample of 1.31 × 10⁹ J/ψ events collected with the BESIII detector at the BEPCII collider, Dalitz plot analyses of selected 79,625 η → π+
π−π0 events, 33,908 η → π0 π0 π0 events and 1,888 η′ →π0 π0 π0
events are performed. The measured matrix elements of η → π+ π−π0
are in reasonable agreement with previous measurements. The Dalitz plot slope parameters of η → π0π0π0 and η′→π0
π0 π0
are determined to be −0.055±0.014±0.004 and −0.640±0.046±0.047, respectively, where the first uncertainties are statistical and the second systematic. Both values are consistent with previous measurements, while the precision of the latter one is improved by a factor of three. Final state interactions are found to have an important role in those decays.
PACS numbers: 13.66.Bc, 14.40.Be
I. INTRODUCTION
Since the electromagnetic contribution to the
isospin violating decays η/η′ → 3π is strongly
sup-pressed [1–3], the decays are induced dominantly by the strong interaction. Therefore, they offer a unique opportunity to investigate fundamental sym-metries and measure the u − d quark mass differ-ence. At the tree level of chiral perturbation the-ory (ChPT), the predicted decay width of η →
π+π−π0[4] is about 70 eV, which is much lower than
the experimental value of 300±11 eV [5]. To explain this discrepancy, considerable theoretical effort has been made, including a dispersive approach [6] and non-relativistic effective field theory [7]. Recently, it was found that higher order terms in ChPT at next-to leading order (NLO) [8] and next-next-next-to lead-ing order (NNLO) [9] are crucial for a comparison with experimental results, where ππ re-scattering between the final state pions is present.
To distinguish between the different theoretical approaches, precise measurements of the matrix
el-ements for η → π+π−π0 and the decay width are
important. For the three-body decay η → π+π−π0,
the decay amplitude square can be parameterized as [10]
|A(X, Y )|2= N (1 + aY + bY2+ cX + dX2
+eXY + f Y3+ . . .), (1)
where X and Y are the two independent Dalitz plot variables defined as X = √ 3 Q(Tπ+− Tπ−), Y = 3Tπ0 Q − 1, (2)
where Tπ denotes the kinetic energy of a given pion
in the η rest frame, Q = mη− mπ+− mπ−− mπ0 is
the excess energy of the reaction, mη/πare the
nom-inal masses from PDG [5], and N is a normalization
factor. The coefficients a, b, c, . . . are the Dalitz plot parameters, which are used to test theoretical pre-dictions and fundamental symmetries. For example, a non-zero value for the odd powers of X, c and e, implies the violation of charge conjugation.
The Dalitz plot distribution of η → π+π−π0 has
been analyzed previously by various experiments [5].
Using a data sample corresponding to about 5 × 10⁶
η mesons produced in e+e− → φ → γη
reac-tions, KLOE [10] provided the most precise measure-ment, where the Dalitz plot parameters c and e are found to be consistent with zero within uncertain-ties, and f was measured for the first time. Most re-cently, the WASA-at-COSY collaboration analyzed
η → π+π−π0 based on a data sample
correspond-ing to 1.2 × 10⁷ η mesons produced in pd →3He η
reactions at 1 GeV [11]. The results are in agree-ment with those from KLOE within two standard deviations.
For η/η′ → π0π0π0, the density distribution of
the Dalitz plot has threefold symmetry due to the three identical particles in the final state. Hence, the density distribution can be parameterized using polar variables [12] Z = X2+ Y2=2 3 3 X i=1 (3Ti Q − 1) 2, (3)
and the expansion
|A(Z)|2= N (1 + 2αZ + . . .), (4)
where α is the slope parameter, Q = mη/η′ − 3mπ0,
Tidenotes the kinetic energies of each π0in the η/η′
rest frame and N is a normalization factor. A non-zero α indicates final-state interactions.
The world averaged value of the Dalitz plot slope
parameter α = −0.0315 ± 0.0015 [5] for η → π0π0π0
is dominated by the measurements of the Crystal Ball [12], WASA-at-COSY [13] and KLOE [14] ex-periments. Interestingly, the predicted value for α
in NLO and NNLO ChPT [9, 15, 16] is positive, al-though the theoretical uncertainties are quite large.
The decay η′ → π0π0π0 has been explored with
very limited statistics only. The GAMS-2000
ex-periment reported the first observation of η′ →
π0π0π0[17] and measured the Dalitz plot slope with
62 reconstructed events. This result was later up-dated to be α = −0.59±0.18 [18] with 235 events. In 2012, the same decay was investigated by BESIII [19]
using a data sample of 225 × 106 J/ψ events. The
branching fraction was measured to be about twice as large as the previous measurements, but the Dalitz plot slope parameter was not measured.
In this paper, the matrix elements for η →
π+π−π0 and η/η′ → π0π0π0 are measured, where
the Dalitz plot slope parameter of η′ → π0π0π0 is
determined with higher precision than the existing measurements. This analysis is performed using a
sample of 1.31 × 10⁹ J/ψ events accumulated with
the BESIII detector. Radiative J/ψ → γη(′)decays
are exploited to access the η and η′ mesons.
II. DETECTOR AND MONTE CARLO
SIMULATION
BEPCII is a double-ring e+e−collider working at
center-of-mass energies from 2.0 to 4.6 GeV. The BESIII [20] detector at BEPCII collider, with a geometrical acceptance of 93% of 4π stereo angle, operates in a 1.0 T (0.9 T in 2012, when about 83% of the data sample were collected) magnetic field provided by a superconducting solenoid mag-net. The detector is composed of a helium-based drift chamber (MDC), a plastic-scintillator time-of-flight (TOF) system, a CsI(Tl) electromagnetic calorimeter (EMC) and a multi-layer resistive plate counter system (MUC). The charged-particle mo-mentum resolution at 1.0 GeV/c is 0.5%, and the specific energy loss (dE/dx) resolution is better than 6%. The spatial resolution of the MDC is better than 130 µm. The time resolution of the TOF is 80 ps in the barrel and 110 ps in the endcaps. The energy resolution of the EMC at 1.0 GeV/c is 2.5% (5%) in the barrel (endcaps), and the position res-olution is better than 6 mm (9 mm) in the barrel (endcaps). The position resolution in the MUC is better than 2 cm.
Monte Carlo (MC) simulations are used to esti-mate backgrounds and determine the detection effi-ciencies. The GEANT4-based [21] simulation soft-ware BOOST [22] includes the geometric and ma-terial description of the BESIII detector, detector response, and digitization models, as well as the tracking of the detector running conditions and
per-formance. The production of the J/ψ resonance is simulated with KKMC [23, 24], while the decays are generated with EVTGEN [25] for known de-cay modes with branching fractions being set to the world average values [5] and by LUNDCHARM [26] for the remaining unknown decays. We use a
sam-ple of 1.2 × 10⁹simulated J/ψ events where the J/ψ
decays generically (‘inclusive MC sample’) to iden-tify background contributions. The analysis is per-formed in the framework of the BESIII offline soft-ware system (BOSS) [27] which takes care of the detector calibration, event reconstruction, and data storage.
III. MEASUREMENT OF THE MATRIX
ELEMENTS FOR THE DECAY η → π+ π−π0 For the reconstruction of J/ψ → γη with η →
π+π−π0 and π0 → γγ, events consistent with the
topology π+π−γγγ are selected and the following
criteria are applied. For each candidate event, we require that two charged tracks are reconstructed in the MDC and the polar angles of the tracks sat-isfy | cos θ| < 0.93. The tracks are required to pass the interaction point within ±10 cm along the beam direction and within 1 cm in the plane
perpendic-ular to the beam. Photon candidates are
recon-structed using clusters of energy deposited in the EMC. The energy deposited in nearby TOF coun-ters is included in EMC measurements to improve the reconstruction efficiency and the energy reso-lution. Photon candidates are required to have a deposited energy larger than 25 MeV in the barrel region (| cos θ| < 0.80) and 50 MeV in the endcap region (0.86 < | cos θ| < 0.92). In order to eliminate clusters associated with charged tracks, the angle between the directions of any charged track and the
photon candidate must be larger than 10◦.
Require-ments of EMC cluster timing with respect to the event start time are used to suppress electronic noise and energy deposits unrelated to the event. Events with exactly two charged tracks of opposite charge and at least three photon candidates that satisfy the above requirements are retained for further analysis. The photon candidate with the largest energy in the event is regarded as the radiative photon
orig-inating from the J/ψ decays. For each π+π−γγγ
combination, a six constraints (6C) kinematic fit is performed. The fit enforces energy-momentum conservation, and the invariant masses of γγ and
π+π−π0 are constrained to the nominal π0 and η
mass, respectively. Events with a χ2 from the
6C-kinematic fit (χ2
6C) less than 80 are accepted for
pho-) 2 ) (GeV/c 0 π -π + π M( 0.45 0.5 0.55 0.6 0.65 ) 2 Entries/( 2 MeV/c 1 10 2 10 3 10 4 10
FIG. 1. Invariant mass spectrum of π+ π−π0
obtained after the kinematic fit without the η mass constraint ap-plied. The dots with error bars are for data and the shaded histogram is for background events estimated from the inclusive MC sample.
ton candidates in an event, only the combination
with the smallest χ2
6C is retained. To reject possible
backgrounds with two or four photons in the final state, kinematic fits are also performed with four constraints enforcing energy-momentum
conserva-tion under the J/ψ → π+π−γγγ signal hypothesis as
well as the J/ψ → π+π−γγγγ and J/ψ → π+π−γγ
background hypotheses. Events with a χ2
4Cvalue for
the signal hypothesis greater than that of the χ2
4C
for any background hypothesis are discarded. After applying the selection criteria described
above, 79,625 η → π+π−π0 candidate events are
selected. To estimate the background contribution under the η peak, we perform an alternative selec-tion, where the η mass constraint in the kinematic fit is removed. The resulting invariant mass spec-trum of π+π−π0, M (π+π−π0), is shown in Fig. 1.
A significant η signal is observed with a low back-ground level. The backback-ground contamination is es-timated to be 0.2% from η sideband regions,
de-fined as 0.49 < M (π+π−π0) < 0.51 GeV/c2 and
0.59 < M (π+π−π0) < 0.61 GeV/c2, in the data
sample. In addition, a sample of 1.2 × 10⁹
inclu-sive MC J/ψ decays is used to investigate potential backgrounds. Using the same selection criteria, the
distribution of M (π+π−π0) for this sample is
de-picted as the shaded histogram in Fig. 1. No peak-ing background remains around the η signal region. The background contamination is estimated to be about 0.1%, and is therefore not considered in the extraction of the Dalitz plot parameters.
The Dalitz plot in the variables X and Y is shown in Fig. 2 for the selected events. The X and Y projections are shown in Fig. 3. For comparison,
X
-1 -0.5 0 0.5 1 Y -1 -0.5 0 0.5 1FIG. 2. Dalitz plot for η → π+π−π0in the data sample.
the corresponding distributions obtained from MC
events with phase space distributed η → π+π−π0
decays are also shown. The phase space MC distri-butions of X and Y differ visibly from those in the data sample, which indicates there could be large contributions from higher order terms in ChPT.
In order to investigate the dynamics of η →
π+π−π0, the Dalitz plot matrix elements of the
de-cay amplitude given in Eq. (1) are obtained from an unbinned maximum likelihood fit to the data. To account for the resolution and detection efficiency, the amplitude is convoluted with a function σ(X, Y ) parameterizing the resolution, and multiplied by a function ε(X, Y ) parameterizing the detection effi-ciency. Both functions are derived from MC simu-lations. The sum of two Gaussian functions is used for σ(X, Y ), while ε(X, Y ) is a quadratic function. After normalization, one derives the probability den-sity function P(X, Y ), which is applied in the fit:
P(X, Y ) =
(|A(X, Y )|2⊗ σ(X, Y ))ε(X, Y )
R
DP(|A(X, Y )|2⊗ σ(X, Y ))ε(X, Y )dXdY
, (5)
where A(X, Y ) is the decay amplitude of η →
π+π−π0 and the integral taken over the Dalitz plot
(DP) accounts for normalization.
For the fit, the negative log-likelihood value − ln L = −
Nevent
X
i=1
ln P(Xi, Yi) (6)
is minimized, where P(Xi, Yi) is evaluated for each
event i, and the sum includes all accepted events. We perform two fits to the data. For the first fit, we assume charge conjugation invariance and we fit
X -1 -0.5 0 0.5 1 Entries/0.05 0 1000 2000 3000 Data Phase space Fit (a) Y -1 -0.5 0 0.5 1 Entries/0.05 0 1000 2000 3000 Data Phase space Fit (b)
FIG. 3. Projections of the Dalitz plot (a) X and (b) Y for η → π+ π−π0
obtained from data (dots with error bars) and phase space distributed MC events (dashed line). The result of the fit described in the text (solid line) is also plotted.
the parameters for the matrix elements a, b, d and f only, while c and e are set to zero. For the second fit, we include the possibility of charge conjugation vio-lation and the latter two parameters are also allowed to vary in the fit.
In the case of charge conjugation invariance, the fit yields the following parameters (with statistical errors only) a = −1.128 ± 0.015, b = 0.153 ± 0.017, d = 0.085 ± 0.016, f = 0.173 ± 0.028. (7)
The corresponding correlation matrix of the fit pa-rameters is given by b d f a −0.265 −0.389 −0.749 b 1.000 0.311 −0.300 d 1.000 0.079 . (8)
The fit projections on X and Y , illustrated as the solid histograms in Fig. 3, indicate that the fit can describe the data well. The obtained parameters are in agreement with previous measurements within two standard deviations.
If the possibility of charge conjugation violation is included in the decay amplitude, the fit to data yields the following results (with statistical uncer-tainties only) a = −1.128 ± 0.015, b = 0.153 ± 0.017, c = (0.047 ± 0.851) × 10−2, d = 0.085 ± 0.016, e = 0.017 ± 0.019, f = 0.173 ± 0.028. (9)
The corresponding correlation matrix of the fit pa-rameters is given by b c d e f a −0.265 −0.003 −0.388 0.001 −0.749 b 1.000 −0.001 0.311 0.016 −0.300 c 1.000 0.003 −0.592 0.003 d 1.000 0.016 0.079 e 1.000 −0.007 . (10)
Compared with the fit results assuming charge-parity conservation, the derived parameters a, b, d and f are almost unchanged. The parameters c and e are consistent with zero within one standard de-viation, which indicates that there is no significant
charge-parity violation in decay η → π+π−π0.
Com-paring the two fits, the significance of charge-parity violation is determined to be only 0.65σ.
The fit procedure is verified with MC events that were generated based on the Dalitz plot matrix
ele-ments from the fit to the data. Following the same reconstruction and fitting procedure as applied to the data sample, the extracted values are consistent with the input values of the simulation.
IV. MEASUREMENT OF THE MATRIX
ELEMENT FOR THE DECAYS η → π0π0π0 AND η′→π0
π0 π0
For the reconstruction of J/ψ → γη/η′ with
η/η′ → π0π0π0 and π0 → γγ, events containing at
least seven photon candidates and no charged tracks are selected. The selection criteria for photons are
the same as those described above for η → π+π−π0,
except the requirement of the angle between the pho-ton candidates and any charged track. Requirements of EMC cluster timing with respect to the most en-ergetic photon are also used. Again, the photon with the largest energy in the event is assumed to be the radiative photon originating from the J/ψ decay. From the remaining candidates, pairs of
pho-ton are combined into π0 → γγ candidates which
are subjected to a kinematic fit, where the invariant mass of the photon pair is constrained to the
nomi-nal π0mass. The χ2value of this kinematic fit with
one degree of freedom is required to be less than 25.
To suppress the π0 mis-combination, the π0 decay
angle θdecay, defined as the polar angle of a photon
in the corresponding γγ rest frame, is required to
satisfy | cos θdecay| < 0.95. From the accepted π0
candidates and the corresponding radiative photon,
γπ0π0π0 combinations are formed. A kinematic fit
with seven constraints (7C) is performed, enforcing energy conservation and constraining the invariant
mass of γγ pairs to the nominal π0 mass. If more
than one combination is found in an event, only the
one with the smallest χ27C is retained. Events with
χ2
7C< 70 are accepted for further analysis.
For η′ → π0π0π0, backgrounds from J/ψ →
ωπ0π0 are suppressed by vetoing events with
|M(γπ0)−m
ω| < 0.05 GeV/c2, where M (γπ0) is the
invariant mass of the γπ0combination closest to the
nominal ω mass (mω) [5]. Peaking backgrounds for
the process η′→ π0π0π0 can arise from J/ψ → γη′
with η′ → ηπ0π0. To suppress these backgrounds,
a 7C kinematic fit under the J/ψ → γηπ0π0
hy-pothesis is performed. Events for which the χ2
value obtained for the background hypothesis is less
than that obtained for the γπ0π0π0 hypothesis are
discarded. In addition, events with an invariant
mass of at least one γγ pair in the mass window
|M(γγ) − mη| < 0.03 GeV/c2 are rejected.
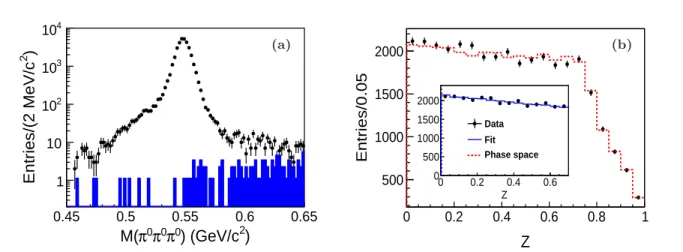
For η → π0π0π0, the invariant mass spectrum
of π0π0π0 is shown in Fig. 4(a). A very clean η
signal is observed. The invariant mass spectrum
of π0π0π0 obtained from the inclusive MC sample
is also shown, indicating a very low background level of 0.3% under the η signal. The background is also estimated from the data using η sideband regions (0.49 < M (π0π0π0) < 0.51 GeV/c2 and
0.59 < M (π0π0π0) < 0.61 GeV/c2), and is found
to be about 1%. For the determination of the slope parameter α, the backgrounds are neglected.
To improve the energy resolution of the π0
can-didates and thus the resolution of the Dalitz plot variable Z, the kinematic fit as described above is repeated with the additional constraint that the
π0π0π0invariant mass corresponds to the nominal η
mass.
Finally, a clean sample of 33,908 η → π0π0π0
events is selected. The distribution of the variable Z, defined in Eq. (3), is displayed in Fig. 4(b). The dotted histogram in the same plot represents the MC simulation of phase space events with α = 0, as expected at leading order in ChPT. Due to the kinematic boundaries, the interval of 0 < Z < 0.7, corresponding to the region of phase space in which the Z distribution is flat, is used to extract the slope parameter α from the data.
Analogous to the measurement for η → π+π−π0,
an unbinned maximum likelihood fit is performed on the Z distribution of the data to extract the slope parameter. The probability density function is constructed with Eq. (4) convoluted with a dou-ble Gaussian function and multiplied by a first-order Chebychev polynomial to account for the res-olution σ(Z) and detection efficiency ε(Z), respec-tively. Both the resolution and the efficiency func-tions are obtained from the phase space distributed MC events. The fit yields α = −0.055±0.014, where the error is statistical only. In the inset of Fig. 4(b) the result of the fit is overlaid on the distribution for the data.
For η′ → π0π0π0, the invariant mass spectrum
of π0π0π0 is shown in Fig. 5(a), where an η′
sig-nal is clearly visible. The asig-nalysis of the J/ψ inclu-sive decay samples shows that the dominant
back-ground contribution is from η′ → ηπ0π0.
Addi-tional backgrounds are created by J/ψ decays to the
same final state, e.g., J/ψ → ωπ0π0 with ω → γπ0.
To evaluate the contribution from η′ → ηπ0π0,
4×10⁶J/ψ → γη′events with η′→ ηπ0π0are
gener-ated. The η′decay dynamics are modeled according
to the results of the Dalitz plot analysis given in
Ref. [28]. The invariant mass spectrum of π0π0π0is
also shown in Fig. 5(a), where the number of events is scaled to the number of J/ψ events in the data sample, taking into account the branching fractions
)
2) (GeV/c
0π
0π
0π
M(
0.45 0.5 0.55 0.6 0.65 ) 2 Entries/(2 MeV/c 1 10 2 10 3 10 4 10 (a)Z
0 0.2 0.4 0.6 0.8 1 Entries/0.05 500 1000 1500 2000 Z 0 0.2 0.4 0.6 0 500 1000 1500 2000 Data Fit Phase space (b)FIG. 4. (a) Invariant mass spectrum of π0π0π0 for η → π0π0π0 obtained from data (dots with error bars) and estimated from the inclusive MC sample (shaded histogram). (b) Distribution of the kinematic variable Z for η → π0
π0 π0
obtained from data (dots with error bars) and phase space distributed MC events, where the Z distribution is flat from Z = 0 to Z ∼ 0.76 and then drops to zero at Z = 1 (dashed line). The inset shows the Z range which is used for the fit to extract the slope parameter α. Overlaid on the data is the result of the fit (solid line in the inset).
)
2) (GeV/c
0π
0π
0π
M(
0.8 0.9 1 1.1 ) 2 Entries/(3 MeV/c 1 10 2 10 (a)Z
0 0.2 0.4 0.6 0.8 1 Entries/0.05 0 100 200 300 400 Z 0 0.2 0.4 0 100 200 300 400 Data 0 π 0 π η → ’ η non-peak bg Fit Phase space (b)FIG. 5. (a) Invariant mass spectrum of π0 π0
π0
for η′ → π0 π0
π0
obtained from the data (dots with error bars), estimated from the inclusive MC sample (shaded), and η′ →ηπ0
π0
MC events (hatched). (b) Distribution of the kinematic variable Z for η′ →π0π0π0 obtained from the data (dots with error bars), phase space distributed MC events (dashed line), η′ sideband regions (shaded) and η′→ηπ0
π0
MC events (hatched). The result of the fit (solid line) is overlaid on the data in the insert.
background contributions (e.g. from J/ψ → ωπ0π0)
are estimated from the data sample using the η′
side-band regions, defined as 0.845 < M (π0π0π0) < 0.88
GeV/c2 and 1.008 < M (π0π0π0) < 1.043 GeV/c2
(Fig. 5(a)). The total background contamination is
estimated to be 11.2% in the η′ signal mass region
(0.92 < M (π0π0π0) < 0.99 GeV/c2).
After requiring the invariant mass of π0π0π0 to
be in the η′signal mass region, the distribution of Z
is shown in Fig. 5(b). The MC simulation of phase space events clearly deviates from the data.
Analo-gous to η → π0π0π0, the slope parameter α is
deter-mined from an unbinned maximum likelihood fit to data in the range 0 < Z < 0.45 with 1,888 events, taking into account the detection efficiency and
reso-lution. The background estimated from η′ → ηπ0π0
MC events and the η′ sideband regions is accounted
for by subtracting the likelihood for these events from the likelihood for data. The normalization of background contribution is fixed at its expected in-tensity.
0.046, where the error is statistical only. The result of the fit is overlaid on the Z distribution for the data in the inset of Fig. 5(b).
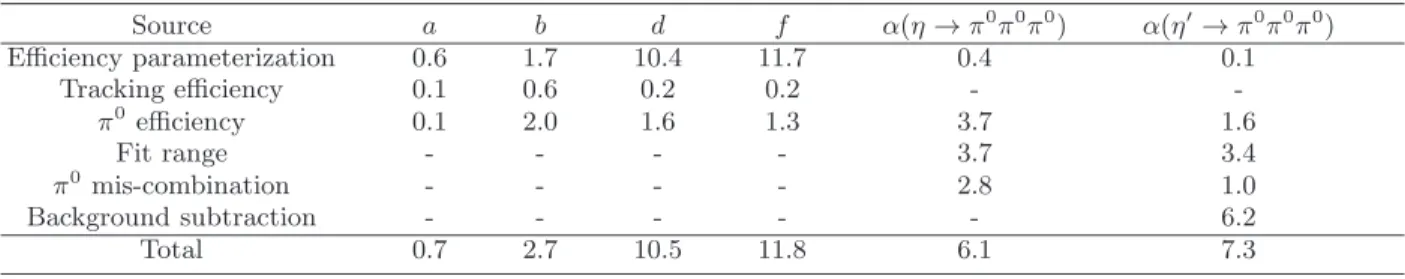
V. SYSTEMATIC UNCERTAINTIES
Various sources of systematic uncertainties on the measured Dalitz plot matrix elements have been in-vestigated. These include uncertainties due to the efficiency parameterization and uncertainties
aris-ing from differences in the trackaris-ing and π0
recon-struction between the data and MC samples. For
the measurement of α for η/η′ → π0π0π0,
addi-tional uncertainties due to the fit range and π0
mis-combination are considered. Uncertainties for α due
to the background estimation for η′ → π0π0π0 are
also assigned. All the above contributions are sum-marized in Table I, where the total systematic uncer-tainty is given by the quadratic sum of the individ-ual errors, assuming all sources to be independent. Assuming the correlation factor between each sys-tematic errors is 1, then the correlation matrix for systematic errors of η → π+π−π0is b d f a −0.71 0.99 −0.97 b 1.00 −0.73 0.54 d 1.00 −0.96 . (11)
In the following, the estimation of the individual un-certainties are discussed in detail.
To estimate the uncertainty due to efficiency parameterizations, we perform alternative fits by changing the description of the efficiency from poly-nomial functions to the average efficiencies of local bins. The change in the obtained values for the ma-trix elements from the alternative fits with respect to the default values is assigned as the systematic uncertainty due to the efficiency parameterization.
Differences between the data and MC samples for the tracking efficiency of charged pions are
investi-gated using J/ψ → p¯pπ+π− decays. A
momentum-dependent correction is obtained for charged
pi-ons recpi-onstructed from MC events. Similarly, a
momentum-dependent correction for the π0
effi-ciency in the MC sample is obtained from J/ψ →
π+π−π0 decays. The fits to extract the matrix
ele-ments are repeated as described above, taking into account the efficiency correction for charged pions
and π0. The change of the matrix elements with
respect to the default fit result is assigned as a sys-tematic uncertainty.
The slope parameter α for η/η′ → π0π0π0 is
ex-tracted from a fit to the data in the kinematic re-gion where the Z distribution of phase space is flat.
By altering the fit range to 0 < Z < 0.65(0.68)
for η → π0π0π0 and 0 < Z < 0.43(0.45) for
η′ → π0π0π0 and repeating the fit to the data, the
larger changes in α with respect to the default fits are noted and assigned as the systematic uncertain-ties.
Mis-reconstruction of π0candidates in true signal
events can lead to a wrongly reconstructed position of the event on the Dalitz plot, and therefore affect the fitted parameters. Using signal MC, the possi-ble mis-combination of photons has been studied by matching the generated photon pairs to the selected
π0 candidates. The fraction of events with a
mis-combination of photons is 5.4% for η → π0π0π0and
0.95% for η′ → π0π0π0, respectively. Applying the
fit to the truth-matched simulated events only, the impact on the fit parameters is found to be 2.8% for η → π0π0π0and 1.0% for η′→ π0π0π0, respectively.
This is taken as the systematic uncertainty.
In the determination of α for η′ → π0π0π0,
back-ground contributions are estimated from MC
simu-lations for η′→ ηπ0π0and η′ sideband regions. For
the peaking background from η′ → ηπ0π0, the
un-certainties of the branching fractions for J/ψ → γη′
and η′ → ηπ0π0 taken from Ref. [5] are
consid-ered. In addition, an alternative set of matrix
ele-ment parameters for η′ → ηπ0π0as reported by the
GAMS-4π collaboration in Ref. [28] is used in the MC simulation. The uncertainty from non-peaking backgrounds is estimated by varying the sideband regions to 0.723 < M (π0π0π0) < 0.758 GeV/c2 and
1.063 < M (π0π0π0) < 1.098 GeV/c2.
In order to estimate the impact from the differ-ent resolution of Dalitz plot variables between data and MC sample, we perform alternative fits in which the resolution is varied by ±10% and find that the change of the results is negligible, as expected.
VI. SUMMARY
Using 1.31 × 10⁹ J/ψ events collected with the
BESIII detector, the Dalitz plots of η → π+π−π0
and η/η′ → π0π0π0 are analyzed and the
corre-sponding matrix elements are extracted.
In the case of charge conjugation invariance, the
Dalitz plot matrix elements for η → π+π−π0 are
determined to be
a = −1.128 ± 0.015 ± 0.008,
b = 0.153 ± 0.017 ± 0.004,
d = 0.085 ± 0.016 ± 0.009,
f = 0.173 ± 0.028 ± 0.021,
where the first errors are statistical and the second ones systematic, here and in the following. In Fig. 6
TABLE I. Summary of systematic uncertainties for the measurements of the matrix elements (all values are given in %). Source a b d f α(η → π0 π0 π0 ) α(η′→π0 π0 π0 ) Efficiency parameterization 0.6 1.7 10.4 11.7 0.4 0.1 Tracking efficiency 0.1 0.6 0.2 0.2 - -π0 efficiency 0.1 2.0 1.6 1.3 3.7 1.6 Fit range - - - - 3.7 3.4 π0 mis-combination - - - - 2.8 1.0 Background subtraction - - - 6.2 Total 0.7 2.7 10.5 11.8 6.1 7.3
our measurement is compared to previous measure-ments and theoretical predictions. Our results are in agreement with the two most recent measurements, and consistent with the predictions of the dispersive approach and ChPT at NNLO level.
To investigate the charge conjugation violation in
η → π+π−π0, the matrix elements c and e have been
determined from a fit to the data. The obtained values are consistent with zero, while the other pa-rameters are found to be consistent with those ob-tained from the fit assuming charge conjugation in-variance. No significant charge symmetry breaking is observed.
After taking into account the systematic
uncer-tainties, the slope parameter α for η → π0π0π0 is
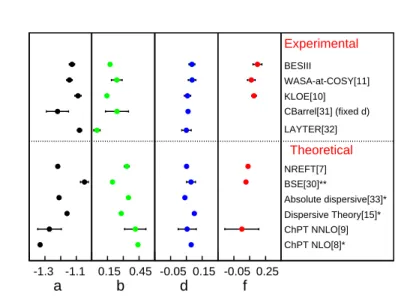
measured to be −0.055 ± 0.014 ± 0.004. A compar-ison to previous works, illustrated in Fig. 7(a), in-dicates that the BESIII result is compatible with the recent results from other experiments and in agreement with the prediction from ChPT at NNLO within two standard deviations of the theoretical un-certainties.
The Dalitz plot slope parameter for η′ → π0π0π0
is measured to be α = −0.640 ± 0.046 ± 0.047, which is consistent with but more precise than previous measurements (Fig. 7(b)). The value deviates sig-nificantly from zero. This implies that final state interactions play an important role in the decay. Up to now, there are just a few predictions about the
slope parameter of η′ → π0π0π0. In Ref. [29], the
slope parameter is predicted to be less than 0.03, which is excluded by our measurement. More re-cently, using a chiral unitary approach, an expan-sion of the decay amplitude up to the fifth and sixth order of X and Y has been used to parameterize the Dalitz plot of η′→ π0π0π0[30]. The coefficient,
which corresponds to α in this paper, is found to be in the range between −2.7 and 0.1, consistent with
our measurement.
ACKNOWLEDGMENTS
The BESIII collaboration thanks the staff of BEPCII and the IHEP computing center for
their strong support. This work is supported
in part by National Key Basic Research Pro-gram of China under Contract No. 2015CB856700; National Natural Science Foundation of China (NSFC) under Contracts Nos. 11175189, 11125525, 11235011, 11322544, 11335008, 11425524; Youth Science Foundation of China under constract No. Y5118T005C; the Chinese Academy of Sci-ences (CAS) Large-Scale Scientific Facility Pro-gram; the CAS Center for Excellence in Parti-cle Physics (CCEPP); the Collaborative Innova-tion Center for Particles and InteracInnova-tions (CICPI); Joint Large-Scale Scientific Facility Funds of the NSFC and CAS under Contracts Nos. 11179007, U1232201, U1332201, U1232101; CAS under Con-tracts Nos. KJCX2-YW-N29, KJCX2-YW-N45; 100 Talents Program of CAS; INPAC and Shanghai Key Laboratory for Particle Physics and Cos-mology; German Research Foundation DFG un-der Contract No. Collaborative Research Center CRC-1044; Istituto Nazionale di Fisica Nucleare, Italy; Ministry of Development of Turkey under Contract No. DPT2006K-120470; Russian Founda-tion for Basic Research under Contract No. 14-07-91152; U.S. Department of Energy under Contracts Nos. DE-FG02-04ER41291, DE-FG02-05ER41374,
DE-FG02-94ER40823, DESC0010118; U.S.
Na-tional Science Foundation; University of Groningen (RuG) and the Helmholtzzentrum fuer Schwerionen-forschung GmbH (GSI), Darmstadt; WCU Program of National Research Foundation of Korea under Contract No. R32-2008-000-10155-0.
[1] J. S. Bell and D. G. Sutherland, Nucl. Phys. B 4, 315 (1968).
-1.3 -1.1 a 0 5 10 0.15 0.45 b 0 5 10 -0.05 0.15 d 0 5 10 -0.05 0.25 f ChPT NLO[8]* ChPT NNLO[9] Dispersive Theory[15]* Absolute dispersive[33]* BSE[30]** NREFT[7] Theoretical LAYTER[32] CBarrel[31] (fixed d) KLOE[10] WASA-at-COSY[11] BESIII Experimental
FIG. 6. Comparison of experimental measurements and theoretical predictions of the matrix elements for η → π+
π−π0
. ∗Theoretical predictions without error. ∗∗BSE denotes Bethe-Salpeter Equation.
-0.05 0 0.05 0 5 10 ) 0 π 3 → η ( α ChPT NLO[8]* Dispersive Theory[15]* BSE[30]** ChPT NNLO[9] Theoretical GAMS-2000[36] CBarrel[35] SND[34] CBall[12] WASA at COSY[13] KLOE[14] Average[5] BESIII Experimental (a) -1 -0.5 0 α(η’→3π0) GAMS-2000[17] [18] π GAMS-4 BESIII (b)
FIG. 7. Comparison of experimental measurements and theoretical predictions of the matrix elements for (a) η → π0 π0 π0 and (b) η′→π0 π0 π0
. ∗Theoretical predictions without error. ∗∗BSE denotes Bethe-Salpeter Equation.
460, 127 (1996).
[3] C. Ditsche, B. Kubis, and U. G. Meissner, Eur. Phys. J. C 60, 83 (2009).
[4] H. Osborn and D. J. Wallace, Nucl. Phys. B 20, 23 (1970); J. A. Cronin, Phys. Rev. 161, 1483 (1967). [5] K. A. Olive et al. (Particle Data Group), Chin.
Phys. C 38, 090001 (2014).
[6] A. Anisovich and H. Leutwyler, Phys. Lett. B 375, 335 (1996).
[7] S. P. Schneider, B. Kubis, and C. Ditsche, JHEP 1102, 028 (2011).
[8] J. Gasser and H. Leutwyler, Nucl. Phys. B 250, 539 (1985).
[9] J. Bijnens and K. Ghorbani, JHEP 0711, 030 (2007).
[10] F. Ambrosino et al. (KLOE Collaboration), JHEP 0805, 006 (2008).
[11] P. Adlarson et al. (WASA-at-COSY Collaboration), Phys. Rev. C 90, 045207 (2014).
[12] M. Unverzagt et al. (Crystal Ball Collaboration), Eur. Phys. J. A 39, 169 (2009).
[13] C. Adolph et al. (WASA-at-COSY Collaboration), Phys. Lett. B 677, 24 (2009).
[14] F. Ambrosino et al. (KLOE Collaboration), Phys. Lett. B 694, 16 (2010).
[15] J. Kambor, C. Wiesendanger and D. Wyler, Nucl. Phys. B 465, 215 (1996).
[16] N. Beisert and B. Borasoy, Nucl. Phys. A 716, 186 (2003).
C 36, 603 (1987).
[18] A. M. Blik et al. (GAMS-4π Collaboration), Phys. Atom. Nucl. 71, 2124 (2008).
[19] M. Ablikim et al. (BESIII Collaboration), Phys. Rev. Lett. 108, 182001 (2012).
[20] M. Ablikim et al. (BESIII Collaboration), Nucl. In-strum. Meth. A 614, 345 (2010).
[21] S. Agostinelli et al. (GEANT4 Collaboration), Nucl. Instrum. Meth. A 506, 250 (2003).
[22] Z. Y. Deng et al., Chin. Phys. C 30, 371 (2006). [23] S. Jadach, B. F. L. Ward and Z. Was, Comput.
Phys. Commun. 130, 260 (2000).
[24] S. Jadach, B. F. L. Ward and Z. Was, Phys. Rev. D 63, 113009 (2001).
[25] D. J. Lange, Nucl. Instrum. Meth. A 462, 152 (2001).
[26] J. C. Chen, G. S. Huang, X. R. Qi, D. H. Zhang, and Y. S. Zhu, Phys. Rev. D 62, 034003 (2000). [27] W. D. Li, H. M. Liu et al., in proceeding of CHEP06,
Mumbai, India, 2006 edited by Sunanda Banerjee
(Tata Institute of Fundamental Reserach, Mumbai, 2006).
[28] A. M. Blik et al. (GAMS-4π Collaboration), Phys. Atom. Nucl. 72, 231 (2009).
[29] C. Roiesnel, T. N. Truong, Paris Ec. Polytech. A 515, 0982(1982).
[30] B. Borasoy, R. Nissler, Eur. Phys. J. A 26, 383 (2005).
[31] A. Abele et al. (Crystal Barrel Collaboration), Phys. Lett. B 417, 197 (1998).
[32] J. G. Layter, J. A. Appel et al., Phys. Rev. D 7, 2565 (1973).
[33] J. Bijnens and J. Gasser, Phys. Scr. T 99, 34 (2002). [34] M. N. Achasov et al. (SND Detector), JETP Lett.
73, 451 (2001).
[35] A. Abele et al. (Crystal Barrel Collaboration), Phys. Lett. B 417, 193 (1998).
[36] D. Alde et al. (GAMS-2000 Collaboration), Z. Phys. C 25, 225 (1984).