THE EFFECTS OF DEMOGRAPHICS ON JOB
SATISFACTION FACTORS
Olgun KİTAPCI* İbrahim Taylan DÖRTYOL** Özet
Bu çalışmanın amacı genel anlamda ve beş faktör çerçevesinde çalışanların demografik özelliklerinin iş tatmini üzerindeki etkisine işaret etmektir. Uygulama aşamasında dağıtılan 398 adet anketten 268 adeti Cumhuriyet Üniversitesi çalışanları tarafından doldurulmuş ve geri gönderilmiştir. Analiz sürecinde Faktör analizine ve ANOVA testine başvurulmuştur. Anlamlı çıkan sonuçlar histogramlar vasıtasıyla gösterilmiştir. Çalışmanın bulgularına göre unvanın yönetimsel ve kişisel faktörler ile ilgili iş tatmini üzerinde, yaş ve cinsiyetin ise fiziksel ve sosyal faktörle ilgili iş tatmini üzerinde doğrudan etkiye sahip olduğu görülmüştür. Aynı zamanda cinsiyet ve unvan birlikte analize katıldıklarında yönetimsel ve kişisel iş tatmini faktörüne, yaş ve unvan birlikte düşünüldüğünde de fiziksel ve sosyal iş tatmini faktörüne doğrudan etki ettiği anlaşılmıştır. Çalışma iş tatminini beş faktör üzerinden değerlendirmesi özelliğiyle farklı bir boyut kazanmaktadır.
Anahtar Kelimeler: Demografik, İş Tatmini, Akademik ve İdari Personel
Abstract
The aim of this study is to point the effects of demographics on job satisfaction in general meaning and related with five factors as appeared with factor analysis. A questionnaire was completed by 268 participants who work in Cumhuriyet University. Of the 398 questionnaires distributed, 268 were returned giving a response rate of 67 percent and conducted in analysis. A factor analysis was conducted on variables which were thought as determinant on job satisfaction. An ANOVA Test was performed to study the effects of demographics on job satisfaction. Significant results were displayed with histograms. Rank has direct effect on job satisfaction related with managerial and personal facts factor, besides, age and gender have direct effects on job satisfaction related with physical and social comfort factor separately. Also, gender and rank have effects on job satisfaction
*
related with managerial and personal facts factor with together, likewise, age and rank have effects on job satisfaction related physical and social comfort factor with together. The uniqueness of this study lies in its speciality of searching the effects of demographics on job satisfaction via five separate factors.
Keywords: Demographics, Job satisfaction, Academic and Administrative Personnel.
1. Introductıon
It is observed that present-day’s employees have same expectations except some little differences with those employees of past about working conditions and components. The employees, who see that these expectations come true, work desirously in peacefully and open-shared environment and thus they are also watched out that a strong interpersonal communication and trust grow, employees make claims to their jobs and
work places and deduce more
efficient outputs. Oshagbemi, who explained job satisfaction as
an affective reaction to a job that results from the comparison of
actual outcomes with those that are desired
(2003:1210), hasunderlined that it comes in place of individual’s positive emotional reactions (2000:331).
The phenomenon job satisfaction is not only affected by personal characteristics, it is also affected by organizational conditions and possibilities. Thus, while a study related with job satisfaction is performed, the concept of job satisfaction should be handled with those aspects which were specified above.
The positive or negative factors, which placed in work and work environment, can be perceived differently by person to person. While current conditions are seen adequate by some employees, same conditions may not be enough to meet expectations of others.
2. Lıterature Revıew
The issue of job satisfaction has received considerable attention in literature (Chen et.all 2006, Kavanough et.all 2006, Lee 2006, Oshagbemi 1997, Oshagbemi 1999a, Oshagbemi 1999b, Ozdemir et.all 1999, Sarker et.all 2003, Saura et.all 2005, Scott-Ladd et.all 2005, Suliman and Al-Shaikh 2006). Especially the relationship between gender and job satisfaction (Oshagbemi 2000, Keiser 2007, Okpara 2006, Garcia-Bernall et.all 2005) and the relationship between age and job satisfaction ( Sarker et.all 2003, Tu et.all 2005) are the most common issues of job satisfaction. In this study, the relations
between job satisfaction in many dimensions and the variables like gender, age, rank and the interaction of them are investigated.
2.1 Job Satisfaction – Gender – Rank
In literature of the studies related with job satisfaction and demographics, mostly the relation between gender, rank and job satisfaction was examined. Oshagbemi (2000:331), resulted that gender does not affect the job satisfaction of university teachers directly, but the interaction effect of gender and rank was significant. With reference to that, female academics at higher ranks were more satisfied with their jobs than male academics of comparable ranks. In his another study, Oshagbemi (2003:1225), the result was same as in his previous study. Accordingly, while gender and rank on their own were not significiant, the interaction effect of two variables were significant. So, at higher ranks, female academicians showed greater overall job satisfaction vis a vis their male counterparts. Keiser (2007:90), who has studied on job satisfaction 14 coutries’ workers, expressed that female workers satisfied more than their male counterparts. There are same results in the study of Garcia-Bernal et.all (2005:287). Relatively, gender has no direct effect on job satisfaction. In this study, four basic factors- personel development on the job, interpersonal relationships, economic aspects and job conditions, were mentioned as actors of job satisfaction. While, the interpersonal factor had the greatest impact on job satisfaction for men, this dimension was not significant in determining the job satisfaction of female workers. On the other hand, the work condition factor conditioned the level of job satisfaction with respect to women, while it was not significant with respect to men. And according to the results of Okpara (2006:234,235), female bank managers were less satisfied with their pay and more satisfied with the work they do in supervision and with their co-workers. Similarly, Koustelios (2001:356) found that female teachers had greater job satisfaction level with their job conditions in respect of male teachers in Greece.
2.2 Job Satisfaction – Age
When the literature about the relationship between job satisfaction and age investigated, it is observed that almost none of these studies found a significant relation between age and job satisfaction. Tu et.all (2005:264) have examined the relation between age and job satisfaction in China and Taiwan, but they could not find a significant relation in both two countries. In a further study, Punnet et.all (2007:384), in which they analysed the satisfaction levels and
career success’ of women from nine countries in America, pointed out that there was significant relation in only one country between age and job satisfaction. Accordingly, Brezilian female workers’ job satisfaction levels were effected by age differences. Kavanaugh, Duffy and Lilly’s study about the effects of demographics on job satisfaction levels of healthcare professionals can be counted as one of studies in which resulted with a significant relation. In this study, Kavanaugh et.all (2006:311) specified that age accounted for only minor differences on job satisfication. Only Oshagbemi (2003:1225) pointed out a direct and positive relation between age and job satisfaction in definite language.
2.3
Job Satisfaction FactorsSharing between employees, trust, support, communication, entirety of purpose, physical ambient, innovation and emotional intelligence are determined as the physical and emotional environment factors that influence the level of employees’ job satisfaction. These variables have examined in different names by other authors. For example, Sulliman and Al-Shaikh (2006:212) have investigated job satisfaction over emotional intelligence, conflict and readiness to innovate and create. The study results show that the level of conflicts that arise from frustrations, conflict of goal and family-work conflict fell down, while the tenure has made progress. According to other finding of this study, the participations of employees with higher levels of emotional intelligence are more effective and these employees tend to show lower level of conflict.
To propose that the co-worker relationships effects directly job satisfaction, will not be wrong. Oshagbemi (1999:94) submitted that a collegial and friendly atmosphere was useful as academics perform several function jointly. In this study, Oshagbemi found that academics generally were satisfied with their co-workers’ behaviours.
Certainly, one of the necessities of being a social creature is communication. Bakan and Buyukbese (2004:13) mentioned the possession of a statistically significant relationship between communication and job satisfaction. Likewise, Scott-Ladd et.all (2005:408) extrapolated that participation positively influences job satisfaction and affective commitment.
Managerial approaches, promotion, manager-employee relation, payment, convenience to job attributions and peace in work place attract attention as components on academicians and administrative personnels’ job satisfaction related with managerial and personal facts. Working in pleasure and taking part in an efficient production process are depend on to realization of those facts which
are expressed above at both personal and managerial dimensions without causing any dissatisfactions and conflicts. So, employee should realize that his/her manager is equitable and honest, managerial approaches should be determined consistently with the direction of employee benefits, payment should act as an incentive factor espacially in academic ambient and promotion possibilities should be equal to everyone.
The psychology of an employee who can not get his/her deserved promotion was pointed as a factor that may cause trouble and dissatisfaction. Koustelious (2001:355) has pointed pay and promotional opportunities as factors that bear low satisfaction. In one of his study about the job satisfaction profiles of academicians in United Kingdom Oshagbemi (1997:37) suggested that the main specialities of “unhappy workers” were. payment, promotion and managerial approaches.
It is not avoidable to face with exhaustion syndrome when duties of job make pressure on academics and administrative personnel who already have problems with their social relations.
3. Methodology
Questionnarie is preferred as data collecting method in this study which was performed the personnels in 9 faculties, 3 high schools and 3 vocational high schools of Cumhuriyet University, which is one of the oldest universities of Turkey and was founded in Sivas, on 1974. Questionnaire which is formed from two parts was distrubuted to participants on September 2007. In the first part, there are 10 open-ended and completely structured questions related with demographics. 29 proposals in likert scale related with current job satisfaction level and the factors that effects job satisfaction level place in the second part. There is also a part for desired participants to express their other thoughts. Before questionnaire took its last form, a pilot application has performed on Faculty of Administration and Economics of Cumhuriyet University and essential corrections has made. In the light of informations that have taken from Rectorship of Cumhuriyet University, stratified sampling was used as sampling method to calculate for the number of personnels per faculties and high schools. At the end of that step, 398 questionnaires were distrubuted and 268 were returned and conducted on analysis. The response rate was 67 percent.
SPSS 15.0 for windows was used for data analysis. Descriptives statistics such as means, frequencies, factor analysis and Anova Test were calculated.
4. Fındıngs
4.1
Findings Related with Demographics and
Factor Analysis
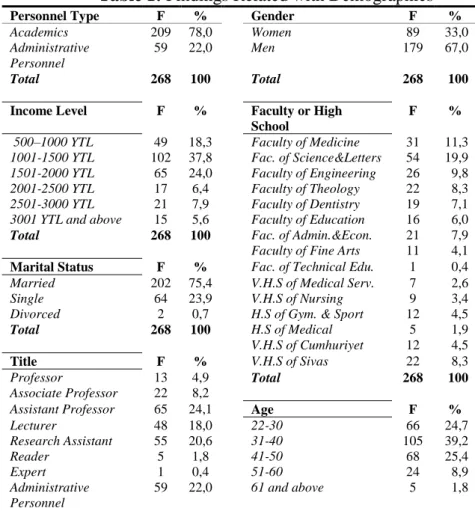
Table 1: Findings Related with Demographics
Personnel Type F % Gender F %
Academics 209 78,0 Women 89 33,0
Administrative Personnel
59 22,0 Men 179 67,0
Total 268 100 Total 268 100
Income Level F % Faculty or High
School F % 500–1000 YTL 1001-1500 YTL 1501-2000 YTL 2001-2500 YTL 2501-3000 YTL 3001 YTL and above
Total 49 102 65 17 21 15 268 18,3 37,8 24,0 6,4 7,9 5,6 100 Faculty of Medicine Fac. of Science&Letters Faculty of Engineering Faculty of Theology Faculty of Dentistry Faculty of Education Fac. of Admin.&Econ. 31 54 26 22 19 16 21 11,3 19,9 9,8 8,3 7,1 6,0 7,9 Faculty of Fine Arts 11 4,1
Marital Status F % Fac. of Technical Edu. 1 0,4
Married 202 75,4 V.H.S of Medical Serv. 7 2,6
Single 64 23,9 V.H.S of Nursing 9 3,4
Divorced 2 0,7 H.S of Gym. & Sport 12 4,5
Total 268 100 H.S of Medical 5 1,9
V.H.S of Cumhuriyet 12 4,5
Title F % V.H.S of Sivas 22 8,3
Professor 13 4,9 Total 268 100
Associate Professor 22 8,2
Assistant Professor 65 24,1 Age F %
Lecturer 48 18,0 22-30 66 24,7 Research Assistant 55 20,6 31-40 105 39,2 Reader 5 1,8 41-50 68 25,4 Expert 1 0,4 51-60 24 8,9 Administrative Personnel 59 22,0 61 and above 5 1,8 Total 268 100 Total 268 100
VHS= Voluntary High School HS= High School
In Table 1, it is understood that within the context of the study, 209 academics and 59 administrative personnel were participated. So, 78 percent of all participants are academics and 22 percent are administrative personnel. For the title of the participants, it can be said that 4,9 percent of academics are professor, 8,2 percent are associate professor, 24,1 percent are assistant professor, 18 percent are lecturer, 20,6 percent are research assistant, 1,8 percent are reader and
0,4 percent are expert. According to another data of the table; 24,7 percent of participants are between the age range of 22 and 30; 39,2 percent are between 31 and 40; 25,4 percent are between 41 and 50; 8,9 percent are between 51 and 60 and 1,8 percent are at the age group of 61 and above. Other informations about income levels, marital status, distribution of faculties and high schools are also shown in Table 1.
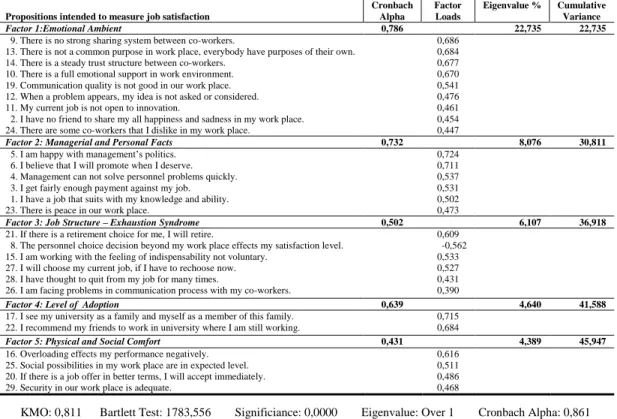
To bring new dimensions to those 29 propositions which were developed intended to factors that effect job satisfaction and to reduce the number of variable, factor analysis was performed. To group the variables related with this analysis, “Varimax Rotation” choice was applied and the values whose eigenvalues are bigger than 1 were considered.
After the application of factor analysis, similar variables were gotten together in spesific groups (factors). As can be seen from the analysis results on Table 2, value of KMO (Keiser-Meyer-Olkin) was calculated as 0,811. Being over the desired value (0,60) features that related sampling is adequate. The value of Bartlett Test which was actualized as 0,000, means that the results of study are significant.
When Table 2 is examined, it is observed that 5 factors explain 45,9 percent of total variance. After the factor analysis, those 5 factors appeared:
Factor 1: Emotional Ambient Factor 2: Managerial and Personal Facts
Factor 3: Job Structure and Exhaustion Syndrome Factor 4: Level of Adoption
Table 2: Factor Analysis Related with Factors that Effects Job Satisfaction
KMO: 0,811 Bartlett Test: 1783,556 Significiance: 0,0000 Eigenvalue: Over 1 Cronbach Alpha: 0,861 Propositions intended to measure job satisfaction
Cronbach Alpha Factor Loads Eigenvalue % Cumulative Variance
Factor 1:Emotional Ambient 0,786 22,735 22,735
9. There is no strong sharing system between co-workers.
13. There is not a common purpose in work place, everybody have purposes of their own. 14. There is a steady trust structure between co-workers.
10. There is a full emotional support in work environment.
19. Communication quality is not good in our work place. 12. When a problem appears, my idea is not asked or considered.
11. My current job is not open to innovation.
2. I have no friend to share my all happiness and sadness in my work place. 24. There are some co-workers that I dislike in my work place.
0,686 0,684 0,677 0,670 0,541 0,476 0,461 0,454 0,447
Factor 2: Managerial and Personal Facts 0,732 8,076 30,811
5. I am happy with management’s politics. 6. I believe that I will promote when I deserve. 4. Management can not solve personnel problems quickly. 3. I get fairly enough payment against my job. 1. I have a job that suits with my knowledge and ability. 23. There is peace in our work place.
0,724 0,711 0,537 0,531 0,502 0,473
Factor 3: Job Structure – Exhaustion Syndrome 0,502 6,107 36,918
21. If there is a retirement choice for me, I will retire.
8. The personnel choice decision beyond my work place effects my satisfaction level. 15. I am working with the feeling of indispensability not voluntary.
27. I will choose my current job, if I have to rechoose now. 28. I have thought to quit from my job for many times.
26. I am facing problems in communication process with my co-workers.
0,609 -0,562 0,533 0,527 0,431 0,390
Factor 4: Level of Adoption 0,639 4,640 41,588
17. I see my university as a family and myself as a member of this family. 22. I recommend my friends to work in university where I am still working.
0,715 0,684
Factor 5: Physical and Social Comfort 0,431 4,389 45,947
16. Overloading effects my performance negatively. 25. Social possibilities in my work place are in expected level. 20. If there is a job offer in better terms, I will accept immediately. 29. Security in our work place is adequate.
0,616 0,511 0,486 0,468
4.2
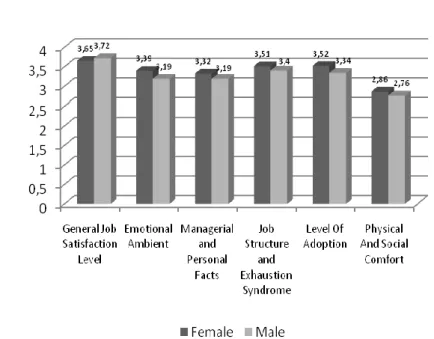
Findings Related With ANOVA TestFigure 1 Histogram showing the relationship between gender and overall
satisfaction and between gender and satisfaction related with emotional ambient, managerial and personal facts, job structure and exhaustion syndrome, level of adoption and pysical and social comfort.
From the histogram (Figure 1), it can be seen that male personnels are more satisfied than female personnels in general job satisfaction. But interestingly, female personnels are more satisfied than males with satisfaction derived from all other factors. Accordingly, while male personnels have greater satisfaction on general meaning, females are more satisfied related with satisfaction derived from emotional ambient, managerial and personal facts, job structure-exhaustion, level of adoption and pysical and social comfort.
With respect to another implication of the histogram, satisfaction level related with physical and social comfort factor attract attention as the lowest satisfaction level of all. Deficiency of social possibilities and security may be seen as the reason of this situation. Personnels put these deficiencies into words time and again in the related part of the questionnaire.
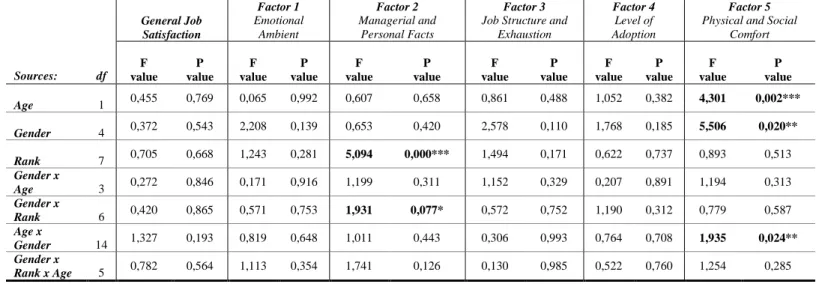
Table 3: ANOVA Results: general job satisfaction and satisfactions derived from emotional ambient,
managerial and personal facts, job structure and exhaustion, level of adoption and physical and social
comfort.
Sources: df General Job Satisfaction Factor 1 Emotional Ambient Factor 2 Managerial and Personal Facts Factor 3Job Structure and Exhaustion
Factor 4
Level of Adoption
Factor 5
Physical and Social Comfort F value P value F value P value F value P value F value P value F value P value F value P value Age 1 0,455 0,769 0,065 0,992 0,607 0,658 0,861 0,488 1,052 0,382 4,301 0,002*** Gender 4 0,372 0,543 2,208 0,139 0,653 0,420 2,578 0,110 1,768 0,185 5,506 0,020** Rank 7 0,705 0,668 1,243 0,281 5,094 0,000*** 1,494 0,171 0,622 0,737 0,893 0,513 Gender x Age 3 0,272 0,846 0,171 0,916 1,199 0,311 1,152 0,329 0,207 0,891 1,194 0,313 Gender x Rank 6 0,420 0,865 0,571 0,753 1,931 0,077* 0,572 0,752 1,190 0,312 0,779 0,587 Age x Gender 14 1,327 0,193 0,819 0,648 1,011 0,443 0,306 0,993 0,764 0,708 1,935 0,024** Gender x Rank x Age 5 0,782 0,564 1,113 0,354 1,741 0,126 0,130 0,985 0,522 0,760 1,254 0,285
Table 3 shows ANOVA results for overall job satisfaction and satisfactions derived from emotional ambient, managerial and personal facts, job structure and exhaustion, level of adoption and physical and social comfort. While age, gender and rank are not statistically significant for direct effects on general job satisfaction, there is no evidence to talk about interactive or combine interactive effects of these variables on general job satisfaction. This situation is same in satisfactions with emotional ambient, job structure and exhaustion, level of adoption and physical and social comfort. But from Table 3, they are also observed that satisfaction with managerial and personal facts is statistically significant with respect to rank and interactive effect of gender and rank. Moreover, satisfaction derived from physical and social comfort is statistically significant with respect to age, rank and interactive effect of age and rank. The ANOVA results of the effect of rank and the interactive effects of gender and rank on managerial and personal facts are presented in Figure 2 and 3, respectively. Also, with Figure 4 and Figure 5, the ANOVA results of the effects of age and rank on physical and social comfort are presented.
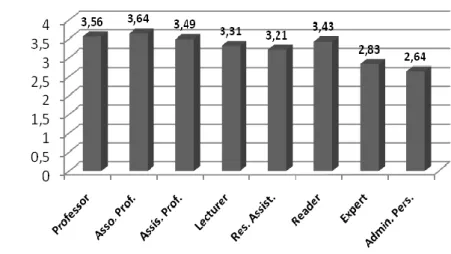
Figure 2: Histogram of ANOVA results: Rank on Managerial and
Personal Facts.
According to Table 3, satisfaction level of university personnels related with managerial and personal facts is influenced by rank. And Figure 2 represents that associate professors’ and professors’ satisfactions with managerial and personal facts are the greatests. And the lowest level belongs to administrative personnel. It means that professors and associate professors are more pleased with
Professors and Associate Professors are placed in management steps in majority. And they receive the highest salaries. So, in the light of these informations, it is seen normal as they are more pleased with this factor.
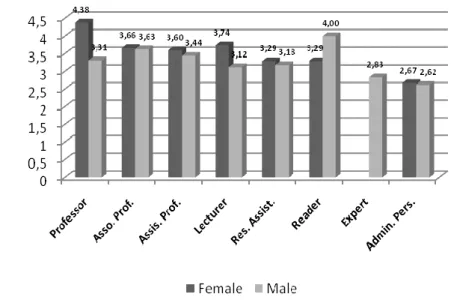
Refer to Table 3, rank and gender have interactive effect on satisfaction with managerial and personal facts. That means, although gender itself is not significant on satisfaction derived from managerial and personal facts, it is significant when compared together with the variable of rank. And the anova results are in Figure 3. From the related histogram, it can be seen that, female personnels have higher satisfaction levels than their male co-workers for the ranks of professor, assistant professor, lecturer and research assistant. In the rank of associate professor and administrative personnels, both male and female personnels have equally satisfaction levels. Only in the rank of reader, male academics are more satisfied than females. But here, deficiency on the number of readers must be noted. The number of readers is only five at all, and 1 of them is male. Also, in the rank of expert, there is no female observation. So, we can propose that in all ranks, female personnels are more greatly satisfied in proportion to their male counterparts. The differences on the point of views of males and females about payment which is placed in this factor, can be an explanatory for this implication. In the study of Oshagbemi (2000:337), he underlined that female academicians are more satisfied with their payment compared with male academicians although their salaries may not be higher. Family conditions should be seen as reason of this, because females do not consider themselves as sole or primary income earners.
According to histogram, the biggest difference on satisfaction level is seen on professors. Oshagbemi, who has studied a similar research on university teachers and has found similar findings, pointed out the relatively few numbers of female workers in top academic ranks as the result of this situation (2000:336). Actually, in this search only 3 of the 13 professors are female. So, the few professors on their own disciplines, may see themselves exceptionally gifted or hardworking, as Oshagbemi touched on.
Figure 3 Histogram of ANOVA results: gender x rank on satisfaction with
managerial and personal facts
Another significant effect is presented in Figure 4. So, from the histogram, it can be understood that the highest job satisfaction level related with physical and social comfort is 61 and over age group with the score of 3,416. Personnels who were between 31 and 40 age gap have the least satisfaction level.
Figure 4 Histogram of ANOVA results: age on satisfaction with physical and
social comfort
When the histogram is investigated, a gradually rising attitude attracts attention except one point ( between 31 and 40). Accordingly, we may propose that, satisfaction derived from physical and social
comfort increases, while personnels’ ages move on. The reasons of this result may be considered as the realization or reduction of these expactations about social possibilities as the years went by.
5. Conclusıon and Dıscussıons
In this study we examined the effects of demographics on general job satisfaction and satisfaction derived from emotional ambient, managerial and personal facts, job structure and exhaustion, level of adoption and physical and social comfort.
And study found that there are no relations between age, gender, rank and general job satisfaction, satisfaction with emotional ambient, job structure and exhaustion and level of adoption. There are also no interactive or combined interactive effect of these variables on these satisfaction levels.
With satisfaction derived from managerial and personal facts, rank by itself affects satisfaction level directly, while gender and rank have interactive effect on it. This result is consistent with the results of Oshagbemi (2000), Oshagbemi (2003), Garcia-Bernal et.all (2005), Keiser (2007), Okpara (2006) and Koustelious (2001). Accodingly, associate professors’ and professors’ satisfactions with managerial and personal facts are the greatests while the lowest level belongs to administrative personnel. And, female personnels have higher satisfaction levels than their male co-workers for the ranks of professor, assistant professor, lecturer and research assistant. In the rank of associate professor and administrative personnels, both male and female personnels have equally satisfaction levels. The differences on the point of views of males and females about payment which is placed in this factor, can be an explanatory for this implication. Family conditions should be seen as reason of this, because females do not consider themselves as sole or primary income earners as Oshagbemi spesified (2000:337).
While, age and gender effect the satisfaction related with physical and social comfort by themselves, age and rank have interactive effect on this factor. Accordingly, it may be proposed that, satisfaction derived from physical and social comfort increases, while personnels’ ages move on. The reasons of this result should be considered as the realization or reduction of these expactations about social possibilities as the years went by. The life-style of the personnels may be considered as the result of the effects of gender on physical and social comfort. As females pass the times at home more, they should perceive social possibilities adaquate. With respect to another implication of the histogram placed in Figure 1, satisfaction level related with physical and social comfort factor attract attention
as the lowest satisfaction level of all. Deficiency of social possibilities and security should be pointed as the reason of this situation as personnels put these deficiencies into words time and again in the related part of the questionnaire.
Deficiency on the number of experts and readers in ANOVA analysis could be accepted as the main limitation of the study. On the other hand, further studies may need to give place to tenure as a question. It is important to underline the relationship between tenure and job satisfaction. This study was performed on only one university. So, we may not generalize the results on all university personnels in Turkey. Anyhow, we believe that this study provides considerable results and implications about the effects of demographics on job satisfaction.
REFERENCES
AKİNCİ, Z. (2002), “Turizm Sektorunde Isgoren Is Tatminini Etkileyen Faktorler: Bes Yildizli Konaklama Isletmelerinde Bir Uygulama”, Akdeniz I.I.B.F. Dergisi, Vol 4, pp 1-25.
BAKAN, I. and Buyukbese, T. (2004), “Orgutsel Iletisim Ile Is Tatmini Unsurlari Arasindaki Iliskiler: Akademik Orgutler Icin Bir Alan Arastirmasi”, Akdeniz I.I.B.F. Dergisi, Vol 7, pp 1-30.
CHEN, S., Yang, C., Shiau, J. and Wang, H. (2006), “The Development Of An Employee Satisfaction Model For Higher Education”, The TQM Magazine, Vol. 18 No. 5, pp. 484-500.
GARCİA-Bernal, J.,Gargallo-Castel, A., Marzo-Navarro, M. and Rivera-Torres, P. (2005), “Job Satisfaction: Empirical Evidence of Gender Differences”, Women in Management Review, Volume 20 . Number 4. pp. 279-288.
KARACA, A. (1998), “Is Tatmini ve Is Tatmini Ile Hemsirelik Hizmetlerinin Yerine Getirilme Duzeyleri Arasindaki Iliski Ile Ilgili Arastirma”, Master Thesis, Inonu University, Malatya.
KARAMAN, F. and Altunoglu, A.E. (2007), “Kamu Universiteleri Ogretim Elemanlarinin Is Tatmini Duzeylerini Etkileyen Faktorler”, Yönetim ve Ekonomi, 14/1, pp109-120.
KAVANAUGH, J., Duffy, J. A. and Lilly, J. (2006), “The Relationship Between Job Satisfaction and Demographic Variables For Healthcare Professionals”, Management Research News, Vol. 29 No. 6, pp. 304-325.
KEİSER, L. C. (2007), “Gender-Job Satisfaction Differences Across Europe: An Indicator For Labour Market Modernization”, International Journal of Manpower, Vol. 28 No. 1, pp. 75-94.
KOUSTELİOS, A. D. (2001), “Personal Characteristics and Job Satisfaction of Greek Teachers”, International Journal of Educational Management, 15/7, pp 354-358.
LEE, S. Y. (2006), “Expectations of Employees Toward The Workplace and Environmental Satisfaction”, Facilities, Vol. 24 No. 9/10, pp. 343-353.
NAKİP, M. (2006), Pazarlama Arastirmalari, Teknikler ve (SPSS destekli) Uygulamalar, Seckin Yayınları, Genisletilmiş 2. Basım, Ankara, 2006.
OKPARA, J. O. (2006), “Gender and The Relationship Between Perceived Fairness In Pay, Promotion, and Job Satisfaction In A Sub-Saharan African Economy”, Women in Management Review, Vol. 21 No. 3, pp. 224-240.
OSHAGBEMİ, T. (1997), “Job Satisfaction Profiles of University Teachers”, Journal of Managerial Psychology, Vol. 12 No. 1, pp. 27-39.
OSHAGBEMİ, T. (1999a), “Satisfaction With Co-Workers’ Behaviours”, Employee Relations, Vol. 22 No. 1, pp. 88-106.
OSHAGBEMİ, T. (1999b), “Academics and Their Managers: A Comparative Study In Job Satisfaction”, Personel Review, Vol. 28 No. 1/2, pp. 108-123
OSHAGBEMİ, T. (2000), “Gender Differences In The Job Satisfaction Of University Teachers”, Women in Management Review, Volume 15 . Number 7 . pp. 331-343.
OSHAGBEMİ, T. (2003), “Personal Correlates Of Job Satisfaction: Empirical Evidence From UK Universities”, International Journal of Social Economics, Vol. 30 No. 12, pp. 1210-1232.
OZDEMİR, K., Coskun, A., Ozdemir, H. D. and, Cinar, Z. (1999), “Dis Hekimligi Fakultesi Ogretim Elemanlarinda Mesleki Tukenmislik Olceginin Degerlendirilmesi”, Cumhuriyet Üniversitesi Dişhekimliği Fakültesi Dergisi, Vol 2, No 2, pp. 98-104.
PUNNET, B. J., Duffy, J. A., Fox, S, Gregory, A, Lituchy, T, Miller, J, Monserrat, S. I., Olivas-Luja´N, M. R. and Santos, N. M. B. F. (2007), “Career Success And Satisfaction: A Comparative Study In Nine Countries”, Women in Management Review, Volume 22 . Number 5 . pp. 371-390.
SARKER, S. J., Crossman, A. and Chinmeteepituck, P. (2003), “The Relationships of Age and Length of Service With Job Satisfaction: An Examination of Hotel Employees In Thailand”, Journal of Managerial Psychology,Vol. 18 No. 7, pp. 745-758.
SAURA, I. G., Contri, G. B., Taulet, A. C. and Velazquez, B. M. (2005), “Relationships Among Customer Orientation, Service Orientation And Job Satisfaction In Financial Services”, International Journal of Service Industry Management, Vol. 16 No. 5, pp. 497-525. Scott-Ladd, B., Travaglione, A. and Marshall, V. (2005) “Causal Inferences Between Participation In Decision Making, Task Attributes, Work Effort, Rewards, Job Satisfaction and Commitment”, Leadership & Organization Development Journal,Vol. 27 No. 5, pp. 399-414.
SULİMAN, A. M. and Al-Shaikh, F. N. (2006), “Emotional Intelligence At Work: Links To Conflict And Innovation”, Employee Relations, Vol. 29 No. 2, pp. 208-220.
TOKOL, T. (2002), Pazarlama Arastirmasi, Vipas AS, 11. Baski, Bursa, 2002.
TU, L., Plaisent, M., Bernard, P. and Maguiraga, L. (2005), “Comparative Age Differences Of Job Satisfaction On Faculty At Higher Education Level China And Taiwan”, International Journal of Educational Management, 19/3, pp 259-267.