Is It How You Look or Speak That Matters?
“An Experimental Study Exploring the Mechanisms of
Ethnic Discrimination”
BETAM WORKING PAPER SERIES #009
MARCH 2013
Is It How You Look or Speak That Matters?
-An Experimental Study Exploring the Mechanisms of
Ethnic Discrimination
∗
Magnus R ¨odin and G ¨ulay ¨Ozcan† March 11, 2013
Abstract
Using a unique laboratory experiment where subjects are asked to guess the test per-formance of candidates presented by facial portraits and voice messages, this paper explores the following questions: Are beliefs about performance affected by if a can-didate is perceived to have looks that are non-stereotypical for the dominant pop-ulation and do these beliefs change if the candidate has native-like versus accented speech? The experiment is conducted in Sweden and the results show that candi-dates not perceived as stereotypically Swedish are considered to be worse perform-ers. These beliefs are found in within-gender but not in cross-gender evaluations and are not eliminated when additional performance-related information about the candidates is provided. When candidates are presented by both looks and speech, differential evaluations based on looks disappear. Instead, we find strong negative beliefs about performance for candidates that speak Swedish with a foreign accent implying that ethnic stereotypes associated with speech override stereotypes associ-ated with appearance. The negative beliefs associassoci-ated with foreign-accented speech are not supported by corresponding mean differences in the candidates’ actual test performance.
Keywords:Experiment, Appearance, Speech, Beliefs, Performance, Stereotypes JEL Classification:J71; J15; D03
∗The authors are grateful for comments from Mahmood Arai, Shahram Khosravi, Astri Muren, Lena
Nekby and Mats Hammarstedt as well as seminar participants at the European Society of Population Eco-nomics (Seville, 2009), the Department of EcoEco-nomics, Stockholm University and the Linn´e Centre for Labour Market Policy Research, V¨axj ¨o University. The authors also thank Gunilla C. Thunberg at the Department of Linguistics, Stockholm University and Anita Karlsson at the Department of Economics, Stockholm Univer-sity. Financial support from Jan Wallander’s and Tom Hedelius Research Foundations is gratefully acknowl-edged.
†Magnus R ¨odin ([email protected]) and G ¨ulay ¨Ozcan ([email protected]), Swedish Institute
for Social Research, Stockholm University and Stockholm University Linnaeus Center for Integration Studies (SULCIS).
1
Introduction
Numerous studies have provided evidence of unequal treatment of racial and ethnic mi-norities.1 In a labor market context, studies using corresponding testing have found that r´esum´es containing an Afro-American or foreign-sounding name receive significantly lower call-back rates compared to r´esum´es containing a name common among the dom-inant population.2 Similar results have been detected in audit-studies where candidates
of varying ethnic background are sent to job-interviews.3 One commonly suggested ex-planation for these results is that employers to some extent base their hiring decisions on ethnic stereotypes, i.e. beliefs about ethnic group characteristics related to productiv-ity. Employers could, for example, use a foreign-sounding name or looks signaling mi-nority group belonging as indicators of unobservable characteristics that are negatively associated with productivity. In economic theory, the use of stereotypes to discriminate among applicants is defined as statistical discrimination in the case where stereotypes correspond to actual group averages (Arrow, 1973; Phelps, 1972; Aigner and Cain, 1977) and as error discrimination when stereotypes do not correspond to actual group averages (England, 1992).
The existence of ethnic stereotypes has been shown in studies using the implicit associa-tion test (IAT). For example, Bertrand et al. (2005) found that pictures of Afro-Americans were to a higher degree associated with negative attributes as compared to pictures of Caucasian faces. Experimental studies have also found ethnic stereotypes to negatively affect levels of trust and cooperation (Fershtman et al., 2005; Castillo and Petrie, 2010). To our knowledge, the extent to which ethnic stereotypes affect beliefs about performance has not been examined in the economic literature. Using a unique laboratory
experi-1A number of studies have documented labor market gaps between natives and those with immigrant
background in Sweden. See Aigular and Gustafsson (1994); Arai et al. (2000); Edin and ˚Aslund (2001); Heshmati and Maasoumi (1998); Hammarstedt and Shukur (2006); Le Grand and Szulkin (2002); Nekby et al. (2008); Rashid (2004).
2Bertrand and Mullainathan (2004); Bovenkerk et al. (1995); Allasino et al. (2004); List (2004). For Swedish
studies see Arai et al. (2008); Bursell (2007); Carlsson and Rooth (2007).
ment, our study contributes to the literature by exploring how beliefs about performance are affected by looks that are not stereotypical for the dominant population and foreign-accented speech. Moreover, we examine if the beliefs triggered by looks change when more information related to performance is added.
The experiment in this study, called the Betting Game, is designed to resemble a hir-ing situation in the labor market where subjects, acthir-ing in a role similar to employers, are shown limited information about a number of candidates and are rewarded if choosing the candidate with the highest performance in a previously administered test. Subjects indicate their beliefs about candidates’ relative performance by allocating money bets of different magnitudes among the candidates. To get a measure of performance that is relevant in a labor market context, candidate performance is measured by a test con-structed from practice entrance-exams for employment in the European Union requiring skills in verbal reasoning. To evaluate the relative importance of looks and speech, the candidates are presented in three ways: (1) facial portraits, (2) facial portraits and voice-messages and (3) facial portraits along with information relevant for test performance (years studied at the university). The design of the experiment excludes all forms of so-cial and finanso-cial interaction between subjects and candidates. As such, assuming that taste is primarily of importance for interacting or not interacting with a particular group of people, a systematic relationship between beliefs about performance and appearance is mainly interpreted as stereotypes regarding group differences in performance.4 Infor-mation on candidates’ test results is then used to evaluate to what degree stereotypes correspond to mean differences in the actual test scores.
The experiment is conducted in Sweden and therefore examines how beliefs about per-formance are affected by whether or not the candidate is perceived to have stereotypical Swedish looks and/or is perceived to speak native-like Swedish. To be able to analyze these questions, we need to know how candidates’ looks and speech are perceived. There
is no racial classification in Sweden as for example in the US. However, in the context of Swedish immigration, there is a debate in the media about ”immigrants” and ”Swedes” where immigration status is sometimes determined by racial or phenotypic character-istics rather than country of birth. Although there is no applicable definition of homo-geneous Swedish looks in Sweden today, where more than 18 percent of the popula-tion have either immigrated themselves or have immigrant parents, there are stereotypes about what typical Swedish looks are. These stereotypes are often based on historical narratives and racial history rather than contemporary reality (Matsson, 2005; Sawyer, 2000).5 Matsson (2005), for instance, argues that the notion of Swedishness includes a
di-mension based on looks referring to blond hair and blue eyes and further points out that attributes like dark hair and dark eyes have been and still are seen as a sign of deviation and differentness (Matsson, 2005; Sawyer, 2000).6
To define the candidates’ looks and speech, two groups of ”evaluators” were asked to rate each candidate’s facial portrait and voice message, respectively, according to a number of attributes including our two main variables of interest, i.e. to what degree the candi-date has stereotypical Swedish looks and to what degree the candicandi-date speaks native-like Swedish.7 Candidates who have been perceived differently in our main attributes of
in-terest may also have been perceived differently in other facial/voice attributes that may affect beliefs about performance. Therefore, the evaluators were asked to rate the faces and voices according to a number of other attributes such as whether the candidate ap-pears educated and trustworthy and sounds determined, alert etc. Using the attribute ratings made by the evaluators as a proxy for how the subjects participating in the Bet-ting Game perceive the candidates, we can examine how each attribute affects the beliefs
5Notice also that the definition of Swedishness is complex and in research, it has been based on different
dimensions such as citizenship, lineage, language, culture, country of birth and looks. Individuals who may be categorized as Swedish in one dimension can be categorized as non-Swedish in other dimensions.
6The criminological research testing discrimination of immigrants in the witness context for instance uses
the expression ”typically Swedish/Scandinavian looks” described as fair skin, blond hair and blue-green eyes (Lindholm and Bergvall, 2006; Pettersson, 2006).
7Candidates’ looks were evaluated in a stereotypical framework where each face was rated according to
how well it corresponds to the ”general view” of society for what a person with a particular attribute looks like.
about performance.
Our study yields the following results: Individuals who are rated as having stereotypi-cally Swedish looks are perceived to have a higher performance on the test. Being per-ceived as having non-stereotypically Swedish looks is found to negatively affect beliefs about performance when male subjects evaluate male candidates and when female sub-jects evaluate female candidates but not in cross-gender evaluations. However, when candidates are presented by both their looks and speech, the effect of being perceived as having typically Swedish looks disappears. Instead, we find a strong negative effect of speaking Swedish with an accent. Stereotypes based on speaking with an accent are thus found to dominate stereotypes based on looks. Finally, as the strong negative beliefs as-sociated with an accented speech are not supported by corresponding mean differences in candidates’ actual test scores, the unequal treatment of candidates speaking Swedish with an accent can, at least for the sample studied, not be described as statistical discrim-ination but rather as error discrimdiscrim-ination.
The paper proceeds as follows. In the next section, we present work related to ethnic stereotypes and discrimination. Section 3 describes the experimental setup. Data and the empirical set-up are presented in Section 4, empirical results in Section 5 and the concluding remarks in Section 6.
2
Ethnic Stereotypes and Discrimination
There is a large literature in economics, sociology and psychology examining the exis-tence of ethnic and racial stereotypes.8 In a labor market context, a recent US study by Pager and Karafin (2009), based on in-depth interviews with hiring managers, found deep biases about African-Americans who were characterized as lazy and unreliable.
8See, for example, Bertrand et al. (2005); Brigham (1971); Eagly and Kite (1987); Eagly and Steffen (1984);
Similar results have been found in the economic studies examining stereotypes of ethnic groups by using the implicit association test (IAT) (Bertrand et al., 2005). In a Swedish IAT-study conducted by Rooth (2009b), Arabic-sounding names were to a higher degree associated with words reflecting low productivity such as ineffective and to a lower de-gree with words reflecting high productivity such as hardworking and ambitious com-pared to Swedish-sounding names.
The existence of ethnic stereotypes may induce employers to use attributes signaling eth-nic group belonging as a proxy for employment-relevant characteristics that are difficult to observe. Individuals belonging to different groups may thus be treated differently even though they share exactly the same observable characteristics. Indeed, several stud-ies have shown that having a foreign background or being a member of a minority group as indicated by name or looks may result in negative consequences. Studies using corre-sponding testing have, for example, found that r´esum´es containing an Afro-American or foreign-sounding name receive significantly lower call-backs compared to r´esum´es con-taining a name common among the dominant population.9 Similar results have been found in so-called Audit-studies where equally qualified candidates, one belonging to the majority group and one belonging to the minority group, are sent to job interviews.
Experimental studies have found ethnic stereotypes to negatively affect levels of trust and cooperation (Fershtman and Gneezy (2001); Castillo and Petrie (2010)).10 In a study by Castillo and Petrie (2010), participants were found to use the appearances of co-participants to choose who they would like to have in their group when playing a public goods game. When no information about past behavior was provided, individuals with Afro-American appearance were put two ranks lower than other individuals. Includ-ing information about co-participants’ past behavior, however, made looks irrelevant for
9See Arai et al. (2008); Bertrand and Mullainathan (2004); Bursell (2007); Bovenkerk et al. (1995); Carlsson
and Rooth (2007); Allasino et al. (2004); List (2004).
10For other studies exploring discrimination in laboratory setting see Davis (1987); Anderson and Haupert
(1999); Dickinson and Oaxaca (2009); Feltovich and Papageorgiou (2004); Fryer et al. (2005); Bouckaert and Dhaene (2004).
group formation.11 The direct link between attributes associated with having a foreign
background and beliefs about performance is, however, missing in the economic litera-ture.12
Differences in language skills have been suggested as an explanation for wage differen-tials between natives and individuals with a foreign background (Borjas, 1994; Chiswick and Miller, 1995; Dustmann and Van Soest, 2002). However, there is no economic study exploring the direct effect of foreign-accented speech on beliefs about performance or if having native-like speech offsets unequal treatment based on having a name or looks signaling a foreign background. Findings in the psycholinguistic literature suggest that speech accents are used by listeners as an immediate marker of the background and char-acteristics of the speakers and that these assessments affect the listeners’ evaluation of the speakers’ competence, social status etc. (Giles, 1970; Giles and Sassoon, 1983; Cargile and Giles, 1997; Horani, 1995).13 A link between foreign-accented speech and perceived abil-ity has, for example, been shown in a study by Horani (1995) where a sample of nurses were found to judge native-like speaking physicians as possessing greater medical com-petence than physicians with foreign-accented speech.
In economic theory, discrimination based on ethnic stereotypes is referred to as statistical discrimination in the case where employers’ estimates of group differences are correct (Arrow, 1973; Phelps, 1972; Aigner and Cain, 1977). Employers may also treat individu-als unequally based on incorrect estimates of group averages, which is denoted as error discrimination (England, 1992). Discrimination may also be due to employers’, employ-ees’ or customers’ dislike for a particular group of people and their willingness to pay a
11See also Ahmed et al. (2010) studying (in a field experiment) the effect of adding more information on
ethnic discrimination (based on names) in the housing market.
12There are also studies suggesting that other attributes of a person’s physical appearance may affect how
he or she is perceived and treated by others. Studies have, for example, found a positive relationship between attractiveness and beliefs about productivity (Mobius and Rosenblat, 2006), a beauty premium showing a positive correlation between earnings and beauty (Hamermesh and Biddle, 1994) and a negative relationship between obesity and call-back rates when applying for jobs (Rooth, 2009a).
price to avoid interaction with this group. This is defined as taste-based discrimination by Becker (1971). An employer with preferences against immigrants may, for example, choose to hire an applicant from the dominant population although he/she has lower qualifications than those with a foreign background.
According to Becker (1971), taste-based discrimination presumes social interaction be-tween agents to affect behavior. As the experiment conducted in this study excludes all forms of social and financial interaction between subjects and candidates, subjects’ un-willingness to interact with or financially reward a particular group of people will not explain any systematic findings between attributes and beliefs about performance. In-stead, systematic behaviors will be attributed to ethnic stereotypes regarding group dif-ferences in productivity reflecting either correct estimations of group averages (statistical discrimination) or incorrect estimations (error discrimination). However, some individ-uals might possess a strong distaste for particular groups of people which might affect their betting behavior despite the absence of interaction with these groups. Our inter-pretation of the results will assume the absence of such strong tastes. Moreover, stereo-types about group characteristics might originate from a distaste for some groups that have consciously or unconsciously been translated into beliefs about group averages, i.e. stereotypes and taste might be endogenously determined. This study cannot distinguish the source to beliefs about group characteristics that can be attributable to taste.
Finally, it is important to note that stereotypes assigned to an individual perceived or not perceived as having stereotypically Swedish looks may depend on if the person is a man or a woman. Eagly and Kite (1987) find empirical evidence suggesting that the gen-eral stereotypes of nationalities are more similar to the stereotypes of men in these nations and that the stereotypes of women may differ greatly from the stereotypes of men with the same nationality. Supporting the findings by Eagly and Kite (1987), a Swedish study using the correspondence testing method, Arai et al. (2008), finds that negative priors
are much stronger towards male applicants with Arabic-sounding names as compared to female applicants with Arabic-sounding names. In addition, the subordinate male target hypothesis in psychology (SMTH) argues that in terms of ethnic discrimination, both the gender of dominant groups and minority groups is of importance (Sidanius and Venie-gas, 2000). SMTH predicts that ethnic discrimination is primarily a form of intra sexual competition and is mainly perpetrated by males and directed against males due to their more dominant position and more aggressive nature.14 This prediction has been con-firmed in experimental studies by, for example, Fershtman and Gneezy (2001), Ahmed (2009) and Arai et al. (2008).
3
Experimental Set-up
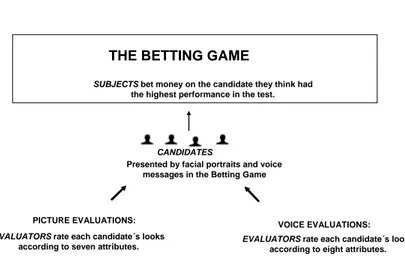
An overview of the experimental set-up is depicted in Figure 1. The experiment in-volves three web-based computer programs (The Betting Game, Picture Evaluations and Voice Evaluations) and four different groups of participants (Candidates, Subjects, Pic-ture Evaluators, Voice Evaluators). The group called Candidates has done a test of knowl-edge and is presented in the Betting Game by their facial portraits and voice messages. Subjects participating in the Betting Game are shown a number of randomly drawn can-didates and are rewarded for correctly guessing which of the cancan-didates had the highest performance on the test of knowledge. Finally, two evaluation programs are run with separate groups of students (Picture evaluators and Voice evaluators) to evaluate the looks and speech of candidates according to a number of attributes.
Motivation for the Experimental Set-up
To explore how an individual’s looks and speech affect beliefs about his or her perfor-mance, a web-based experiment called the Betting Game is conducted. The subjects par-ticipating in the Betting game are shown a number of candidates and are rewarded for
14This is contrary to an earlier hypothesis, known as Double Jeopardy Hypothesis (DJH), arguing that
women from minority groups will suffer from dual discrimination, based on gender and ethnicity (Beale, 1995).
Figure 1: Overview of Experimental Setup
CANDIDATES
Presented by facial portraits and voice messages in the Betting Game
THE BETTING GAME
SUBJECTS bet money on the candidate they think had
the highest performance in the test.
PICTURE EVALUATIONS:
EVALUATORS rate each candidate´s looks
according to seven attributes.
VOICE EVALUATIONS:
EVALUATORS rate each candidate´s looks
according to eight attributes.
correctly guessing which of the candidates has the highest score on a test of knowledge. As such, the experiment resembles a hiring situation in the labor market where an em-ployer evaluates a pool of applicants and tries to choose the candidate with the highest productivity.
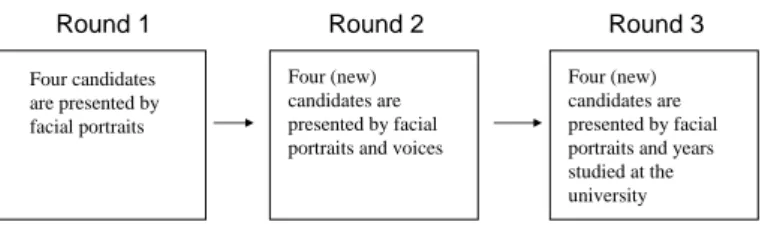
The subjects are exposed to three experimental treatments (see Figure 2). In the first round, candidates are presented by facial portraits and years of age. Assuming that a person’s looks does not give any information about performance, we would expect sub-jects to allocate bets randomly among the candidates given their age. A systematic bet-ting behavior would, on the other hand, indicate that there exist stereotypes linking facial characteristics to performance. To see if the beliefs triggered by looks (in the first round) are altered when additional information about spoken language is provided, the second round presents candidates by facial portraits and voice messages. Finally, the third round tests the strength of negative stereotypes found in the first round by presenting the
candi-Figure 2: The Betting Game
Round 1 Round 2 Round 3
Four candidates are presented by facial portraits Four (new) candidates are presented by facial portraits and voices
Four (new) candidates are presented by facial portraits and years studied at the university
In each round SUBJECTS bet, by allocating money stakes, on the candidate they think had the best performance on the test of knowledge.
dates with facial portraits and a measure of human capital relevant for test performance. If looks, as found by Castillo and Petrie (2010), are only used to predict behavior when no other relevant information is available, we would expect a weaker link between looks and beliefs about performance when information relevant for test performance is included.
The test of knowledge that is used to measure candidate performance is a key feature of the experiment. The subjects will obviously rate the candidates on basis of the skills necessary to perform well in this particular test. To obtain an evaluation of candidate performance that is relevant in a labor market context, the candidates were given a test of verbal and logical reasoning taken from practice entrance-exams for employment in the European Union, measuring the proficiency in understanding and analyzing short texts.15 To ensure that the subjects rated the candidates according to these abilities, the subjects were given a detailed description of the test and were shown one of the
tions included in the test before being asked to place bets (see Table A-1).
As the test requires abilities in both verbal and logical reasoning, it is a priori not ob-vious how subjects will allocate bets between individuals perceived as having ”stereo-typical Swedish” looks or not and individuals perceived as having native-like or foreign-accented speech. As the test is in Swedish, it could be argued that, assuming that all can-didates have the same logical skills, subjects will bet on cancan-didates with ”Swedish” looks and a native-like speech since they might be presumed to have higher verbal reasoning skills in Swedish. Grammatically incorrect speech can naturally be seen as an indicator of poor language skills and may decrease productivity in tasks where such skills are neces-sary. To diminish the effect of differences in language proficiency and focus on the role of foreign-accented speech, all candidates are asked to read standard texts in grammatically correct Swedish. Hence, all candidates speak grammatically correct Swedish but some of them speak more native-like than others. However, as the text messages read by the candidates are relatively short, they might not be good predictors of Swedish language proficiency. Foreign-accented Swedish might then be used as a signal of low proficiency in more complicated contexts. On the other hand, the subjects also know that all candi-dates are students at Stockholm University which guarantees a certain level of language knowledge. In addition, the subjects may not believe that all candidates share the same level of logical reasoning. The poor math skills among Swedish students is a publicly de-bated issue and subjects may hold stereotypes associating students originating in some foreign countries with higher levels of logical reasoning compared to students with a na-tive background and hence, allocate less money to candidates with stereotypical Swedish looks.16
The subjects anonymously indicate their beliefs about candidate performance by
allo-16Trends in the International Mathematics and Science Study, performed by the US Department of
Edu-cation 2007, show that Sweden ranks 15 among 59 countries in math skills in grade eight and has a lower average than other EU/OECD countries in grade four.
cating money bets of different fixed magnitudes (SEK 10, 20 and 40).17 They are allowed
to bet all the amounts on one candidate or distribute them over two or three candidates. To ensure that subjects put effort into their evaluations and bet according to their true beliefs, subjects are only rewarded by bets on the candidate with the highest test score. In this way, subjects who form beliefs about candidates’ test performance based on the provided facial portraits and voice messages maximize their payoffs by acting according to these beliefs.
Nevertheless, even if the subjects are anonymous and have incentives to place their bets strictly according to their true beliefs about performance ranking, we cannot rule out that subjects may stake some amount on certain candidates only to signal (perhaps to themselves) that their behavior is not influenced by stereotypical beliefs about particular groups of people.18 This reasoning implies that any measure of the probability of receiv-ing the highest bet in a group of candidates is probably a better measure of the subject’s true performance rating compared to a measure of the average bet received. The relative size of the money bets has therefore been chosen in such a way that the subjects always have to choose one ”top” candidate. Focusing on the candidate receiving the highest performance rating in a group of candidates also mimics the real labor market employ-ment process where often only the top candidates are chosen from a pool of job-seekers.19
To receive a rating of candidate looks and speech that is independent of the performance rating obtained in the Betting game, two new groups of subjects (called evaluators) were asked to rate each candidate’s facial portrait and voice recording according to a number
17Correspond to about 1 Euro, 2 Euro and 4 Euro, respectively.
18A motivation for such behavior could, for example, be found in the model of utility maximization
de-veloped by Levitt et al. (2006) where utility depends on both wealth and an individual’s desire to ”do the right thing” or make the ”moral” choice.
19It is important to note that subjects’ allocation of bets might depend on their beliefs about the
aver-age performance of different groups but also on the distribution of performance of candidates within these groups. As the subjects are only rewarded from bets on the candidate with highest performance, the propor-tion of high performing candidates is of importance as well as the shape of the distribupropor-tion and the number of individuals drawn from each distribution. However, as the set-up of the experiment does not fix the number of candidates drawn from each group, it is not easy to predict which distribution is preferred over another.
of attributes including our two main variables of interest, i.e. to what degree the candi-date is perceived as having stereotypical Swedish looks and to what degree the candicandi-date speaks native-like Swedish. As the subjects participating in the Betting game and evalu-ators are all undergraduate students and recruited in the same way, how the candidates are perceived by the evaluators will be a good approximation of how they are perceived by the subjects playing the Betting game. As candidates who have been perceived differ-ently in our main variable of interest might also have been perceived differdiffer-ently in other attributes, the evaluators were asked to rate the faces and voices according to a number of attributes that may affect beliefs about performance, for example if the candidate ap-pears educated and trustworthy and sounds determined, alert etc.
The performance rating obtained in the Betting game combined with the attribute rat-ings made by the picture and voice evaluators will show how each attribute affects beliefs about candidate performance.
The Betting Game Procedure
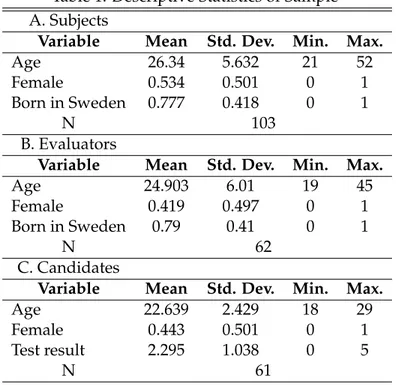
The experiment was conducted on undergraduate students (subjects) at Stockholm Uni-versity and the Royal Institute of Technology (KTH) in April, May and August 2009. In total, 103 subjects performed the Betting Game. The subjects performed the experi-ment in computer rooms where the computers were separated by screens to guarantee the anonymity of each participant. The subjects’ choices were recorded with an anony-mous subject-number and the experiment ended with a set of survey questions.20 Table
1 (A) shows descriptive statistics for the subjects who participated in the Betting Game. The average age of the subjects is 26, 53 percent are female and 78 percent were born in Sweden. The Betting Game starts by informing the subjects that they are going to meet undergraduate students from Stockholm University (called candidates) who have all taken a test of verbal reasoning. They are also shown a question from the test and
20Surveys questions included; gender, age, major, country of birth, name of secondary school and, finally,
given instructions for how the betting procedure works.
All subjects then play three rounds of the Betting game (recall Figure 2). In each round, the subjects are given three sums of money (SEK 40, 20, 10) and are asked to bet them on the candidate(s) they think had the best result on the test. They can bet all the amounts on one candidate or distribute them over two or three candidates. The amount placed on the candidate with the highest test-score (among four candidates shown to the subjects) is doubled and given to the the subject as a reward.21The subjects were rewarded a fixed
amount of 50 SEK (about 5 Euro) as a show-up fee and could, in addition, earn up to a maximum of 420 SEK (about 45 Euro) in the Betting Game.
In the first round, the subjects meet four randomly chosen candidates in the form of facial portraits and are also given information about each candidate’s age (see Figure A-1 in Appendix). In the second round, four (new) candidates are presented in the form of facial portraits and voice recordings. The subjects have to listen to all voice recordings in a given order before they can start distributing their bets. In the third round, the subjects once more meet four new candidates in the form of facial portraits but now combined with information about how many years each candidate has studied at the university (instead of providing information about age as in the first round). The number of years at the university is, in fact, a randomly drawn number between one and four.
All candidates appearing on a subject’s computer screen are randomly drawn from the total sample of candidates with three restrictions. First, a participant never sees the same candidate more than once, i.e. the candidates are randomly drawn but without replace-ment. This means that each participant meets twelve unique candidates in the three rounds of the game. Second, to include a ”gender dimension” in each betting decision, at least one woman and one man are set to appear among the four candidates. Third, at most two of the four candidates can have looks not perceived as stereotypically Swedish.
An important reason for imposing the second and third restriction was to make it more difficult for the subjects to deduce the purpose of the experiment.
The Procedure of Voice and Picture Evaluations
The voice and picture evaluations were conducted in the same general time period as the Betting Game. The evaluators were undergraduates at Stockholm University and the Royal Institute of Technology. The evaluations were performed in computer rooms with the same anonymity procedures as in the Betting Game and with the same survey questions at the end of the session. The evaluators who performed the characterization of voices and faces were rewarded with the fixed amount of 150 SEK. Table 1 (B) shows the descriptive statistics of the 62 students who participated in the evaluations. The average age of the candidates is around 25, 42 percent are female and 79 percent were born in Sweden. The evaluators are thus similar to the subjects who participated in the Betting Game in these observable characteristics.22
Table 1 here
In the voice evaluation program, each evaluator listened to approximately 20 voices. For each voice, eight statements regarding eight different attributes were given and the par-ticipant had to decide to what degree the given statement was correct for the voice in question. Evaluators did this on a scale from 1 to 10 where 1 is ”The statement is to-tally wrong” and 10 is ”The statement is completely right”. The order in which the voice messages appeared was randomly determined as was the order in which the statements appeared for each voice/picture. The statements used for voice evaluations are listed in the first column of Table A-2. 23 The statement ”grown up abroad” was included to indicate if a person speaks native-like Swedish or not. The statement ”grown up in Stock-holm” was also included to make the statement ”grown up abroad” not stand out as the
22The mean values for the evaluators and subjects do not significantly differ in t-tests.
23Previous research has shown that individuals form attitudinal judgments of a speaker based upon his
voice in different attributes such as pleasant, insecure etc that might affect personal evaluations (Mulac et al., 1974; Parton et al., 2002).
sole geographical attribute.24
In the picture evaluation program, we ask the evaluators to look at 30 facial portraits and decide, as in the voice evaluation program, to what degree each statement is correct for each face. To avoid racial profiling, the evaluation of facial portraits was made in a stereotypical framework. The evaluators were briefly informed about stereotypes and that there often exists a generally accepted view (i.e. a stereotype) of what is typical for people having a particular characteristic or attribute. Accordingly, the evaluator was not asked to rate the candidate’s face according to his or her personal opinion, but rather ac-cording to what degree the candidate’s face corresponds to the generally accepted view in society concerning how a person with a certain attribute appears to other people. For example, when asking about the attractiveness of the candidate, the evaluator was asked ”On a scale from 1-10, to what degree do you think this person’s looks corresponded to the generally accepted view of attractive looks?”. As in the voice characterization pro-gram, evaluators answer the questions by rating attributes on a scale from 1 to 10. The list of evaluated attributes is shown in Table A-2.25
A critique that can be raised is that the given list of attributes prompts subjects to react to characteristics (such as having ”stereotypical Swedish” looks) they might not otherwise have perceived. To explore this issue, we conducted a ”free-text” version where we de-scribed the context of the Betting Game and asked the subjects to look at the candidates’ facial portraits and tell us which facial attributes they believed would be essential in the betting decision. Notice that the free text question was answered by a group of students who were neither involved in the Betting Game nor in the evaluation programs. 64 per-cent of the students have stated, regarding one or more candidates, that having ”foreign
24This is a relevant question due to different dialects in different geographical parts of Sweden. As the
attribute ”grown up in Stockholm” was not motivated by earlier research but only included to remove some of the attention from the question regarding foreign accent, the ratings for ”grown up in Stockholm” are not included in the empirical analysis.
25Asking the subjects to rate the candidates according to what ”other people” think instead of according
to their own personal opinion also diminishes the potential problem of receiving socially desirable answers Fisher (1993).
looks” or ”non-Swedish looks” may be important attributes for the allocation of bets.26
This suggests that having stereotypical Swedish looks is an attribute that might affect beliefs about performance in the Betting Game.
Pre-Experimental Work
In the run-up to the experiment, 61 undergraduate students (candidates) at Stockholm University were recruited from November 2008 to April 2009 for three tasks. First, the students were told to read four short messages written as short personal introductions of a very general nature with the aim of being contextually meaningful without revealing personal information that is important for performance (see Table A-3 in the Appendix). The purpose of having each student record four different messages was to allow ran-domization of texts among the four candidates presented to each subject in each round of the Betting Game, thereby removing possible text effects. The voice recording process was managed by a PhD student in linguistics who also adjusted the recordings to be as similar as possible in volume etc and removed any background noise.
Second, a photograph (facial portrait) of the candidates was taken in front of a white background. The photos were later adjusted to passport format by a professional pho-tographer who also adjusted the photos to be as similar as possible for all candidates. The third task was to take a test consisting of five multiple-choice questions. The test stems from practice entrance-exams for employment in the EU and aims at measuring profi-ciency in understanding and analyzing short texts. The questions were translated into Swedish and each question consisted of a short text followed by four sentences. The task was to choose the sentence that could best be inferred from the text. The students could spend at most six minutes doing the test and they were rewarded with a fixed show-up fee (50 SEK) plus 10 SEK for each correct answer in the test to prevent careless answers.
26The free-text question was answered by eleven students of whom seven used (for one or more
candi-dates) the expressions foreign looks, non-Swedish background etc as attributes that may be important in the betting decision.
Table 1 (C) shows the descriptive statistics of the candidates who provided the photos and voice recordings. 44 percent of the candidates are female, the average age is around 22 and the average test score obtained in the test is 2.29.27 Only one candidate has re-ceived the score 0 and one candidate has rere-ceived the score 5, suggesting that the diffi-culty of the test was at an appropriate level. The voice recordings, photos and test results were then used in the Betting Game and in the two evaluation programs constructed by a firm specialized in web-design programming.
4
Data and Empirical Strategy
Ratings of Attributes
All facial portraits and voices were characterized on a set of attributes by between 11-14 evaluators. For each picture and voice, we calculate the median score of these ratings for each attribute.28 Table 2 shows descriptive data for median ratings by attribute and gender. The statistics show clear gender differences in median ratings. Women are, on average, assigned higher scores in all facial and voice attributes that can be considered as ”positive” and lower scores on ”negative” voice attributes such as tired and insecure. Women are also, on average, perceived as more typically Swedish in their appearance and to a lower degree as having grown-up abroad, i.e. speaking foreign-accented Swedish.
Table 2 about here
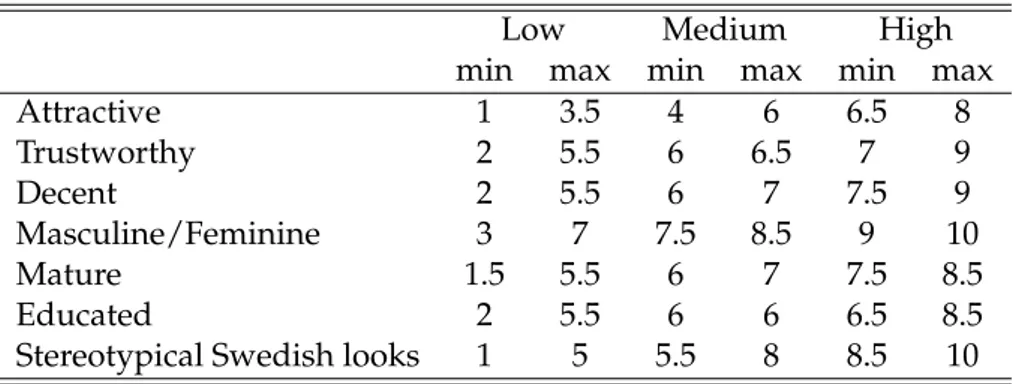
Although a rating scale of 1 to 10 was used in the evaluations, in the analysis, we com-pare those who obtained a rating in the upper part of the rating distribution with those in the lower part of the distribution. The ratings for each attribute were therefore divided into a low, medium and high category. For each attribute, the low category was defined as those with a median score belonging to the lowest third of the rating distribution. The
27The proportion of female candidates and subjects do not significantly differ in a t-test. The average age
for candidates and subjects differs significantly in a t-test.
high category indicates the ratings belonging to the top third of the rating distribution and the medium category contains all ratings in between.29 As shown in Table 2, the rating distribution differs between attributes, thus making it difficult to categorize the ratings according to the same cardinal index. Indeed, an evaluator might have different scales in her/his mind for different attributes. The subsequent defined categories thus allow different scales for different attributes.
Table 3 and Table 4 show the distribution of ratings within the subsequent defined cate-gories (low, medium, high) for each face and voice attribute. Among the facial attributes (Table 3) except for attractive, all ratings of five and below are found in the low category indicating that a large share of the pictures have been rated by a score above five. The last row in Table 4 shows that a large part of the voices has received rating 1 or 2 for the attribute ”grown up abroad”, indicating that many of the candidates were perceived to speak native-like Swedish. It also signals that using the high category of this attribute as an indication of speaking foreign-accented Swedish might be misleading since a rating of, for example, 3 may actually indicate speaking native-like Swedish and not foreign-accented Swedish. To capture the individuals with the highest rating in this attribute we therefore define a dichotomous variable (called ”Swedish with an accent”) taking the value of one for voices with ratings belonging to the top 20 percent and zero otherwise. This categorization implies that voices with a rating equal to or above six in the statement ”grown-up abroad” are categorized as speaking Swedish with an accent and those with a rating below six as speaking native-like Swedish.30
Table 3 and Table 4 about here
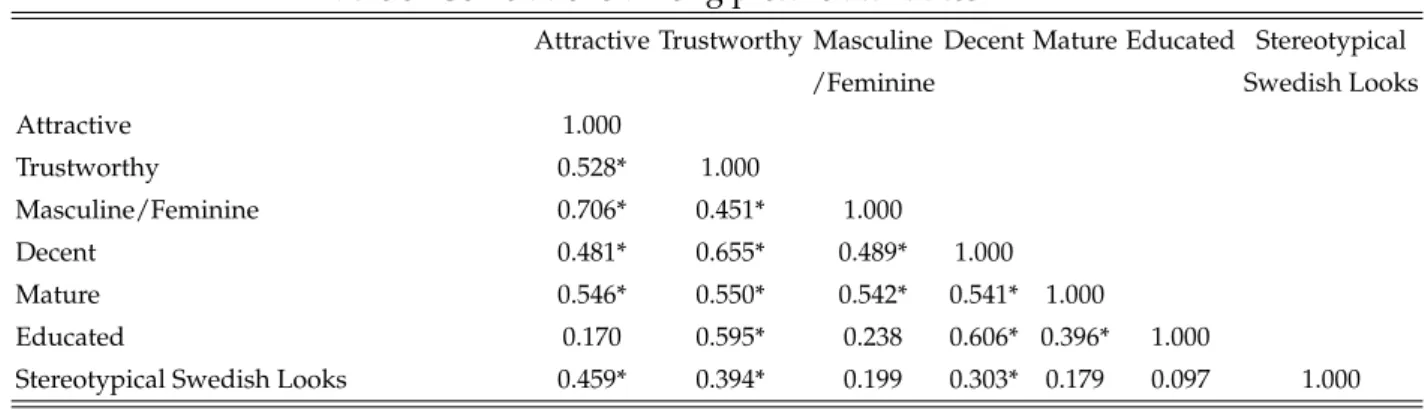
Correlations for facial attributes are shown in Table 5. Many of the facial attributes are positively correlated. For example, those perceived as having stereotypical Swedish
29This categorization translates the ratings into an ordinal scale in the sense that we do not assume that
if person A characterized picture 1 with score 4 and picture 2 with score 8 in attractiveness, picture 2 is not necessarily twice as attractive as picture 1.
30The sensitivity of this categorization is analyzed by defining all candidates in the top 25 percent as
looks have to a higher degree been rated as being attractive, trustworthy and decent.
Correlations for voice attributes are presented in Table 6. It is clear that some attributes can be considered as ”positive” whereas others as ”negative”. The attributes determined, alert, pleasant and dedicated are positively correlated with each other while negatively correlated with the attributes tired, insecure and speaking a foreign-accented Swedish. A striking observation is that the candidates perceived as not speaking native-like Swedish are also perceived as more insecure and less determined and dedicated.
Table 5 and Table 6 about here
Empirical Strategy
The experimental results will first be presented in a descriptive manner focusing on the probability of receiving the highest bet given a low, medium or high rating for each face and voice attribute. The highest bet is defined as 1 for the candidate who received the highest money bet among the four candidates of each round in the Betting Game and 0 for the three other candidates. Motivated by earlier research stressing the importance of looking at gender interactions, the probability of receiving the highest bet is explored by both the gender of the subject and the gender of the candidate (Fershtman and Gneezy, 2001; Ahmed, 2009; Arai et al., 2008).31
As differences in mean values are unconditional and many of the attributes are corre-lated, linear probability models are then used to estimate the probability of receiving the highest bet on having stereotypical Swedish looks and speaking native-like Swedish, given the same ratings in all other attributes.
Using data from all three rounds, the probability of receiving the highest bet is estimated focusing on the effect of stereotypical Swedish looks to a low, medium or high degree
(recall that the presentation of candidates in the Betting Game included a facial portrait in all three rounds). As the information available to subjects differs between rounds, the second step of the regression analysis estimates the probability of receiving the highest bet separately by round. Regressions based on data from the first round where candi-dates are presented by their facial portraits and age only use the same specification as in the regressions based on data from all rounds. Estimations based on the second round therefore include the dummy variable ”Speaking Swedish with an accent” defined earlier in this section. As the candidate’s voice message is based on one randomly chosen text out of four, these estimations based on the second round also include dummy variables indicating the text read by the candidates. Estimations based on the third round use the same specification as in the first round but add a variable measuring each candidate’s number of years at the university.
As previously shown, correlations are generally high among the attributes used to char-acterize facial portraits and among the attributes used to charchar-acterize voices. As highly correlated attributes, such as decent and trustworthy, may in fact measure the same un-derlying construct, a principal component analysis (PCA) has been used to reduce the number of variables.32 PCA was performed for all attributes related to facial portraits
(except being perceived as having Swedish looks) and for all attributes related to voices (except speaking foreign-accented Swedish). The derived components from the PCA are then used in the regressions to control for the candidate’s ratings in all other attributes.33
The last step of the regression analysis estimates the probability of receiving the
high-32In short, principal component analysis (PCA) calculates a composite measure of variables indicating
the same information by taking the weighed sum where the variable with the largest variance is given the largest weight.
33For facial attributes, PCA analysis (see Table A-4) generated two components with eigenvalues larger
than one that have been included in all regressions to control for facial attributes. The first component has roughly the same positive loadings in all included attributes and is called FA1 (face attributes 1) and the sec-ond component (FA2) has high positive loading in the attribute educated and high negative loadings in the attributes attractive and masculine/feminine. For voice attributes, two PCA components were generated, VA1 is dedicated to positive voice attributes (alert, nice and decisive) and VA2 is dedicated to negative voice attributes (tired and insecure).
est bet by the gender of the subject and the candidate. Using data from all three rounds, four different sub-samples are defined: (1) male subjects and male candidates, (2) male subjects and female candidates, (3) female subjects and male candidates and (4) female subjects and female candidates.34
All estimations also control for the gender and age of the candidates. Standard errors are corrected for any unknown form of heteroscedasticity and clustered by both subject and candidate in order to correct for possible serial correlation within these groups.
5
Empirical Results
Highest Bet and Attribute Ranking
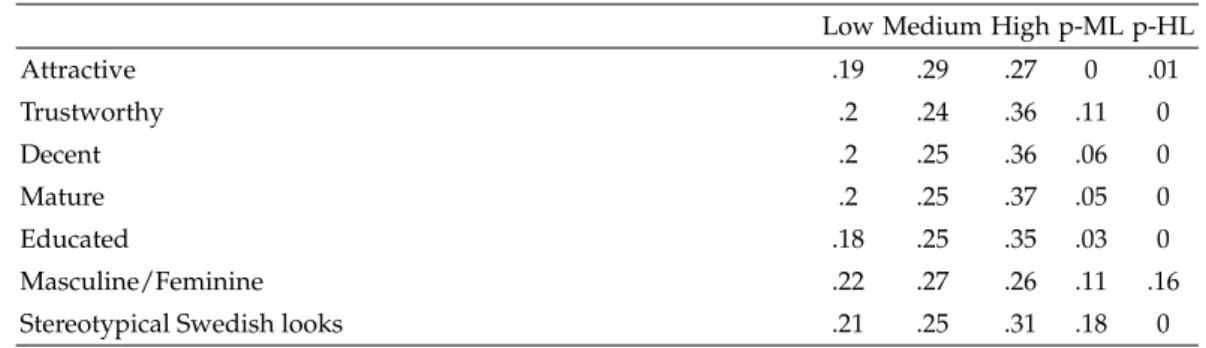
Table 7 presents the probability for a candidate of receiving the highest bet (in a group of four candidates) depending on how the candidate has been rated according to the seven attributes used to characterize facial portraits. Columns 1-3 show the probability of re-ceiving the highest bet given a low, medium or high rating in each attribute. Columns 4 and 5 show the p values testing the difference between the low/medium and low/high categories, respectively. Generally, the probability of receiving the highest bet is increas-ing in each attribute. For all attributes except masculine/feminine, the high category has a significantly higher probability of receiving the highest bet as compared to the low cat-egory. 31 percent of the candidates rated as having stereotypical Swedish looks to a high degree receive the highest bet. The corresponding percentage for those with low ratings is 21.
Table 7 about here
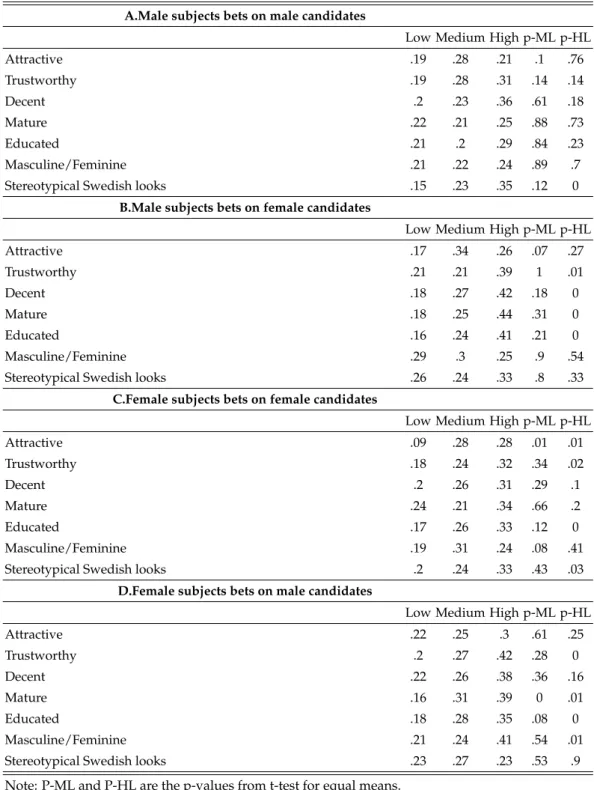
Table 8 re-examines the probability of receiving the highest bet given attribute ratings by both the gender of the subject and the gender of the candidate. Parts A and B in Table
34Notice that the limited number of observations prohibits us from looking at gender-interactions in each
8 indicate that male subjects put a different importance on the attributes depending on whether the evaluated candidate is a man or a woman. When a male candidate is evalu-ated by a male subject, the attribute of having Swedish looks is the only attribute where belonging to the high category results in a significantly higher probability of receiving the highest bet as compared to belonging to the low category. The last row in Part A shows that the probability of getting the highest bet is 35 percent for a candidate char-acterized as Swedish-looking (category 3) while it is only 15 percent for a candidate not perceived as such (category 1). On the other hand, as shown in Part B, a female candidate characterized as trustworthy, decent, mature and educated to a high degree has a signif-icantly higher probability of getting the highest bet from a male subject as compared to a female candidate characterized as not having these attributes (low category). Being perceived as typically Swedish thus seems to be important when male subjects evaluate male candidates, but not when they evaluate female candidates.
Table 8 about here
Parts C and D in Table 8 present the betting behavior of female subjects. Part C shows that the probability of getting the highest bet for a male candidate being evaluated by a female subject is increasing in all attributes except having typically Swedish looks.35 A female candidate evaluated by a female subject (part D) is significantly more likely to receive the highest bet if her facial portrait is characterized as attractive, trustworthy, decent, educated and typically Swedish as compared to not being characterized as such. Being perceived as typically Swedish thus has a positive effect on beliefs about perfor-mance when men evaluate other men and when women evaluate other women, but not in cross-gender evaluations.
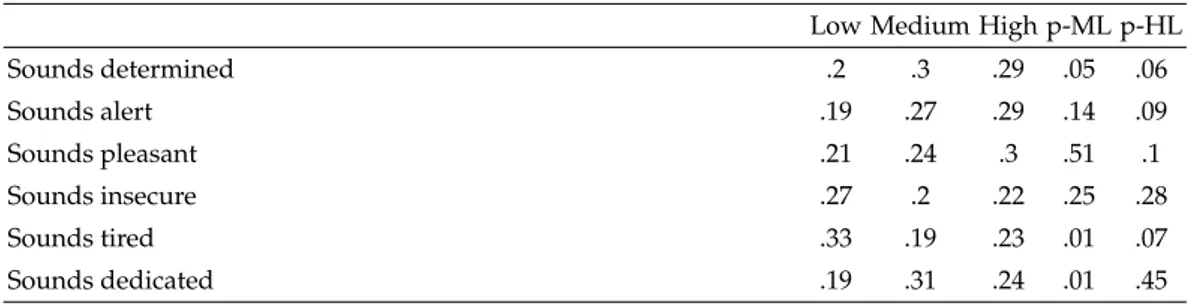
Table 9 presents the probability of receiving the highest bet given the ratings in the seven voice attributes. Note that voice recordings are only present in the second round of the Betting Game which makes the sample size smaller. In general, having a voice
charac-35Notice that the differences between the top and low categories are not significant for the attributes
terized as decisive, alert and not tired yields a higher probability of receiving the highest bet. The probability of receiving the highest bet is 11 percent (not shown) for candidates speaking Swedish with an accent compared to 28 percent for candidates with a native-like speech and the difference is highly significant (p value lower than 0.01).
Table 9 about here
The descriptive analysis has also been conducted using two alternative measures of re-ceived bets in the Betting Game: average bets rere-ceived and the probability of receiving a zero bet. Stereotypical Swedish looks and speaking native-like Swedish are found to be positively correlated with average bets received but negatively correlated with receiving zero bets.
Regression Results
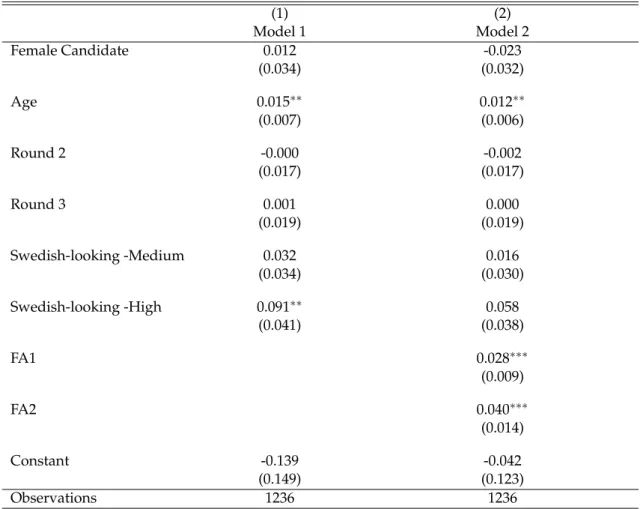
Table 10 presents results from linear probability models estimating the probability of re-ceiving the highest bet using data from all rounds. The results in column 1 show that candidates perceived to have stereotypical Swedish looks (high category) are associated with a 9 percentage point higher probability of receiving the highest bet in comparison to the candidates not perceived as such (low category). Notice that a random allocation of the highest bet among four candidates implies a 25 percent probability of receiving the highest bet for each candidate, hence a 9 percentage point higher probability implies 20.5 and 29.5 percent probabilities of receiving the highest bet for candidates in low and high categories, respectively. This indicates a 44 percent higher probability of receiving the highest bet for candidates perceived to have typically Swedish looks compared to can-didates not perceived as such. Cancan-didates rated in the medium category do not signifi-cantly differ from those in the low category. The probability of receiving the highest bet is also increasing in the candidate’s age but does not differ by gender. Including the two PCA components (FA1 and FA2) controlling for the candidates’ ratings in all other facial attributes (column 2) decreases the coefficient for having stereotypical Swedish looks to 5.8 percentage points and increases the p-value to 0.13. Instead, the ratings for the other
attributes (FA1 and FA2) are found to be significantly associated with the probability of receiving the highest bet. As the candidates perceived as having Swedish looks also to a higher degree are perceived as more decent, trustworthy etc., one interpretation of these results is that the effect of being perceived as typically Swedish is now captured by other facial attributes. In other words, individuals who are not perceived as having stereotypi-cal Swedish looks are associated with stereotype notions inducing lower ratings in other facial attributes that are positively related to beliefs about performance.
Table 10 about here
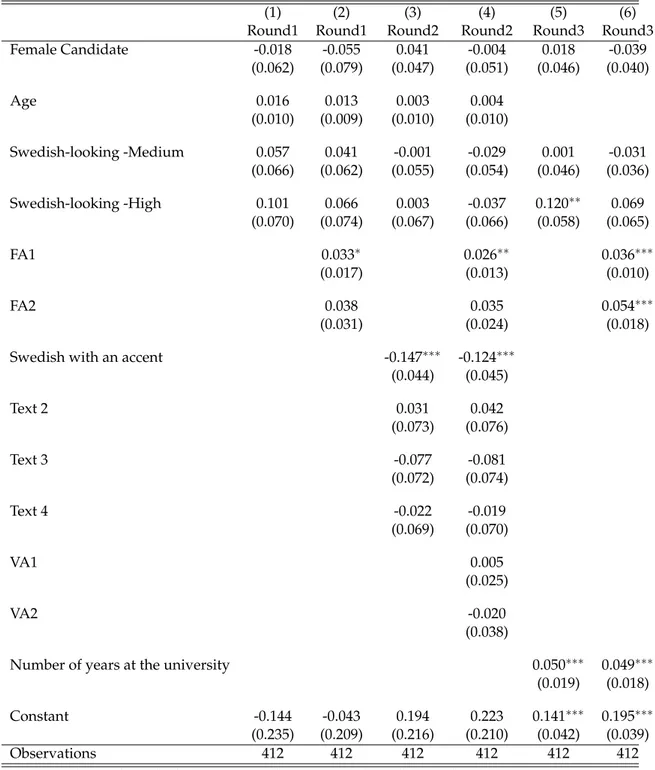
Table 11 presents estimation results separately by each round. In columns 1 and 2, the same analysis as in Table 10 is conducted for round 1 where the only information pro-vided was facial portraits and the age of the candidates. Columns 3 and 4 report results for round 2 where candidates were presented by both facial portraits and voice messages. Finally, column 5 analyzes data from the third round where facial portraits were shown together with information about the number of years studied at the university. The re-sults for round 1, in columns 1 and 2, are similar to that found for the entire sample but the standard errors are higher due to the smaller number of observations.
Table 11 about here
When estimations are based on round 2 where candidates are presented by both facial portraits and voice messages, being perceived as having stereotypical Swedish looks no longer affects the beliefs about performance. Instead, the results show a highly signif-icant negative effect for speaking Swedish with an accent. A candidate perceived to speak foreign-accented Swedish has a 14 percentage point lower probability of receiv-ing the highest bet as compared to a native-like speakreceiv-ing candidate. This corresponds to a 78 percent lower probability of receiving the highest bet for candidates speaking foreign-accented Swedish as compared to candidates speaking native-like Swedish. The negative effect of speaking Swedish with an accent remains in column 4 when controls for all other facial and voice attributes are included in the analysis. As the inclusion of
voice messages eliminates the effect of being perceived as having typically Swedish looks found in round 1 (columns 1 and 2),the results indicate that stereotypes associated with a foreign-accented speech dominate stereotypes associated with looks to atypical Swedish looks.
Estimations based on the third round are presented in columns 5 and 6. Information about how many years a candidate has studied at the university is found to positively affect the probability of receiving the highest bet. An additional year at the university increases the probability of receiving the highest bet by 4.9 percentage points. However, providing this information does not diminish the effect of being perceived as having Swedish looks as the coefficient for the top category in this statement (column 6) does not differ as compared to the results from the first round (column 2) where facial por-traits and age are the only information available. However,there has been a decrease in the coefficient for those categorized in the middle range for typically Swedish looks, in-dicating that the subjects alter their beliefs about the candidates not perceived as either having distinctively Swedish looks or not.
5.1 Gender-interactions
The descriptive analysis suggested that in their evaluation of candidate performance, subjects put more importance on some of the facial attributes than others, including hav-ing stereotypical Swedish looks, dependhav-ing on the gender of the candidate (see Table 8). Table 12 shows the estimations on four sub-samples of the aggregated data for all three rounds.36
The results show that the most pronounced effect of being perceived as having stereo-typically Swedish looks occurs when male subjects evaluate male candidates (column 1). A candidate rated in the top third according to having stereotypical Swedish looks has
36To be able to divide the sample by the gender of the participant and the gender of the subject, we use
an almost 18 percentage point higher probability of receiving the highest bet in compari-son to those rated in the lowest category. The other facial attributes, represented by FA1 and FA2, do not have any significant effect, indicating that the signal of Swedishness pre-dominates other attributes. We also find a positive (but imprecisely measured) coefficient for having Swedish looks when female subjects evaluate female candidates (column 4). Interestingly, the effects are zero/negative in cross-gender betting. In cross-gender inter-actions, the effect of other face attributes is instead significant. These results confirm the findings in Table 8, i.e. the perception of looks as ”stereotypically Swedish” affects beliefs about performance in within-gender but not in cross-gender evaluations.
Table 12 about here
As faces are observed in our experiment, one possibility is that attraction might play a role in the evaluation of candidates from the opposite sex. Nevertheless, descriptive statistics shown in Table 8 do not provide any support for this hypothesis as the proba-bility of receiving the highest bet does not significantly differ between different categories of attractiveness, for example, when female subjects bet on male candidates.37
5.2 Beliefs and Actual Test Scores
The findings in the previous sections suggest that ethnic stereotypes based on looks and speech do affect subjects’ beliefs about candidate performance. As we have access to the candidates’ actual test scores, we can explore whether subjects’ beliefs correspond to ac-tual group averages.
Table 13 presents average test scores by the low, medium and high categories of being perceived as having stereotypical Swedish looks. Average test scores are found to be higher among individuals perceived as having stereotypical Swedish looks compared to those not perceived as such. Candidates perceived as having stereotypical Swedish looks
37Estimations where attractiveness is included as a separate variable have been run but no significant
to a low degree have a mean score of 2.0 while candidates with a medium and high rating in this attribute have mean test scores of 2.3 and 2.8, respectively. The null hypothesis that mean scores do not differ by category is rejected at a 5 percent level of significance test, comparing the candidates in the low and high category (Mann-Whitney test). This indi-cates that candidates perceived as having typically Swedish looks (high category) have a 40 percent higher test performance than those not perceived as such (low category). Thus, for the sample studied, the subjects’ differing beliefs about performance due to having or not having stereotypical Swedish looks correspond to actual mean differences of candidates’ performance and can be denoted as statistical discrimination.
The findings from the second round of the Betting Game show that subjects primarily base their beliefs about performance on speech. Indeed, when subjects have the possi-bility of evaluating the candidates by both their looks and speech, being perceived to have stereotypical Swedish looks does no longer affect the beliefs about performance. As shown in Table 13, the mean test scores for candidates speaking native-like and foreign-accented Swedish are not statistically significant. These findings suggest that ethnic stereotypes linking accented speech to lower levels of performance are not supported by corresponding mean differences in actual test scores.38 Allocating bets based on if the
candidate speaks Swedish with an accent or not can thus not be described as statistical discrimination but rather as error discrimination.39
38In an alternative approach we use rewards as the dependent variable and estimate the effect of the
two following strategies (1) to always place the highest bet on the candidate who to the highest degree is perceived as having stereotypical Swedish looks and (2) to always place the highest bet on a candidate speaking native-like Swedish. Neither of these strategies was found to significantly affect remuneration from the Betting Game.
39We have also studied whether the candidates’ test scores are correlated with other facial and voice
at-tributes. Among the facial attributes, being perceived as decent is found to be positively correlated with the actual test scores. None of the voice attributes are correlated with candidates’ test scores.
6
Summary and Conclusions
This study has explored how beliefs about individual performance are affected by ethnic stereotypes associated with looks and speech. As the study was conducted in Sweden, the specific questions were to what degree having stereotypical Swedish looks and speak-ing native-like Swedish affected expectations about performance.
Our results show that individuals who are perceived to have stereotypical Swedish looks are expected to have a higher performance, implying that subjects use facial attributes signaling group belonging as a proxy for performance-related characteristics. When com-paring individuals with the same ratings for all other facial attributes, the effect of having stereotypical Swedish looks becomes weaker. Instead, we find that other facial attributes are positively related to beliefs about performance. In line with the social-psychology lit-erature showing that people assign different attributes to different nationalities, we find that individuals who are perceived to have stereotypical Swedish looks also to a higher degree are perceived to look decent, trustworthy and attractive. One interpretation is that individuals are not treated unequally for not having stereotypical Swedish looks but rather due to stereotypes associated with such looks implying lower ratings in other fa-cial attributes which are positively related to performance.
The positive effect of being perceived as having stereotypical Swedish looks is primarily found when male subjects evaluate male candidates and to a smaller extent when female subjects evaluate female candidates but it is not found in cross-gender evaluations. These findings overlap with earlier research by, for example, Ahmed (2009) and Fershtman and Gneezy (2001) who show that it is primarily men who discriminate and Arai et al. (2008) who find that discrimination is mainly targeted towards non-native male job-candidates. Our findings indicate that the nature of discrimination is more complicated when more than one dimension (gender and ethnicity) is involved and that it is important to con-sider both the gender of the ”evaluator” and the gender of the person being ”evaluated”,
in accordance with, for example, the Subordinate Male Target Hypothesis (SMTH) in psy-chology (Sidanius and Veniegas, 2000).
When candidates are presented by both their looks and speech, the effect of having stereotypical Swedish looks disappears. Instead, we find a strong negative effect of speaking Swedish with an accent on beliefs about performance. This effect remains despite controls for numerous other facial and vocal attributes. One interpretation of these results is that, even though all candidates speak correct Swedish, having a foreign-accented speech might be used as an indicator of poor language skills and hence, a lower test performance. Another interpretation is that having native-like speech might, despite looks that are not considered as such, be apprehended as a mark of Swedishness which, in turn, is associated with higher performance. Importantly, the stereotypes linking foreign-accented speech to lower levels of performance are not supported by similar differences in candidates’ actual test scores, implying that allocating bets based on whether the can-didate speaks Swedish with an accent or not can be deemed as unequal treatment based on incorrect stereotypes (at least in this pool of university students).
Our results shed some new light on the mechanisms behind discrimination and indi-cate that the unequal treatment found in correspondence testing studies, for instance, could be due to stereotypes among employers regarding language proficiency of indi-viduals with foreign-sounding names. The positive interpretation of our results is that a native-like speech can mitigate negative beliefs about lower performance associated with appearance. In a policy perspective, our results indicate that an anonymous appli-cation process could indeed increase the hiring probability for individuals with foreign backgrounds by increasing the chances of being called to face-to-face interviews where uncertainty about language proficiency can be assessed.40 Our findings, on the one hand,
40Evaluating the results from an anonymous application procedure (AAP) conducted in Sweden, ˚Aslund
and Skans (2007) anonymous found that the AAP increased the probability of being called to an interview for individuals of non-Western origin but, on the other hand, did not have any effect on the probability of being offered a job.
stress the importance of language proficiency for subsequent labor market outcomes but, on the other hand, also the importance of an increasing tolerance for foreign-accented speech among the majority population. As first generation immigrants are more likely to have an accent, our findings suggest that the labor market gaps between first generation immigrants and natives, found in many studies, may partly be attributed to stereotypes related to foreign-accented speech.
However, it is difficult to say to what degree the results from our study can be gener-alized to other contexts and ,as in all laboratory experiments, extrapolating the findings to other groups in society must be done keeping in mind the nature of the subjects and candidates studied. The experiment is conducted on undergraduate students and the ethnic stereotypes found in this setting may therefore not be representative for those ex-isting in the population at large. Indeed, according to attitude measurements, undergrad-uate students are among those with the most positive attitudes towards immigrants in Swedish society.41 In addition, as the subjects, playing the Betting Game, know that they are evaluating other undergraduate students, the findings in this paper are generated in an interaction of peers (university students) and the stereotypes might for example, be higher for non-peer members.42 There is also a number of other factors suggesting
that the findings in this study provide a lower bound for ethnic discrimination based on appearance and speech. First, as all candidates speak correct Swedish, there is no variation in language proficiency between those speaking ”native-like” and ”accented” Swedish and the results can therefore not be generalized to grammatically incorrect spo-ken foreign-accented Swedish. Second, the candidates, presented in the Betting Game by facial portraits and voices, are university students and the variation captured in the treatments in terms of looks and speech therefore reflects individuals who are younger than the average population and probably have a weaker non-native accent than the immigrant population as a whole. Third, the unequal treatment found in this paper is
41See Lange and Westin (1993).
generated in a framework where social and financial interaction between subjects and candidates is absent. In a hiring situation on the labor market, a candidate might be un-equally treated based on both ethnic stereotypes and distaste for interacting.
In conclusion, conducting the experiment in other contexts and on other groups, where the variation in for example speech is larger, will allow for more externally valid conclu-sions regarding stereotypes towards individuals with non-stereotypical Swedish looks and foreign-accented speech.
References
A.M. Ahmed. What is in a surname? The role of ethnicity in economic decision making. Applied Economics, 42(1):1–9, 2009.
A.M. Ahmed, L. Andersson, and M. Hammarstedt. Can discrimination in the housing market be reduced by increasing the information about the applicants? Land Economics, 86(1):79–90, 2010.
D.J. Aigner and G.G. Cain. Statistical theories of discrimination in labor markets. Indus-trial and Labor Relations Review, pages 175–187, 1977.
R. Aigular and B. Gustafsson. Immigrants in Sweden’s labour market during the 1980s. Scandinavian Journal of Social Welfare, 3(3):139–147, 1994.
E. Allasino, E. Reyneri, A. Venturini, and G. Zincone. Labour market discrimination against migrant workers in Italy. International Migration Papers, 67:2007–03, 2004. D.M. Anderson and M.J. Haupert. Employment and statistical discrimination: A
hands-on experiment. Journal of Echands-onomics, 25(1):85–103, 1999.
M. Arai, H. Regn´er, and L. Schr ¨oder. Invandrare p˚a den Svenska arbetsmarknaden (Im-migrants in the Swedish labor market). Report to Expert Group in Public Economics, No.69, 2000.
M. Arai, M. Bursell, and L. Nekby. Between meritocracy and ethnic discrimination: The gender difference. Department of Economics, Working Paper 2008:4, Stockhom Uni-versity, 2008.
K. Arrow. The theory of discrimination, pages 3–33. Princeton University Press, 1973. O. ˚Aslund and O.N. Skans. Do anonymous job application procedures level the playing
field? Working Paper Series, IFAU-Institute for Labour Market Policy Evaluation, 2007. F. Beale. Double jeopardy: To be black and female. In Words of fire: an anthology of