STRONG INCREASE IN MANUFACTURING EMPLOYMENT CONTINUES
Seyfettin Gürsel
*Gökçe Uysal
∗∗and Ayşenur Acar
∗∗∗Abstract
Seasonally adjusted labor market data shows that non-agricultural unemployment rate remained stagnant in the
period of April 2013. After the crisis, non-agricultural unemployment rate decreased to 11.1 percent.
Non-agricultural unemployment rate has been moving within a tight band, between 11.4 percent and 11.9 percent. The
causes behind the stagnation are strong increases in both labor force and employment. Manufacturing employment
increased by 82 thousand in the period of April 2013. Hence, the increase in manufacturing employment reached
300 thousand in the last six months.
Increases over one million of employment and labor force
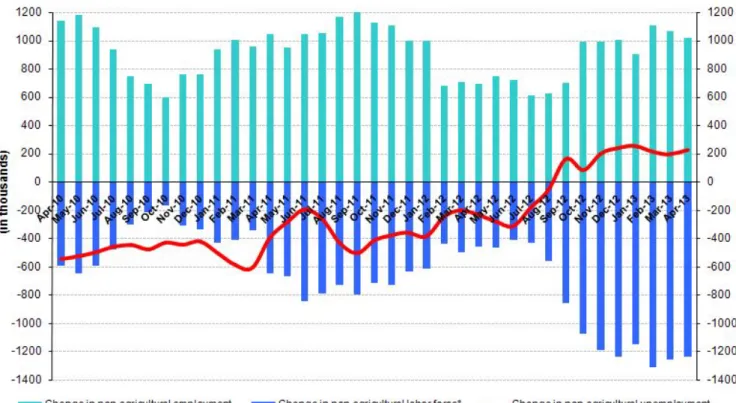
According to the data released by TurkSTAT, non-agricultural labor force increased by 1 million 240 thousand (5.9
percent) and non-agricultural employment increased by 1 million 14 thousand (5.4 percent) in the period of April
2013 (Figure 1). We observe strong increases in both non-agricultural labor force and non-agricultural employment
in the last six periods. Consequently, non-agricultural unemployment stagnates.
Figure 1 Year-on-year changes in non-agricultural labor force, employment and unemployment
Source: TurkSTAT, Betam
* Prof. Dr. Seyfettin Gürsel, Betam, Director, [email protected]
∗∗ Yrd. Doç. Dr. Gökçe Uysal, Betam, Vice Director, [email protected] ∗∗∗ Ayşenur Acar, Betam, Research Assistant, [email protected]
Labor Market Outlook:
July 2013
www.betam.bahcesehir.edu.tr
2
Seasonally adjusted non-agricultural unemployment remained stagnant in April 2013
According to seasonally adjusted data, non-agricultural labor force increased by 162 thousand and reached 22
million 223 thousand in the period of April 2013 compared to the period of March 2013 (Figure 2, Table 1).
Non-agricultural employment increased by 140 thousand and reached 19 million 628 thousand. Consequently, the
number of persons unemployed in non-agricultural sectors decreased by 22 thousand and non-agricultural
unemployment rate remained at 11.7 percent. Non agricultural unemployment that has been consistently
decreasing after the crisis decreased to 11.1 percent in the period of June 2012. Then, it increased slightly and has
moved within a tight band (from 11.4 percent to 11.9 percent). Non-agricultural unemployment rate stayed within
this tight band in the period of April 2013.
Figure 2 Seasonally adjusted non-agricultural labor force, employment and unemployment
Source: TurkStat, Betam
According to Kariyer.net data, non-agricultural unemployment will stagnate
Application per vacancy statistics calculated using Kariyer.net
1series indicate that non-agricultural unemployment
rate will continue to stagnate in the period of May 2013.
Figure 1 Seasonally adjusted non-agricultural unemployment rate and application per vacancy
Source: Kariyer.net, TurkStat, Betam
1 Betam has been calculating application per vacancy using series released by Kariyer.net for a while. Seasonal and calendar adjustment
procedure is applied to application per vacancy series. A decrease in applications per vacancy may be caused by an increase in vacancies or by a decrease in the number of applications. An increase in vacancies signals economic growth while decreasing number of applications indicates a decrease in number of people looking for a job.
Manufacturing employment continues to increase
Employment in service and manufacturing increased by 53 thousand and 82 thousand respectively (Table 2, Figure
4 and 5).
2Cumulative increase in manufacturing employment has reached 300 thousand since November 2012.
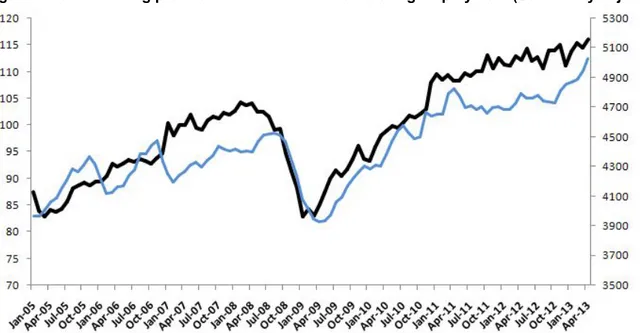
We observe a relatively strong increase in seasonally adjusted manufacturing production index from August 2012
to November 2012: it increased from 110.7 to 115. However, the index increased from 115 in November 2012 to
116 in April 2013. Developments in manufacturing production index do not explain a 6 percent increase in
employment. Regional subsidies aimed at reducing labor costs may have had substantial effects on employment
in manufacturing.
Figure 4 Manufacturing production index and manufacturing employment (Seasonally adjusted)
Source: TurkStat, Betam
2 Employment in each sector is seasonally adjusted separately. Hence the sum of these series may differ from the seasonally adjusted series of
www.betam.bahcesehir.edu.tr
4
Figure 5 Employment by sectors (in thousands)
3Source: TurkStat, Betam
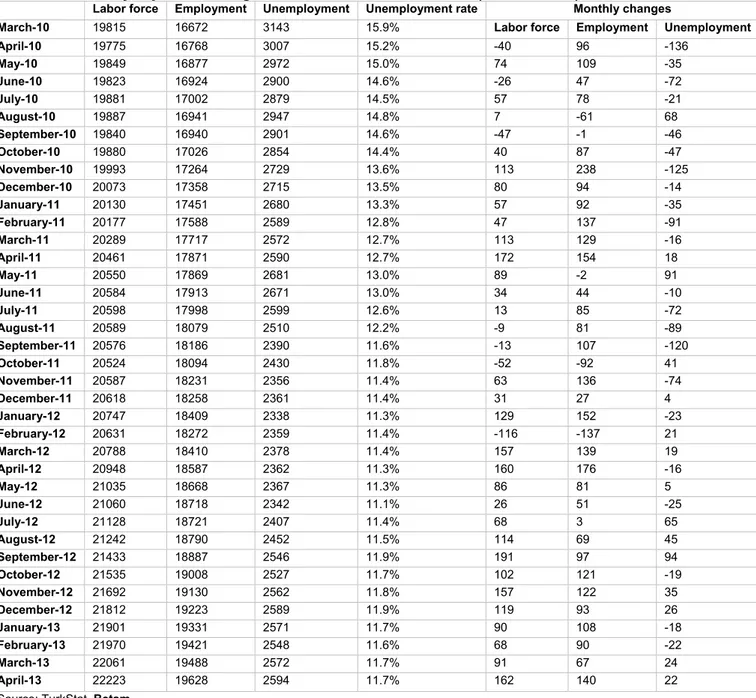
Table 1 Seasonally adjusted non-agricultural labor force indicators (in thousands)
Labor force Employment Unemployment Unemployment rate Monthly changes
March-10 19815 16672 3143 15.9% Labor force Employment Unemployment
April-10 19775 16768 3007 15.2% -40 96 -136 May-10 19849 16877 2972 15.0% 74 109 -35 June-10 19823 16924 2900 14.6% -26 47 -72 July-10 19881 17002 2879 14.5% 57 78 -21 August-10 19887 16941 2947 14.8% 7 -61 68 September-10 19840 16940 2901 14.6% -47 -1 -46 October-10 19880 17026 2854 14.4% 40 87 -47 November-10 19993 17264 2729 13.6% 113 238 -125 December-10 20073 17358 2715 13.5% 80 94 -14 January-11 20130 17451 2680 13.3% 57 92 -35 February-11 20177 17588 2589 12.8% 47 137 -91 March-11 20289 17717 2572 12.7% 113 129 -16 April-11 20461 17871 2590 12.7% 172 154 18 May-11 20550 17869 2681 13.0% 89 -2 91 June-11 20584 17913 2671 13.0% 34 44 -10 July-11 20598 17998 2599 12.6% 13 85 -72 August-11 20589 18079 2510 12.2% -9 81 -89 September-11 20576 18186 2390 11.6% -13 107 -120 October-11 20524 18094 2430 11.8% -52 -92 41 November-11 20587 18231 2356 11.4% 63 136 -74 December-11 20618 18258 2361 11.4% 31 27 4 January-12 20747 18409 2338 11.3% 129 152 -23 February-12 20631 18272 2359 11.4% -116 -137 21 March-12 20788 18410 2378 11.4% 157 139 19 April-12 20948 18587 2362 11.3% 160 176 -16 May-12 21035 18668 2367 11.3% 86 81 5 June-12 21060 18718 2342 11.1% 26 51 -25 July-12 21128 18721 2407 11.4% 68 3 65 August-12 21242 18790 2452 11.5% 114 69 45 September-12 21433 18887 2546 11.9% 191 97 94 October-12 21535 19008 2527 11.7% 102 121 -19 November-12 21692 19130 2562 11.8% 157 122 35 December-12 21812 19223 2589 11.9% 119 93 26 January-13 21901 19331 2571 11.7% 90 108 -18 February-13 21970 19421 2548 11.6% 68 90 -22 March-13 22061 19488 2572 11.7% 91 67 24 April-13 22223 19628 2594 11.7% 162 140 22
Source: TurkStat, Betam
6
Table 2 Seasonally adjusted employment by sector (in thousands)
Agriculture Manufacturing Construction Service Monthly changes
March-10 5620 4301 1434 10937 Agriculture Manufacturing Construction Service
April-10 5676 4381 1443 10944 56 80 9 7 May-10 5581 4470 1412 10995 -95 89 -31 51 June-10 5714 4536 1409 10978 134 66 -3 -16 July-10 5683 4575 1450 10977 -31 39 41 -1 August-10 5661 4525 1405 11011 -22 -50 -45 34 September-10 5656 4489 1408 11042 -5 -36 3 32 October-10 5792 4498 1441 11087 135 9 33 45 November-10 5846 4667 1512 11085 54 169 71 -2 December-10 6030 4642 1571 11145 184 -25 58 61 January-11 6037 4656 1585 11209 6 14 14 64 February-11 6184 4652 1631 11305 147 -4 46 95 March-11 6203 4790 1635 11292 19 138 4 -13 April-11 6088 4828 1640 11403 -115 38 4 112 May-11 6027 4777 1647 11445 -60 -51 7 42 June-11 6087 4697 1662 11554 60 -80 15 109 July-11 6110 4710 1669 11619 23 13 8 65 August-11 6188 4682 1739 11658 78 -28 69 40 September-11 6129 4707 1749 11730 -59 25 11 71 October-11 6168 4657 1679 11758 39 -50 -71 28 November-11 6147 4700 1658 11873 -21 43 -21 114 December-11 6048 4701 1647 11910 -99 1 -11 37 January-12 6056 4685 1732 11992 8 -16 86 82 February-12 6039 4684 1592 11996 -17 -1 -140 4 March-12 6034 4721 1590 12100 -6 37 -2 104 April-12 6072 4792 1660 12135 39 71 70 35 May-12 6118 4760 1702 12206 46 -32 42 71 June-12 6046 4761 1714 12244 -72 1 12 38 July-12 6047 4778 1672 12271 1 17 -42 27 August-12 6050 4745 1723 12322 3 -33 51 51 September-12 6153 4735 1757 12396 102 -10 34 74 October-12 6191 4732 1784 12492 39 -3 27 97 November-12 6179 4814 1783 12533 -13 82 -1 41 December-12 6134 4856 1794 12573 -44 42 11 40 January-13 6115 4870 1859 12602 -20 14 65 28 February-13 6143 4886 1865 12670 28 16 6 68 March-13 6129 4948 1820 12720 -13 62 -45 50 April-13 6121 5030 1825 12773 -9 82 5 53