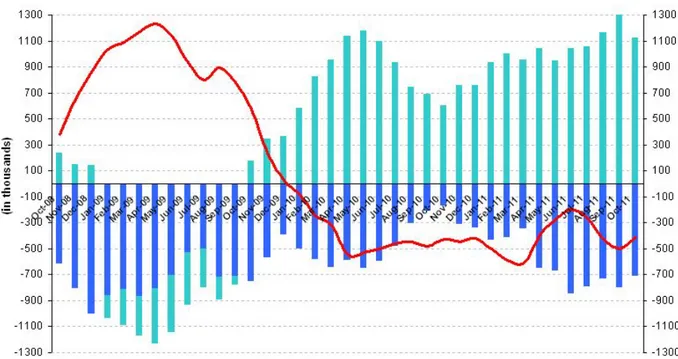
Labor market outlook : January 2012 : sizeable employment losses in construction and manufacturing
Tam metin
Şekil

Benzer Belgeler
Eğitim Durumu Değişkeni ile Örgütsel Değerlerin Çalışanların İş Birliğini Geliştirmesi Faktörünün Analizi için Kruskal-Wallis Testi.. Tablo-51 Eğitim Durumu
d) İşçiler için düzenlenen sağlık maddeleri sebebiyle, gün içinde 7,5 saat veya az miktarda çalışma durumunda olan işlerde durum farklıdır. Çalışan kişi miktarı, her
İletişim farklı yönleriyle tanımlanabilir. Bu iletişimin hangi alan içerisinde incelendiğine bağlı olarak belirlenir. Bir medya uzmanı olan John Fiske,
Vizyoner liderliğin alt boyutlarından iletişim, güvenilirlik, risk, saygı ve lider üye etkileşimi ile rekabet performansı arasındaki ilişkiye öneri olarak;
1-5 yıl arasında mesleki tecrübeye sahip hakemlerin; 6-10 yıl ve 16 yıl ve üzeri hakemlik tecrübesine sahip hakemlerden anlamlı oranda hakem öz yeterliliği,
Bu çalışma vajinismus hastalarında depresyon, özgül fobi, sosyal anksiyete bozukluğu ve panik bozukluğu ek tanı oran- larının oldukça yüksek olduğunu, fakat
Tablo 44'de görüldüğü üzere evde yaşayan yaşlıların beck depresyon ölçeği puanları ile sosyal destek algısı ölçeğinin aile boyutu ve arkadaş boyutu
İlişkin Kalite Algısının Cinsiyete Göre Karşılaştırılması.. HH kalite algısı ortalaması kadın katılımcılarda 3,73 iken erkek katılımcılarda 3,55 olarak
