Objective: Various diet plans with varying ratios of carbohyd-rates, proteins, and fat ensure weight loss in obesity. The pri-mary aim of our study was to evaluate the effects of weight loss on metabolic parameters, and the secondary aim was to com-pare the successes of various weight loss regimens in maintai-ning weight loss. Material and Methods: A team of doctors comprising a dietary consultant and a psychologist developed a program that was followed throughout our study. Twenty-two patients were included in our study. Based on their preference, they were classified into two groups: low carbohydrate diet (At-kins) group and protein-rich mixed diet group. Results: The mean age of the patients was 52.4±3 years, and the mean body mass index (BMI) was 36.1±1.2 kg/m2. Five patients followed the Atkins diet, whereas 17 followed the protein-rich mixed diet. Compared with the baseline values, in the 3rd, 6th, and 12th months, body weight (BW), BMI, and waist circumference dec-reased significantly (p<0.001) in all the patients. Basal meta-bolic rate decreased in the third and sixth months but increased in the 12th. Fasting blood glucose, fasting insulin, HbA1c, 120-minute blood glucose level in oral glucose tolerance test, total cholesterol, low-density lipoprotein, free fatty acids, and uric acid did not change significantly (p>0.05). In the Atkins group, BMI decreased significantly in the 6th month (p=0.03) but in-creased in the 12th month (p=0.29). In the protein-rich mixed diet group, BMI (basal 35.1±1.5 kg/m2) decreased significantly (32.8±1.5, p<0.001) in the 6th month, and continued to dec-rease in the twelfth (31.5±1.2, p=0.007). Conclusion: In obe-sity, approximately 10% weight loss can change metabolic parameters moderately. The Atkins and protein-rich mixed diets caused similar weight loss ratios in the first six months, but a protein-rich mixed diet was more successful in terms of long-term sustainability and maintenance of weight loss.
Keywords: Atkins diet; diet plans; weight loss
Amaç: Değişen karbonhidrat, protein ve yağ oranlarına sahip diyet rejimleri obezitede kilo kaybını sağlar. Çalışmamızın bi-rinci amacı, kilo kaybının metabolik parametreler üzerindeki et-kilerini değerlendirmek, ikinci amacı ise çeşitli kilo kaybı rejimlerinin kilo kaybını sürdürmedeki başarılarını karşılaştır-maktır. Gereç ve Yöntemler: Çalışma boyunca doktor, diyet danışmanı ve psikoloğu içeren bir ekip tarafından program takip edildi. Yirmi iki hasta çalışmaya dâhil edildi. Tercihlerine göre hastalar, düşük karbonhidrat diyeti (Atkins) grubu ve pro-teinden zengin karma diyet grubu olmak üzere ikiye ayrıldı. Bulgular: Hastaların ortalama yaşı 52,4±3 yıl, ortalama beden kitle indeksi (BKİ) 36,1±1,2 idi. Hastaların 5’i Atkins diyetini, 17’si proteinden zengin karma diyeti takip etti. Başlangıç de-ğerleri ile karşılaştırıldığında 3, 6 ve 12. aylarda, tüm hastala-rın vücut ağırlığı (VA), BKİ ve bel çevresi önemli ölçüde azaldı (p<0,001). Bazal metabolizma hızı 3 ve 6. aylarda azaldı, ancak12. ayda arttı. Açlık kan şekeri, açlık insülini, HbA1c, oral glukoz tolerans testinde 120. dk'da glukoz, total kolesterol, düşük yoğunluklu lipoprotein, serbest yağ asitleri ve ürik asit düzeylerinde anlamlı bir değişiklik olmadı (p>0,05). Atkins gru-bunda BKİ, 6. ayda anlamlı olarak azaldı (p=0,03), ancak 12. ayda arttı (p=0,29). Proteinden zengin karma diyet grubunda, 6. ayda BKİ (bazal 35,1±1,5 kg/m2) anlamlı olarak azaldı (32,8±1,5; p<0,001) ve 12. ayda azalmaya devam etti (31,5±1,2; p=0,007). Sonuç: Obezitede yaklaşık %10 kilo kaybı metabolik parametrelerde orta düzeyde değişime neden olabilir. Atkins ve proteinden zengin karma diyetler, ilk 6 ayda benzer oranda kilo kaybına yol açar, ancak proteinden zengin karma diyet, kilo kaybının sürdürülmesi ve uzun dönem devam edilmesinde daha başarılı olmuştur.
Anahtar kelimeler: Atkins diyeti; diyet rejimleri; kilo verme
Address for Correspondence: Nazlı GÜLSOY KIRNAP, Başkent University Faculty of Medicine, Department of Endocrinology and Metabolism, Ankara, TURKEY
Phone: +90 0312 203 68 68 E-mail: [email protected]
Peer review under responsibility of Turkish Journal of Endocrinology and Metabolism.
Received: 05 Nov 2019 Received in revised form: 03 Jun 2020 Accepted: 09Jun 2020 Available online: 22 Jun 2020 1308-9846 / ® Copyright 2020 by Society of Endocrinology and Metabolism of Turkey.
Publication and hosting by Turkiye Klinikleri.
The Effects of Low-Carbohydrate Diet and
Protein-rich Mixed Diet on Insulin Sensitivity,
Basal Metabolic Rate and Metabolic Parameters in
Obese Patients
Obez Hastalarda Düşük Karbonhidrat Diyeti ve
Proteinden Zengin Karma Diyetin İnsülin Sensitivitesi,
Bazal Metabolik Hız ve Metabolik Parametreler Üzerine Etkisi
Suzan AKPULAT*,**, Nazlı GÜLSOY KIRNAP***, Andreas PFEIFFER* *Charite University Faculty of Medicine, Department of Endocrinology and Metabolism, Berlin, GERMANY
**Başkent University Faculty of Medicine, Department of Cardiology, Ankara, TURKEY ***Başkent University Faculty of Medicine, Department of Endocrinology and Metabolism, Ankara, TURKEY
Introduction
Obesity is a chronic disease considered to be a global epidemic with increasing incidence worldwide (1). It is associated with a signif-icant increase in morbidity (including dia-betes mellitus, hypertension, dyslipidemia, heart disease, stroke, sleep apnea, and can-cer) and mortality (2). In weight loss, the aim is to prevent or revert the complications of obesity and increase the quality of life (3). The first step in weight loss management is the intervention of an extensive lifestyle that includes changes in diet, exercise, and be-havior (4). Obesity has a multifactorial char-acteristic that originates from genetic, epigenetic, physiological, behavioral, socio-cultural, and environmental factors, and leads to long-term imbalance between en-ergy intake and expenditure. However, in most cases, obesity is caused by behaviors such as a sedentary lifestyle and increased calorie intake (5). To ensure weight loss in obesity treatment, all individuals need to re-ceive consultation on diet, physical activity, behavioral changes, and weight loss goals (6). Data on the success of diet plans, which include varying ratios of dietary fat, protein, and carbohydrate, are controversial (7-10). The primary aim of this study was to evalu-ate the effects of weight loss on metabolic parameters, and the secondary aim was to compare the successes of various weight loss regimens in maintaining weight loss. Material and Methods
Patients who volunteered to participate in the weight loss program were randomly se-lected and included. A total of twenty-two volunteers (nineteen females and three males) were included in the study. Before the weight loss program began, the patients were asked to record their diet for three days and were provided consultation on their habits. In the weight loss program, two different dietary strategies were imple-mented: a protein-rich mixed diet and a low-carbohydrate Atkins diet. The patients made the choice of diet for themselves. Calorie intake was set between 1,409 kcal and 2,090 kcal, depending on the patient. The protein-rich mixed diet comprised of 33% protein, 33% fat, and 34% carbohy-drate. Atkins diet is usually followed in three stages (11): Stage 1 diet includes 35%
pro-tein, 60% fat and 5% carbohydrate for one week; Stage 2 diet includes 35% protein, 35% fat and 30% carbohydrate for eight weeks; and Stage 3 diet includes 30% pro-tein, 30% fat and 40% carbohydrate for a duration that is of the patient’s preference. The patients in the Atkins diet group did not proceed to the third stage after the second but continued with a carbohydrate percent-age of 30%.
During the first six months, twenty meetings were conducted for the patients, with each meeting lasting for 2.5 h. During the first 1.5 h of the first nine meetings, group train-ing, which included practical cooking meth-ods, were provided to the patients by the dietary consultants. In the final hour of every meeting, a mild sports activity, which included either gymnastics or water sports, was performed. A doctor was presenting every meeting, and a psychologist was pre-senting at least ten meetings to provide training. In the last six months, one meeting was conducted every month in the form of 1.5 h of group training, in which dietary con-sultation was provided (total of six meet-ings).
Physical examination, basal metabolic rate (BMR) measurement (MVmax29, Sensor Medics, USA), bioimpedance analysis (AKER SRL, 50136 Flana-Italy), and blood gas analysis (ABL 505, Radiometer Kopenhag, DK-2700 Bronshoj/Denmark) were per-formed in the beginning and in the third, sixth and twelfth months of the study. In ad-dition, real-time serum total cholesterol, high-density lipoprotein (HDL), low-density lipoprotein (LDL), triglyceride, free fatty acids, fasting blood sugar, HbA1c, creati-nine, urea, uric acid, complete blood count and C-reactive protein levels were meas-ured. A 75 g oral glucose tolerance test (OGTT), test was performed on each patient in the beginning and in the sixth month of the study. A euglycemic clamp test was per-formed on thirteen patients. Biochemical analyses were performed in the central lab-oratories of Benjamin Franklin University Hospital in Berlin, Germany.
Euglycemic Clamp Test
It was performed on patients after ten hours of fasting while the patients were lying in a supine position. Single-arm infusions of 40
Nordisk) and 10% dextrose were given to patients. When blood glucose levels were stable for at least two hours, blood samples were collected from the other arm. Capillary blood samples were collected at 5-minute intervals and analyzed using the glucose ox-idase method. Insulin resistance was calcu-lated according to the glucose infusion rate. The glucose level was calculated when glu-cose levels were stable for at least 2 h (80±10% mg/dL was considered stable). Two cannulas were inserted: one in an an-tecubital vein for the infusion of glucose and insulin, and the other in the opposite upper extremity radial artery or antecubital vein, which was warmed with a heating pillow to arterialize venous blood. When the glucose levels were stable, the blood glucose level was divided by the patient’s weight to calculate the M-value. Homeostatic model assessment for insulin resistance (HOMA-IR) was calculated by using the for-mula: fasting insulin (mIU/L)×fasting glu-cose (mmol/L)/22.5 (12).
Statistical Analysis
Statistical analysis was performed by using SPSS Version 11.0 statistic software package (Chicago, USA). Normality distribution analy-sis of the data was performed by using the Kolmogorov-Smirnov test and the Shapiro-Wilk test. Normally distributed parametric data were presented as mean±SD, and the
lyzed by using the Student t-test. Repeated measurements of the non-normally distrib-uted data in the same individual were ana-lyzed using the Wilcoxon test. Pearson’s correlation coefficient was used for correla-tion analysis, and a p-value of<0.05 was considered significant.
Results
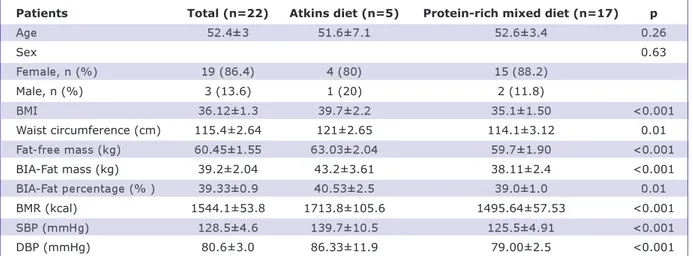
The mean age of patients was 52.4±3 years and the mean body mass index (BMI) was 36.1±1.2 kg/m2. Five patients chose to fol-low the Atkins diet, whereas seventeen pa-tients chose to follow the protein-rich mixed diet. Demographic data and the laboratory values measured in the patients at the be-ginning of the study are shown in Table 1. Of the twenty-two patients, four left the study during the first three months. Eight-een patients remained in the study for six months, and later, seven left, and eleven pa-tients remained in the study for twelve months.
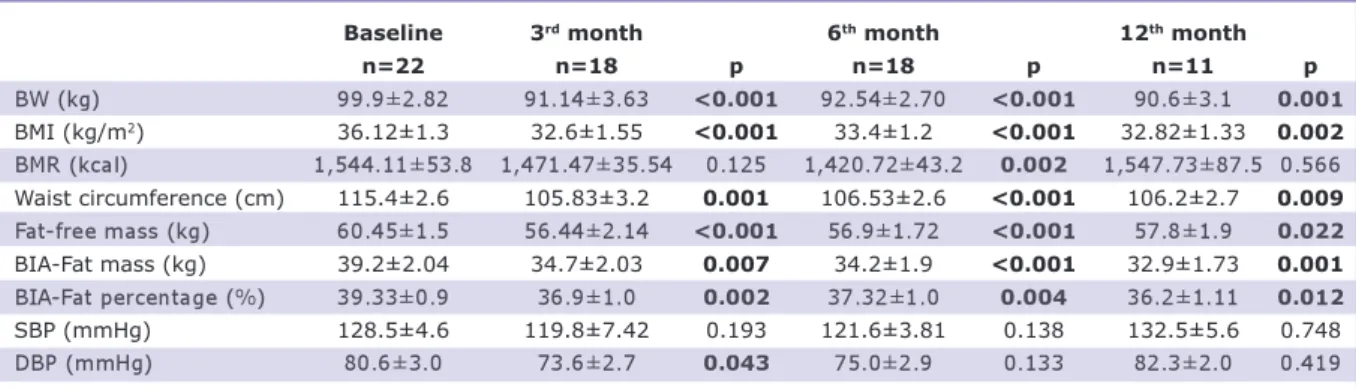
During the follow-up sessions, when all the patients were evaluated, it was found that in the third, sixth and twelfth months, the patients’ body weight (BW), BMI and waist circumference values decreased significantly compared with their baseline values (p<0.001) (Table 2, Figure 1). BMR de-creased in the third and sixth months but increased in the twelfth month (1,544-1,524-1,547 kcal). From the bioimpedance
BMI: Body mass index; BIA: Bioimpedance analysis; BMR: Basal metabolic rate; SBP: Systolic blood pressure; DBP: Diastolic blood pressure.
Patients Total (n=22) Atkins diet (n=5) Protein-rich mixed diet (n=17) p
Age 52.4±3 51.6±7.1 52.6±3.4 0.26 Sex 0.63 Female, n (%) 19 (86.4) 4 (80) 15 (88.2) Male, n (%) 3 (13.6) 1 (20) 2 (11.8) BMI 36.12±1.3 39.7±2.2 35.1±1.50 <0.001 Waist circumference (cm) 115.4±2.64 121±2.65 114.1±3.12 0.01 Fat-free mass (kg) 60.45±1.55 63.03±2.04 59.7±1.90 <0.001 BIA-Fat mass (kg) 39.2±2.04 43.2±3.61 38.11±2.4 <0.001 BIA-Fat percentage (% ) 39.33±0.9 40.53±2.5 39.0±1.0 0.01 BMR (kcal) 1544.1±53.8 1713.8±105.6 1495.64±57.53 <0.001 SBP (mmHg) 128.5±4.6 139.7±10.5 125.5±4.91 <0.001 DBP (mmHg) 80.6±3.0 86.33±11.9 79.00±2.5 <0.001
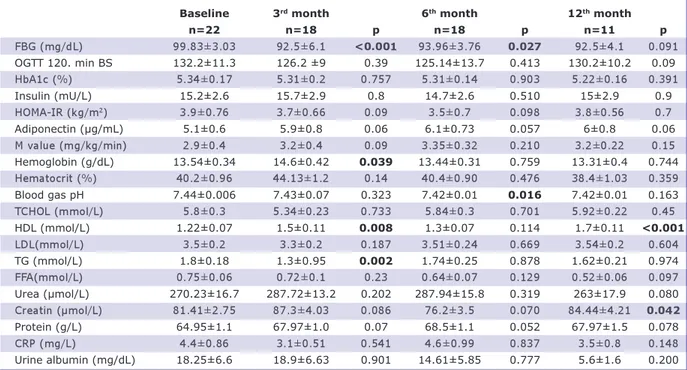
analysis, the initial fat mass was 39.2 kg and decreased to 34.7 kg in three months (p=0.007). It was 34.2 kg in the sixth month and remained at 34.9 kg in the twelfth month (p=0.001 compared with the baseline value). Fat-free mass, which repre-sents the muscle mass, decreased from 60.4 kg to 56.4 kg in three months (p<0.001). It was 56.9 kg in the sixth month (p<0.001) and 57.8 kg in the twelfth month (p=0.22 compared with the baseline value). An in-significant decrease was detected in the sys-tolic and diassys-tolic blood pressure in the sixth month compared with the initial values, and an insignificant increase was detected in the twelfth month (Table 2). Fasting blood glu-cose decreased from 99.83 mg/dL to 93.96 mg/dL in six months (p=0.027). At the end of the twelfth month, fasting blood glucose, fasting insulin, HbA1c, and 120-minute blood glucose level in OGTT did not change significantly compared with the baseline val-ues. Total cholesterol, LDL, TG, free fatty acids, and uric acid also did not change sig-nificantly compared with the baseline val-ues. HDL cholesterol increased from an initial level of 1.22 mmol/L to 1.5 mmol/L in twelve months (p=0.008). C-reactive pro-tein and adiponectin levels did not change significantly at the end of the study com-pared with the beginning of the study (Table 3).
In the Atkins diet group, BW, BMI, and BMR decreased significantly in the sixth month compared with the baseline value (baseline/ follow-up values: 104.83/94.6 kg, p=0.03; 39.7/35.8 kg/m2, p=0.03; 1,713/1,587.5 kcal, p=0.04, respectively). In the twelfth
month, BW increased to 99.4 kg (p=0.3 compared with the baseline value),and BMI increased to 38.9 kg/m2 (p=0.29 compared with the baseline value) (Figure 1, Table 4). BMR increased to 1,690.5 kcal (p=0.33 compared with the baseline value). No sig-nificant changes were detected in the blood pH value throughout the diet (Table 4). In the protein-rich mixed diet group, BW, BMI, and waist circumference values de-creased significantly in the sixth month compared with the baseline values (base-line/follow-up values= 98.5/92 kg, p<0.001; 35.1/32.8 kg/m2, p<0.001; 114.1/105.9 cm, p<0.001,respectively). The decrease in BW, BMI and waist circum-ference values continued in the twelfth month (88.7 kg; 31.5 kg/m2; 105.3 cm, p<0.005, p=0.007, p=0.036, respectively). The basal metabolic rate decreased from the baseline value of 1,695 kcal to 1,373 kcal in the sixth month (p=0.055) and increased back to 1516 kcal in the twelfth month (p=0.3 compared with the baseline value) (Table 5, Figure 1).
BW: Body weight; BMI: Body mass index; BMR: Basal metabolic rate; BIA: Bioimpedance analysis; SBP: Systolic blood pressure; DBP: Diastolic blood pressure.
Baseline 3rd month 6th month 12th month
n=22 n=18 p n=18 p n=11 p BW (kg) 99.9±2.82 91.14±3.63 <0.001 92.54±2.70 <0.001 90.6±3.1 0.001 BMI (kg/m2) 36.12±1.3 32.6±1.55 <0.001 33.4±1.2 <0.001 32.82±1.33 0.002 BMR (kcal) 1,544.11±53.8 1,471.47±35.54 0.125 1,420.72±43.2 0.002 1,547.73±87.5 0.566 Waist circumference (cm) 115.4±2.6 105.83±3.2 0.001 106.53±2.6 <0.001 106.2±2.7 0.009 Fat-free mass (kg) 60.45±1.5 56.44±2.14 <0.001 56.9±1.72 <0.001 57.8±1.9 0.022 BIA-Fat mass (kg) 39.2±2.04 34.7±2.03 0.007 34.2±1.9 <0.001 32.9±1.73 0.001 BIA-Fat percentage (%) 39.33±0.9 36.9±1.0 0.002 37.32±1.0 0.004 36.2±1.11 0.012 SBP (mmHg) 128.5±4.6 119.8±7.42 0.193 121.6±3.81 0.138 132.5±5.6 0.748 DBP (mmHg) 80.6±3.0 73.6±2.7 0.043 75.0±2.9 0.133 82.3±2.0 0.419
Table 2. Demographic and metabolic follow-up parameters of all patients.
Figure 1: Weight change in Atkins and protein-rich
Discussion
The incidence of obesity is increasing glob-ally, and the associated comorbidities
con-stitute major issues in each geographical area. In 2015, 107.7 million (98.7-118.4 million) children and 603.7 million (588.2-BMI: Body mass index; BIA: Bioimpedance analysis; BMR: Basal metabolic rate; SBP: Systolic blood pressure; DBP: Diastolic blood pressure; FBG: Fasting blood glucose; HOMA IR: Homeostasis model assessmentinsulin resistance; OGTT: Oral glucose tole-rance test; BS: Blood sugar; HDL: High-density lipoprotein; LDL: Low-density lipoprotein; TG: Triglyceride; TCHOL: Total choleste-rol; FFA: Free fatty acid.
Baseline 3rd month 6th month 12th month
n=22 n=18 p n=18 p n=11 p FBG (mg/dL) 99.83±3.03 92.5±6.1 <0.001 93.96±3.76 0.027 92.5±4.1 0.091 OGTT 120. min BS 132.2±11.3 126.2 ±9 0.39 125.14±13.7 0.413 130.2±10.2 0.09 HbA1c (%) 5.34±0.17 5.31±0.2 0.757 5.31±0.14 0.903 5.22±0.16 0.391 Insulin (mU/L) 15.2±2.6 15.7±2.9 0.8 14.7±2.6 0.510 15±2.9 0.9 HOMA-IR (kg/m2) 3.9±0.76 3.7±0.66 0.09 3.5±0.7 0.098 3.8±0.56 0.7 Adiponectin (μg/mL) 5.1±0.6 5.9±0.8 0.06 6.1±0.73 0.057 6±0.8 0.06 M value (mg/kg/min) 2.9±0.4 3.2±0.4 0.09 3.35±0.32 0.210 3.2±0.22 0.15 Hemoglobin (g/dL) 13.54±0.34 14.6±0.42 0.039 13.44±0.31 0.759 13.31±0.4 0.744 Hematocrit (%) 40.2±0.96 44.13±1.2 0.14 40.4±0.90 0.476 38.4±1.03 0.359 Blood gas pH 7.44±0.006 7.43±0.07 0.323 7.42±0.01 0.016 7.42±0.01 0.163 TCHOL (mmol/L) 5.8±0.3 5.34±0.23 0.733 5.84±0.3 0.701 5.92±0.22 0.45 HDL (mmol/L) 1.22±0.07 1.5±0.11 0.008 1.3±0.07 0.114 1.7±0.11 <0.001 LDL(mmol/L) 3.5±0.2 3.3±0.2 0.187 3.51±0.24 0.669 3.54±0.2 0.604 TG (mmol/L) 1.8±0.18 1.3±0.95 0.002 1.74±0.25 0.878 1.62±0.21 0.974 FFA(mmol/L) 0.75±0.06 0.72±0.1 0.23 0.64±0.07 0.129 0.52±0.06 0.097 Urea (µmol/L) 270.23±16.7 287.72±13.2 0.202 287.94±15.8 0.319 263±17.9 0.080 Creatin (µmol/L) 81.41±2.75 87.3±4.03 0.086 76.2±3.5 0.070 84.44±4.21 0.042 Protein (g/L) 64.95±1.1 67.97±1.0 0.07 68.5±1.1 0.052 67.97±1.5 0.078 CRP (mg/L) 4.4±0.86 3.1±0.51 0.541 4.6±0.99 0.837 3.5±0.8 0.148 Urine albumin (mg/dL) 18.25±6.6 18.9±6.63 0.901 14.61±5.85 0.777 5.6±1.6 0.200
BW: Body weight; BMI: Body mass index; BMR: Basal metabolic rate.
Baseline 3rd month 6th month 12th month
n=5 n=4 p n=4 p n=2 p BW (kg) 104.83±3.8 96.6±7.3 0.04 94.6±3.6 0.03 99.4±1.6 0.3 BMI (kg/m2) 39.7±2.2 37.7±2.3 0.044 35.8±1.8 0.03 38.9±0.05 0.29 BMR (kcal) 1713±47.52 1614±55.59 0.67 1587.5±55.94 0.04 1690.5±84.2 0.33 Waist circumference (cm) 115.8±3.8 111.5±2.5 0.042 109.5±3.82 0.092 109.5±6.5 0.65 Fat-free mass (kg) 63.03±2.04 56.44±2.14 0.09 58.0±3.63 <0.001 60.2±0.7 0.09 Blood gas pH 7.42±0.02 7.42±0.005 1.0 7.41±0.02 0.9 7.42±0.005 1.0
Table 4. Metabolic follow-up values of the Atkins diet group.
BW: Body weight; BMI: Body mass index; BMR: Basal metabolic rate.
Baseline 3rd month 6th month 12th month
n=17 n=13 p n=14 p n=9 p BW (kg) 98.5±3.43 90.2±4.14 <0.001 92±3.4 <0.001 88.7±3.4 <0.005 BMI (kg/m2) 35.1±1.5 31.7±1.7 <0.001 32.8±1.5 <0.001 31.5±1.2 0.007 BMR (kcal) 1,495.64±57.52 1,414.0±45.59 0.055 1,373.93±45.94 0.005 1,516±104.2 0.3 Waist circumference (cm) 114.1±3.1 104.7±3.8 0.004 105.9±3.08 <0.001 105.3±3.1 0.036 Fat-free mass (kg) 59.7±1.9 55.9±2.5 0.001 56.6±2.02 0.002 57.23±2.3 0.102 Blood gas pH 7.43±0.008 7.44±0.008 0.361 7.42±0.008 0.10 7.43±0.008 0.150
619.8 million) adults were obese worldwide. The overall prevalence of obesity in children and adults was 5.0% and 12.0%, respec-tively (1,13). Despite the great variance among the countries, data indicate that the incidence of obesity has increased in the last thirty years in most of the populations (6). Large epidemiological studies have shown the association of obesity with diabetes mel-litus, hypertension, dyslipidemia, heart dis-ease, stroke, sleep apnea, cancer development, and increased mortality ( 14-16). Weight loss reduces obesity-associated morbidities and mortality (17).
When the patients in our study were ana-lyzed, although there was a weight change of approximately 9-10% (Table 2), no changes were detected in inflammatory markers such as adiponectin and CRP. Fat may ectopically accumulate subcutaneously and in internal organs (liver, heart, pan-creas, skeletal muscle). Ectopic fat accu-mulation leads to low-grade inflammation (18). In our study, ectopic fat accumulation could not be assessed. The absence of any changes in the inflammatory data in our study may be due to the fact that in pa-tients, weight loss occurred largely in the subcutaneous tissue. However, there were statistically significant changes in waist cir-cumference.This finding is probably due to the low number of cases included. More-over, in previous studies, it was suggested that the variance in adiponectin, as well as other biological markers in response to weight loss, is not unimportant, and in order to obtain more significant results, ei-ther larger cohorts should be analyzed or more marked differences in weight should be ensured (19-22). The results presented in our study were obtained from a small group of eighteen people. Thus, statistically, more significant results can be expected if a higher number of patients are included in cohort studies.
Dietary change is the most important basis of obesity prevention and treatment. A bal-anced, moderate-fat, low-cholesterol, starchy, low-salt, fiber-rich, and moderate calorie-deficit dietary plan should ideally in-clude three main meals and two snacks (23). Although Atkins diet is popular in so-cial life, it has certain drawbacks. At the be-ginning of the dietary regimen, weight loss
is rapid due to dehydration. This can cause the risk of vitamin, dietary fiber, and min-eral deficiencies. This diet may also lead to increased purine intake and, consequently, increased cholesterol levels due to high-fat and high-salt nutrition. Increasing water in-take is of vital importance in this diet. By this, kidneys can eliminate the generated ketone bodies and uric acid. In addition to the increased risk of kidney and liver dis-eases, this diet is associated with a high risk of atherosclerosis, cardiovascular dis-eases, and gout development. In the Atkins diet group, throughout our study, we did not observe any changes in the laboratory values that confirmed these concerns. This is probably because the patients attended group therapies regularly and were man-dated to follow the necessary preventative measures.
One of the significant outcomes of our study was that although a significant change in weight occurred in the Atkins group in the sixth month compared with the baseline value, it was found that the patients gained weight in the twelfth month, and could not maintain the significant weight loss com-pared with the baseline value. However, in the protein-rich mixed diet group, it was found that weight loss continued during the last six months, and in the twelfth month, significant weight loss compared with the baseline values was attained. Our study has shown that a protein-rich mixed diet is a more sustainable weight loss program than the Atkins diet. Corroborating our findings, a meta-analysis of five studies has reported that the group that preferred a low-carbo-hydrate diet could not maintain the weight loss that occurred in the first six months into the twelfth month (24). In order to prevent long-term cardiovascular complications of obesity, weight loss programs must be sus-tainable.
Study Limitations
In our study, the dietary preference was left to the patients in order to increase the com-pliance of the participants. Since the initial design of the study was in this way, the groups were not evenly distributed. In addi-tion, the withdrawal of participants from the study during the follow-up affected this ir-regularity further.
Multidisciplinary training programs in obe-sity are successful in ensuring and main-taining weight loss. Despite the successful weight loss, a slight change in metabolic parameters is observed. While weight loss ensures improvement in insulin resistance in the obese with metabolic syndrome, it does not do so in the obese without meta-bolic syndrome. Atkins diet and protein-rich mixed diet lead to similar rates of weight loss in the first six months, but a protein-rich mixed diet is more successful in the long-term maintenance of weight loss.
Data Availability
This study has been approved by Charite University’s Medical Sciences Ethics Com-mittee, and therefore performed in accor-dance with the ethical standards laid down by the 1964 Declaration of Helsinki and its later amendments.
Financially supporting
This research did not receive specific funding and was performed as part of the employ-ment of the authors.
Informed consent
Informed consent of the participants was obtained.
Conflict of Interest
No conflicts of interest between the authors and / or family members of the scientific and medical committee members or members of the potential conflicts of interest, counsel-ing, expertise, working conditions, share holding and similar situations in any firm. Authorship Contributions
Idea/Concept: Suzan Akpulat, Andreas Pfeiffer; Design: Suzan Akpulat, Andreas Pfeiffer; Control/Supervision: Nazlı Gülsoy Kırnap; Data Collection and/or Processing: Suzan Akpulat; Analysis and/or Interpreta-tion: Andreas Pfeiffer; Literature Review: Nazlı Gülsoy Kırnap; Writing the Article: Nazlı Gülsoy Kırnap, Suzan Akpulat; Critical Review: Andreas Pfeiffer; References and Fundings: Nazlı Gülsoy Kırnap; Materials: Suzan Akpulat.
1. Afshin A, Forouzanfar MH, Sur P, Estep K, Lee A, et al. Health effects of overweight and obesity in 195 countries over 25 years. GBD 2015 Obesity Collab-orators. N Engl J Med. 2017;377:13-27. [Crossref] [PubMed] [PMC]
2. Olshansky SJ, Passaro DJ, Hershow RC, Layden J, Carnes BA, Brody J, Hayflick L, Butler RN, Allison DB, Ludwing DS. A potential decline in life expectancy in the United States in the 21st century. N Engl J Med. 2005;17;352:1138-1145. [Crossref] [PubMed]
3. Vallis M. Quality of life and psychological well-being in obesity management: improving the odds of suc-cess by managing distress. Int J Clin Pract. 2016;70:196-205. [Crossref] [PubMed] [PMC]
4. Bray GA, Frühbeck G, Ryan DH, Wilding JPH. Man-agement of obesity. Lancet. 2016;7;387:1947-1956. [Crossref] [PubMed]
5. Tsai AG, Wadden TA. In the clinic: obesity. Ann İn-tern Med. 2013;3;159:1-15; quiz ITC3-16. [Crossref] [PubMed]
6. Prospective Studies Collaboration; Whitlock G, Lew-ington S, Sherliker P, Clarke R, Emberson J, Halsey J, Qizilbash N, Collins R, Peto R. Body-mass index and cause-specific mortality in 900 000 adults: collabo-rative analyses of 57 prospective studies. Lancet. 2009;28;373:1083-1096. [Crossref] [PubMed]
7. Ryan D, Heaner M. Guidelines (2013) for managing overweight and obesity in adults. Preface to the full report. Obesity (Silver Spring). 2014;22 Suppl 2:S1-3. [Crossref] [PubMed]
8. Johnston BC, Kanters S, Bandayrel K, Wu P, Naji F, Siemieniuk RA, Ball GDC, Busse JW, Thorlund K, Guyatt G, Jansen JP, Mills EJ. Comparison of weight loss among named diet programs in overweight and obese adults: a meta-analysis. JAMA. 2014;3;312: 923-933. [Crossref] [PubMed]
9. Hu T, Mills KT, Yao L, Demanelis K, Eloustaz M, Yancy WS Jr, Kelly TN, He J, Bazzano LA. Effects of low-car-bohydrate diets versus low-fat diets on metabolic risk factors: a meta-analysis of randomized controlled clinical trials. Am J Epidemiol. 2012;1;176 Suppl 7:S44-54. [Crossref] [PubMed] [PMC]
10. Sacks FM, Bray GA, Carey VJ, Smith SR, Ryan DH, Anton SD, McManus K, Champagne CM, Bishop LM, Laranjo N, Leboff MS, Rood JC, de Jonge L, Green-way FL, Loria CM, Obarzanek E, Williamson DA. Comparison of weight-loss diets with different com-positions of fat, protein, and carbohydrates. N Engl J Med. 2009;26;360:859-873. [Crossref] [PubMed] [PMC]
11. Gardner CD, Kiazand A, Alhassan S, Kim S, Stafford RS, Balise RR, Kraemer HC, King AC. Comparison of the Atkins, Zone, Ornish, and LEARN diets for change in weight and related risk factors among overweight premenopausal women: the A TO Z weight loss study: a randomized trial. JAMA. 2007;7;297:969-977. [Crossref] [PubMed]
12. Matthews DR, Hosker JP, Rudenski AS, Naylor BA, Treacher DF, Turner RC. Homeostasis model as-sessment: insulin resistance and beta-cell function from fasting plasma glucose and insulin concentra-tions in man. Diabetologia. 1985;28:412-419.
13. NCD Risk Factor Collaboration (NCD-RisC). Trends in adult body-mass index in 200 countries from 1975 to 2014: a pooled analysis of 1698 popula-tion-based measurement studies with 19.2 million participants. Lancet. 2016;387(10026):1377-1396.
[Crossref]
14. McTigue K, Larson JC, Valoski A, Burke G, Kotchen J, Lewis CE, Stefanick ML, Horn LV, Kuller L. Mortal-ity and cardiac and vascular outcomes in extremely obese women. JAMA. 2006;5;296:79-86. [Crossref] [PubMed]
15. Yan LL, Daviglus ML, Liu K, Stamler J, Wang R, Pirzada A, Garside DB, Dyer AR, Horn LV, Liao Y, Fries JF, Greenland P. Midlife body mass index and hospitalization and mortality in older age. JAMA. 2006;11;295:190-198. [Crossref] [PubMed]
16. Adams KF, Schatzkin A, Harris TB, Kipnis V, Mouw T, Ballard-Barbash R, Hollenbeck A, Leitzmann MF. Overweight, obesity, and mortality in a large prospec-tive cohort of persons 50 to 71 years old. N Engl J Med. 2006;24;355:763-778. [Crossref] [PubMed]
17. Rueda-Clausen CF, Ogunleye AA, Sharma AM. Health benefits of long-term weight-loss maintenance. Annu Rev Nutr. 2015;35:475-516.
[Crossref] [PubMed]
18. Schwartz MW, Seeley RJ, Zeltser LM, Drewnowski A, Ravussin E, Redman LM, Leibel RL. Obesity Patho-genesis: an endocrine society scientific statement. Endocr Rev. 2017;1;38:267-296. [Crossref] [PubMed] [PMC]
19. Yang WS, Lee WJ, Funahashi T, Tanaka S, Mat-suzawa Y, Chao CL, Chen CL, Tai TY, Chuang LM.
Weight reduction increases plasma levels of an adi-pose-derived anti-inflammatory protein, adiponectin. J Clin Endocrinol Metab. 2001;86: 3815-3819. [Crossref] [PubMed]
20. Ryan AS, Berman DM, Nicklas BJ, Elahi D. Adiponectin levels do not change with moderate di-etary induced weight loss and exercise in obese postmenopausal women. Int J Obesity. 2003;27:1066-1071. [Crossref] [PubMed]
21. Monzillo LU, Hamdy O, Horton ES, Ledbury S, Mul-looly C, Jarema C, Porter S, Ovalle K, Moussa A, Mantzoros CS. Effect of lifestyle modification on adipokine levels in obese subjects with insulin re-sistance. Obes Res. 2003;11:1048-1054. [Crossref] [PubMed]
22. Baratta R, Amato S, Degano C, Farina MG, Patane G, Vigneri R, Frittitta L. Adiponectin relationship with lipid metabolism is independent of body fat mass: evidence from both cross- sectional and intervention studies. J Clin En-docrinol Metab. 2004;89:2665-2671. [Crossref] [PubMed]
23. Esposito K, Giugliano D. Mediterranean diet and the metabolic syndrome: the end of the begin-ning. Metab Syndr Relat Disord. 2010;8:197-200.
[Crossref] [PubMed]
24. Nordmann AJ, Nordmann A, Briel M, Keller U, Yancy WS, Jr., Brehm BJ, Bucher HC. Effects of low-carbo-hydrate vs low-fat diets on weight loss and cardio-vascular risk factors: a meta-analysis of randomized controlled trials. Arch Intern Med. 2006;13;166: 285-293. [Crossref] [PubMed]