Sayı 19, S. 643-658, Ağustos 2020
© Telif hakkı EJOSAT’a aittir
Araştırma Makalesi
www.ejosat.com ISSN:2148-2683No 19, pp. 643-658, August 2020
Copyright © 2020 EJOSAT
Research Article
Comparison of SSD and Faster R-CNN Algorithms to Detect the
Airports with Data Set Which Obtained From Unmanned Aerial
Vehicles and Satellite Images
Muhammed Taha Zeren
1, Sabahattin Kerem Aytulun
2, Yasin Kırelli
3*1 Turkish Aerospace Industries (TAI - TUSAŞ), Ankara, Türkiye (ORCID: 0000-0001-5615-0751) 2 Beykent University, Industrial Engineering Department, Istanbul, Turkey (ORCID: 0000-0002-4688-0408) 3 Sakarya University, Industrial Engineering Department, Sakarya, Turkey (ORCID: 0000-0002-3605-8621)
(First received 6 May 2020 and in final form 10 July 2020) (DOI: 10.31590/ejosat.742789)
ATIF/REFERENCE: Zeren, M. T., Aytulun, S. K. & Kırelli, Y. (2020). Comparison of SSD and Faster R-CNN Algorithms to Detect the Airports with Data Set Which Obtained From Unmanned Aerial Vehicles and Satellite Images. European Journal of Science and Technology, (19), 643-658.
Abstract
Today, image processing has been used in many different sectors, especially in health, production and military fields, for various purposes directly in human life. The development of deep learning algorithms and starting to use of computer vision has accelerated the studies such as critical target, important location and strategic region determination especially in the military field. In this study, the airport has been determined on the landing runways. Training, test and evaluation data sets were created by using both medium and high-altitude unmanned air vehicles and satellite images. SSD-Single Shot Multibox algorithm and Faster R-CNN algorithm were used by re-training during the determination process. The results of both algorithms were evaluated within the extend of evaluation criteria such as accuracy, sensitivity, specificity, false positive rate, false negative rate, positive pred value, Fscore, error rate, result and training time. The image detection accuracy with SSD algorithm was 76,61%, with Faster R-CNN algorithm the image detection accuracy was 99.52% according to valuation dataset. With this study, which of the two architectures has been revealed to be successful in determining critical areas in unmanned aerial vehicles and satellite images.
Keywords: Machine Learning, Deep Learning, Computer Visioning, Artificial Neural Networks, SSD - Single Shot Multibox Detector, Faster-R-CNN, Unmanned Aerial Vehicles (UAV), Satellite Systems.
İnsansız Hava Araçları ve Uydu Görüntülerinden Elde Edilen Veri
Seti ile Havaalanlarının Tespitinin Yapılmasında SSD ve Faster
R-CNN Algoritmalarının Karşılaştırılması
ÖzGünümüzde görüntü işleme çalışmalarında birçok faklı sektörde, özellikle sağlık, üretim ve askeri alanlarda, doğrudan insan yaşantısında çeşitli amaçlarla kullanılmaya başlanmıştır. Derin öğrenme algoritmalarının gelişmesi ve bilgisayarlı görüde kullanılmaya başlanması özellikle askeri alandaki kritik hedef, önemli konum ve stratejik bölge tespiti gibi çalışmalara hız kazandırmıştır. Bu çalışmada Airport olarak adlandırılan havaalanlarının, uçak iniş pistleri üzerinden tespiti gerçekleştirilmiştir. Hem orta ve yüksek irtifalı insanız hava araçlarından hem de uydu görüntüleri kullanılarak eğitim, test ve değerlendirme veri setleri oluşturulmuştur. Tespit yapılması sürecinde SSD-Single Shot Multibox algoritması ve Faster R-CNN algoritması yeniden eğitilerek kullanılmıştır. Her iki algoritmanın sonuçları doğruluk oranı, duyarlılık, özgüllük, yanlış pozitif oranı, yanlış negatif oranı, doğru tahmin oranı, F puanı, hata
e-ISSN: 2148-2683
644
oranı, sonuç ve eğitim süresi gibi değerlendirme kriterleri kapsamında değerlendirilmiştir. Değerlendirme veri seti üzerinde; SSD mimarisi ile %76,61 doğruluk oranıyla, Faster R-CNN mimarisinde ise %99,52 doğruluk oranı ile görüntü tespit sonucu elde edilmiştir. Söz konusu çalışma ile iki mimariden hangisinin insansız hava araçları ve uydu görüntülerinde kritik bölge tespitinde ne derece başarılı olduğu ortaya çıkarılmıştır.
Anahtar Kelimeler: Makine Öğrenmesi, Derin Öğrenme, Bilgisayarlı Görü, Yapay Sinir Ağları, SSD - Single Shot Multibox Detector, Faster-R-CNN, İnsansız Hava Araçları (IHA), Uydu Sistemleri.
1. Introduction
Today, it has started to be used for various purposes in many different sectors in image processing. The most distinctive examples of this include: facial recognition systems in the workplace, motion detection systems for security cameras, license plate identification systems, banknote recognition systems in bank ATMs, product detection systems in manufacturing processes, and military security systems.
Thanks to the latest developments in unmanned aerial vehicles and satellite systems, it is possible to take live images. Although there are specialists who constantly review these images, it is important for the continuity of correct detection to carry out an automatic system that prevent errors. Improvements in image detection plays a significant role in the subject selection.
Deep learning methods was not able to exceed 40% of the predicted percentages in the object detection studies conducted in the PASCAL VOC data set by 2013 (Girshick, Donahue, Darrell & Malik, 2014) [1]. This percentage has increased over the years with the use of deep neural networks in this area, reaching and exceeding the 80% level (Girshick, 2015) [2]. Being a specific part of machine learning, deep learning tries to reveal the unknown in the input distribution for successful results in this sense.
Recently, achievements have been incredible in the recognition of objects and in determining actions with the deep neural network architecture. Owing to these architectures' ability to extract and represent strong and distinctive features, it has become possible to create a deep feature detection, mapping and network structure setup on a particular object (Kamran, Shahzad & Shafait, 2018) [3]. The three main architectures that stand out in this sense are R-CNN (Regional Convolution Neural Network), Fast R-CNN and Faster R-CNN.
R-CNN has a convolutional neural network architecture working with zone extraction. This is basically determined by the region proposal that the object is likely to be the object. It is ensured that the dimensions are synchronized before the convolutional neural network architecture process. Images with synchronized dimensions are passed through the convolutional neural network. Obtained results’ image border is determined by Support Vector Machine and estimation process is also verified. (Xiaozhu, 2017) [4] (Hsu, Chang and Lin, 2016)[5]. Although it produces successful results, the biggest drawback of R-CNN architecture is that the time allocated to the training and testing stages is quite long. A different version of this method is optimized for Fast R-CNN architecture.
Instead of making a region proposal for the object whose basic difference will be determined according to R-CNN, fast R-CNN architecture sends the image directly to the convolutional neural network. Thus, a high resolution feature map which is compatible with the original image is created. Region maps are created by selective search method on this map. Thus, region detection is determined by the feature map, not the original image.
Another method defined as Faster-CNN, one of the deep learning techniques, constructs a region network proposal instead of creating a region proposal with selective research like Fast-CNN. This method which is also called Region Proposal Network (RPN), performs the same operations as Fast-CNN after the network proposal setup. To sum up, this method works with four different network architectures that need to be trained such as RPN classifier, RPN limiter, final scores and final limits (Hsu, Chang & Lin, 2016) [5].
SSD (Single Shot Multibox Detector), which is one of the deep learning techniques, provides object recognition at once with a different approach. While the region proposal and region classification are done in 2 stages in Faster R-CNN, in SSD technique, they do both in one convolutional neural network at once.
In this study, it is aimed to identify and mark the airports defined as critical regions from satellite images and unmanned aerial images. While performing this determination process, both SSD (Single Shot Multibox) algorithm and Faster R-CNN algorithm were used to compare the performances of artificial neural network architectures and the results were evaluated.
2. Material and Method
2.1. R-CNN, Fast R-CNN, Faster R-CNN, SSD Algorithms
After 2006, Artificial Neural Networks was started to use on object detection and computer visioning. Predictions’ accuracy rate has reached %80 after 2013. By the end of 2016, accuracy rate of predictions on object detection has reach over then %90 percent after using new developed Deep Learning Algorithms such as R-CNN and SDD (Girshick, 2015) [2]. The most popular algorithms on object detection and those algorithms’ systematics has mentioned as follows.
2.1.1. Region Based Convolutional Neural Networks (R-CNN)
Preliminary studies on Region Based Convolutional Neural Networks (R-CNN) are made by Girshick, Donahue, Darrell, Malik, Berkeley in 2014
Region proposals called region of interest used on Region Based Convolutional Neural Networks (R-CNN). R-CNN algorithm’s systematic do not classify a huge number of regions. R-CNN uses selective seach and propose approximately 2000 regions that can be contain objects. Proposed regions which have different dimentions, wrap into specific dimentions before fed into CNN. Every single region processed on convolutional neural network then classfy by Support Vektor Mission (SVM) and lineer regression uses for defining object borders and tightening the borders around the images via coordinates (Girshick, Donahue, Darrell & Malik, 2014) [1]. This process takes huge amount of time for training and classifications.
Şekil 1. R-CNN Methodology (Girshick, Donahue, Darrell & Malik, 2014) [1] 2.1.2. Fast R-CNN
Fast R-CNN has similar approach like R-CNN, however Fast R-CNN combined different tecniques to fast up the object detection process. Instead of making region proposels, entire image puts into the CNN on Fast R-CNN Algorithm. As a result, high resoluted convolutional feature map obtaned. Approximately 2000 region of interest defined on convolutional feature map via selective seach. After that proposed regions wrap on fixed size via rool pooling layer then connected to fully connected layer. Softmax uses for classification and linear regression uses for bounding box for each region of interest. (Girshick, 2015) [2]
Fast R-CNN advantage is using convolutional feature map, however selective seach is still make bottle neck for process. (Girshick, 2015) [2]
e-ISSN: 2148-2683
646
2.1.3. Faster R-CNNFaster R-CNN structure is developed by Shaoqing Ren in 2016. Faster R-CNN doesn’t contain selective seach in the object detection process and this is the main time advantage of this algorithm. Selective search is bottle neck for object detection process. Image puts into the convolutional layers on Faster R-CNN Algorithm to obtain high resoluted convolutional feature map as the same as in Fast R-CNN. Instead of using selective seach, region proposes made by region proposal network. Proposed regions reshaped via rool pooling layer. On the same layer, image classification and bounding box processes completed within the regions of interest. (Ren, He, Girshick, Sun, 2016) [6]
Şekil 3. Faster R-CNN Architecture (Ren, He, Girshick, Sun, 2016) [6] 2.1.4. Single Shot Multibox Detector
Liu, Anguelov, Erhan, Szegedy, Reed, Fu and Berg developed new deep learning methodology “Single Shot Multibox Detector” for real-time object detection. Faster R-CNN uses region proposal Network for classification and bounding box process. Single Shot Multibox Detector detec the object in one shot. Region proposal network eliminated in SSD.
Input image feed into convolutional neural network in Single Shot Multibox Detector as a first step. Feature maps are produced within different scale. Restrictive rectangles are produced by 3x3 convolutional filter on feature maps. Borders and classifications are defined each rectangels as the same time. This rectangels located on each activation maps, thus detection be able to make on differed scaled objects. Correct borders and predict borders are compered during the training process. Best predicted rectanges and prediction rate over then 0,5 rectanges are labeled positive. (Liu, Anguelov, Erhan, Szegedy, Reed, Fu, Berg, 2016) [7]
2.2. Creating Training, Testing, Validation Data Sets
It is important to prepare data sets before starting retraining in SSD- Single Shot Multibox MobileNet_v2 (Github, 2019) [8] and Faster R-CNN Inception_v2 (Github, 2019) [8] architectures to be compared in image processing. Since the main purpose of the study is the detection of airports from satellite and medium and high-altitude unmanned air vehicles over airport runways, the datasets were created from the images taken by satellite and UAV (Unmanned Aerial Vehicle).
In the first stage, 310 images, including one and more than one airport, were taken over Yandex Maps, Google Earth and the internet. The airport images in all of them are labelled using one or more additional interface programs.
While collecting the data, regions with different seasonal characteristics were selected from all over the world. Additionally, images were collected from many different terrain conditions such as forest area, sea and ocean edge, island surface, desert and city center especially to push the model. Especially the airports located near city centers and main roads were preferred to push the model because the highways are similar to the airports.
Again, the images with altitude up to 2 km- 14 km were preferred to push the model. In this way, the scale of the region to be determined was changed.
310 images, including colorful and colorless images, are divided into two as 80% education data set and 20% test set. Accordingly, 248 images were included in the training data set and 62 images were included in the test data set. The images in question were placed especially on images containing more than one airport. In both data sets, the airports are marked on the images and the coordinates have been converted to XML format for training. These clusters in the form of XML files have been converted into TFRecord files for training of the Tensorflow library, and important parameter changes have been made for training.
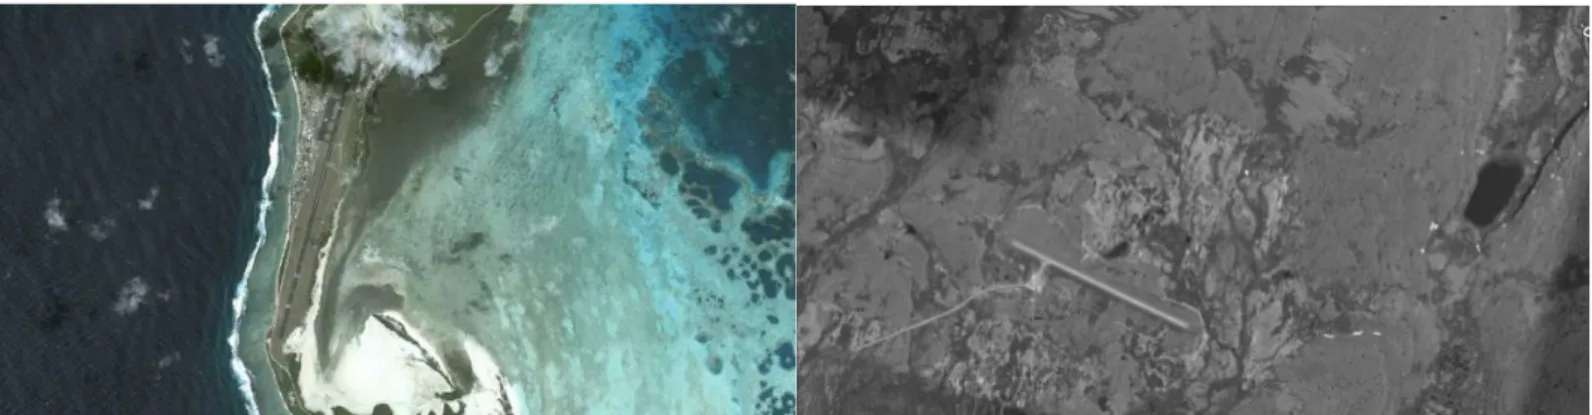
In addition to the training and test data sets, an evaluation data set that is completely independent and different from the training and test data sets has been created for an objective evaluation of the results and performances. The dataset in question was obtained from different terrain conditions, in areas belonging to different geographical climate types and from different altitudes. The evaluation data set includes 50 images containing one and more airport runways and 50 images without airport. Below are a few images of the airport used in the training data.
e-ISSN: 2148-2683
648
Figure 2. Sample Images Containing Airport in the Test SetFigure 3. Sample Images Containing the Airport in the Evaluation Set
Figure 4. Airport-Free Sample Images in the Evaluation Set
2.3. Results and Performance Evaluation Criteria
In order to evaluate the results and performance of retrained SSD- Single Shot Multibox and Faster R-CNN architectures, the criteria in the table below have been calculated according to the evaluation dataset measurements. In addition, both training and output given durations were calculated and compared for both algorithms. While performing these calculations, results were obtained from the same workstation with Intel Core i53230M 2.60 Ghz CPU in both architectures.
In general, the real and predictive values of the classes are compared with the confusion matrix for the performance evaluation of these algorithms. (Polat, Mehr and Cetin, 2017) [9]. Receiver Operating Characteristics (ROC) is one of the methods which is used to measure classification performance (Lasko, Bhagwat, Zou, and Ohno-Machado, 2005) [10].
To compare the performance of the related algorithms in the study, four possible performance results of the results produced with the evaluation data set are given in the table below.
Table 1. Confusion Matrix
Confusion Matrix Reality Positive Negative Prediction Positive TP True Positive FP False Positive Negative FN
False Negative True Negative TN
TP: Defined as the Correct Classification Process of a Positive Sample. TN: Defined as the Correct Classification of a Negative Sample. FP: Defined as the Misclassification Procedure of Negative Sample. FN: Defined as a False Classification Procedure of a Positive Sample.
Accuracy: Calculated by the correction of each sample in the classification of class labels in the evaluation of the performance of algorithms (Polat, Mehr, & Cetin, 2017) [9].
True positive rate: shows how much of the true positive according to the classifier is labeled as positive class (Polat, Mehr, & Cetin, 2017) [9].
False positive rate: shows how much of the true positive ones are labeled as negative class according to the classifier (Polat, Mehr, & Cetin, 2017) [9].
True negative rate: shows how much negative class is labeled as true negative according to the classifier (Polat, Mehr & Cetin, 2017) [9].
False negative rate: shows how much of the real negative ones are labeled as positive class according to the classifier.
The sum of the true positive rate and the false negative rate is equal to 1. In addition, the sum of the true negative rate and the false positive rate is equal to 1.
Posiyive pred value: shows how much of the classes labeled as positive is actually positive.
ROC curve, which is another evaluation criterion, is the curve where the right and false positive rates for different threshold values are located on the horizontal and vertical axes (Metz, 2006) [11]. The test that gives the ROC curve closest to the upper left corner is known to be the most useful (Dirican, 2001) [12]. In the ROC curve which is on the diagonal curve and approaches the upper left corner, x is considered to be more successful as the classification performance success of the x and y classifiers. (Fawcett, 2006)[13].
e-ISSN: 2148-2683
650
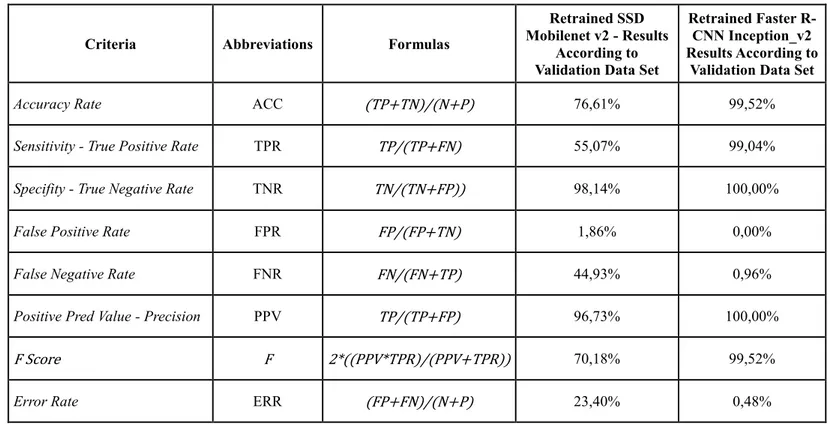
When the evaluation criteria are gathered, the following table emerged.Table 2. Compiled Evaluation Criteria Table
Criteria Abbreviations Formulas
Accuracy Rate ACC (TP+TN)/(N+P)
Sensitivity - True Positive Rate TPR TP/(TP+FN)
Specifity - True Negative Rate TNR TN/(TN+FP))
False Positive Rate FPR FP/(FP+TN)
False Negative Rate FNR FN/(FN+TP)
Positive Pred Value - Precision PPV TP/(TP+FP)
F Score F 2*((PPV*TPR)/(PPV+TPR))
Error Rate ERR (FP+FN)/(N+P)
Besides, the training times and the results of the models are also important. That’s why analyzes were performed by calculating the mean, standard deviation, minimum and maximum values.
Loss Rate: Loss rate is the average of the losses in each training set group. Because a deep learning model learns over time, the loss of one step over the first time is generally higher than the last time. The loss rate reveals that the model has been acting strong or weak after each iteration of the training phase. It is aimed to decrease the rate of loss after repetitions (Chen, 2017) [15].
The Loss function basically calculates how the model's estimate differs from the ground truth. Therefore, if we haven't been able to create a model that predicts well, the difference between the ground truth and the predicted value will be high, so the loss value will be high, and if we have a good model, the loss value will be low. If it is exactly the same, the loss will be 0.
There are multiple types of linear loss functions that calculate the loss value. These loss functions normalize the scores which are produced by the artificial neural network and calculate the loss value. The most common of these are Sigmoid, Multiclass Support Vector Machine (SVM), Softmax etc.
3. Results and Discussion
The results of retraining the SSD- Single Shot Multibox and Faster R-CNN algorithms were evaluated with the evaluation dataset which was created completely independently from the training and test dataset, and the results were obtained.
Firstly, when the accuracy rates were compared, a very successful result was obtained with the Faster R-CNN algorithm with 99.52% detection. The result obtained with the SSD algorithm remained only 76.61%.
Comparing the training times for the two algorithms, the training with the Faster R-CNN algorithm took 165,62 hours with the Intel Core i53230M 2.60 Ghz Processor workstation, while the training took 763.88 hours with the SSD algorithm. In this case, the training of the SSD mobilenet_v2 architecture took 4.6 times longer than the Faster R-CNN inception_v2 architecture. Aforementioned process is expected to obtain faster results if a GPU or if a CPU with a higher processing speed is used instead of CPU.
Table 3. Comparing the Results of SSD and Faster R-CCN Algorithms According to Evaluation Criteria
Criteria Abbreviations Formulas
Retrained SSD Mobilenet v2 - Results
According to Validation Data Set
Retrained Faster R-CNN Inception_v2 Results According to
Validation Data Set
Accuracy Rate ACC (TP+TN)/(N+P) 76,61% 99,52%
Sensitivity - True Positive Rate TPR TP/(TP+FN) 55,07% 99,04%
Specifity - True Negative Rate TNR TN/(TN+FP)) 98,14% 100,00%
False Positive Rate FPR FP/(FP+TN) 1,86% 0,00%
False Negative Rate FNR FN/(FN+TP) 44,93% 0,96%
Positive Pred Value - Precision PPV TP/(TP+FP) 96,73% 100,00%
F Score F 2*((PPV*TPR)/(PPV+TPR)) 70,18% 99,52%
Error Rate ERR (FP+FN)/(N+P) 23,40% 0,48%
As can be seen, the detection of Faster R-CNN airports is very successful according to the SDD algorithm and the error rate is very low.
If the results of the Faster R-CNN and SSD algorithms or image detection times are compared, it is concluded that the SSD Mobilenet v2 architecture can detect images faster than 2.5 times compared to the Faster R-CNN Inception v2 architecture. The average times, standard deviations, minimum and maximum result times of the detection durations are summarized for comparison in the table below.
Table 4. Comparison of Detection Times of Faster R-CNN and SSD Algorithm 100 Validation Data Set Durations Faster R-CNN Inception_v2 SSD Mobilenet_v2
Average Detection Duration 10,37 sec 4,06 sec
Standard Deviation of Detection
Duration 1,18 sec 0,62 sec
Minimum Detection Duration 7,4 sec 2,8 sec
Maximum Detection Duration 14,2 sec 5,5 sec
In addition, 2 sample tests were carried out for the result production durations of two series by using the Minitab program. First of all, for the SSD algorithm and Faster R-CNN algorithm, normal distribution compatibility test was performed separately.
𝐻0: 𝐷𝑎𝑡𝑎 𝑎𝑟𝑒 𝑑𝑖𝑠𝑡𝑟𝑖𝑏𝑢𝑡𝑒𝑑 𝑛𝑜𝑟𝑚𝑎𝑙𝑙𝑦.
e-ISSN: 2148-2683
652
Figure 6. SSD Algorithm Anderson-Darling Test ResultsFigure 7. Faster R-CNN Algorithm Anderson-Darling Test Results
As a result of evaluating the result serial data of both algorithms with Anderson-Darling Test, both P values are considered H0 because they are greater than 0.05. Accordingly, both series are suitable for Normal Distribution.
As a result of compliance of both series with Normal Distribution, two sample tests were started with 95% significance level. 𝐻0: 𝑇ℎ𝑒𝑟𝑒 𝑖𝑠 𝑛𝑜 𝑠𝑖𝑔𝑛𝑖𝑓𝑖𝑐𝑎𝑛𝑡 𝑑𝑖𝑓𝑓𝑒𝑟𝑒𝑛𝑐𝑒 𝑖𝑛 𝑡𝑒𝑟𝑚𝑠 𝑜𝑓 𝑖𝑚𝑎𝑔𝑒 𝑑𝑒𝑡𝑒𝑐𝑡𝑖𝑜𝑛 𝑡𝑖𝑚𝑒𝑠 𝑜𝑓 𝑏𝑜𝑡ℎ 𝑎𝑙𝑔𝑜𝑟𝑖𝑡ℎ𝑚𝑠.
Figure 8. SSD Algorithm and Faster R-CNN Algorithm Two Sample Test Results
H0 is rejected because the P value is less than 0.05. Accordingly, there is a significant difference in terms of image detection times for SSD Algorithm and Faster R-CNN Algorithms. "Estimate for difference" indicates the difference between the averages and this difference is specified as 6,301 seconds.
Retrained SSD Mobilenet V2 and Faster R-CNN inception_v2 Algorithms results put in the ROC Curve. When results compared each other, it has been seen that the Faster R-CNN inception_v2 architecture’s classification performance is higher than SSD Mobilenet V2 architecture.
Figure 9. Comparison of Evaluation Results of SSD and Faster R-CNN Algorithms in ROC Curve
When the Total Loss graphs are compared, the loss rate of the SSD algorithm in 50,000 steps is approaching level 1 starting from 9, and in the Faster R-CNN algorithm converging from 0.15 to less than 0.1. This shows how strong and accurate the Faster R-CNN algorithm has been compared to the SSD algorithm. In addition, it indicates that the error rates have decreased very quickly. Total Loss
e-ISSN: 2148-2683
654
Figure 10. SSD and Faster R-CNN Algorithms Comparison of Loss GraphicsExamples of the detection results of airports carried out in the evaluation data set with SSD - Single Shot Multibox MobileNet_v2 architecture are provided in the following figures.
Figure 12. SDD Algorithm Image Analysis Result-3 Example
e-ISSN: 2148-2683
656
Figure 14. SDD Algorithm Airport Free Image Analysis Result ExampleThe detection result examples of the airports carried out in the evaluation dataset with the Faster R-CNN Inception_v2 architecture are provided in the figures below.
Figure 16. Faster R-CNN Algorithm Image Analysis Result-2 Example
Figure 17. Faster R-CNN Algorithm Image Analysis Result-3 Example
e-ISSN: 2148-2683
658
3. Conclusions and Recommendations
With this study carried out in the field of image processing, it has been clearly proven that which algorithm will produce a more successful result in the detection of objects from unmanned air vehicles and satellite images, which one should be preferred for which purpose. With the study carried out, an assistant decision support system which produces 99.52% accurate results with the Faster R-CNN algorithm; and 76.61% with the SSD algorithm in the determination of airports has been developed for the operators that examine and analyze satellite or unmanned air images
With the successful detection of the image, it has turned out that the data set of multiple different objects that can be introduced for different images taken from the air and space are created and the model can be successfully detected after retraining. These systems, which can be developed as a result, will both support the operators and minimize the risk of overlooking or making mistakes.
In this study, which was carried out with Intel Core i53230M 2.60 Ghz Processor workstation, the production time of the results obtained with the evaluation data set with the SSD algorithm on average was 4.06 seconds and 76.61% successful detection was performed at the end of the 763.88 hour training. With the Faster R-CNN algorithm, 10.37 seconds and 99.52% successful detection was achieved after 165.62 hours of training. Past studies show training and test time comperation between R-CNN (fast – faster) algorithms on VOC data set [16]. This study shows the comperation between Faster R-CNN and SSD training and test time on specific data sets. If the study is carried out via a better-speed CPU or GPU, a significant reduction in both training time and object detection time is expected. With the shortening of the time, the image detection process can also be used in live vehicles in live images. As mentioned, 310 data set gathered from UAV and Satellite images, if the data set images quantity raised, model can be more adapted different situation and accuracy rate gets higher. Nowadays corporate companies started to collect many different data sets and produced search engines such as Google (Google,2019) [17].
In addition to using the created study in critical region detection, if new images are defined, it can be used in search and rescue activities and in the detection of debris-accident areas. Regardless of the image analysis by man, large areas and detected potential areas will be presented quickly to the those who are interested, without the need for any pause, rest or break.
References
[1] Girshick, R., Donahue, J., Darrell, Malik, T. J., Berkeley, U. C. «Rich feature hierarchies for accurate object detection and semantic segmentation. » 2014.
[2] Girshick, R., «Fast R-CNN». Proceedings of the IEEE international conference on computer vision, 2015, ss 1440-1448.
[3] Kamran, F., Shahzad, M., Shafait, F. «Automated Military Vehicle Detection From Low-Altitude Aerial Images. » 2018 Digit. Image Comput. Tech. Appl. 2018. ss 1–8.
[4] Xiaozhu, X., «Object Detection of Armored Vehicles Based on Deep Learning in Battlefield Environment.» 2017. ss 1569–1571. [5] Hsu, C., Chang, C., Lin, C. «A Practical Guide to Support Vector Classification.» vol. 1, no. 1. 2016. ss 1–16.
[6] Ren, S., He, K., Girshick, R. ve Sun, J., «Faster r-cnn: Towards real-time object detection with region proposal networks.», Advances in neural information processing systems, 2016, ss. 91-99.
[7] Liu, W., Anguelov, D., Erhan, D., Szegedy, C., Reed, S., Fu, C.-Y. ve Berg, A. C., «Ssd: Single shot multibox detector, European conference on computer vision.», 2016, ss. 21-37.
[8] Github, «Tensorflow detection model zoo.» ,
https://github.com/tensorflow/models/blob/master/research/object_detection/g3doc/detection_model_zoo.md, [Reach date: 18.11.2019].
[9] Polat, H., Mehr, H. D., & Cetin, A. «Diagnosis of chronic kidney disease based on support vector machine by feature selection methods. » Journal of medical systems, 41(4), 2017, ss. 55.
[10] Lasko, T. A., Bhagwat, J. G., Zou, K. H., & Ohno-Machado, L., «The use of receiver operating characteristic curves in biomedical informatics. Journal of biomedical informatics. » 38(5), 2005, ss.404-415.
[11] Metz, C. E., «Receiver operating characteristic analysis: a tool for the quantitative evaluation of observer performance and imaging systems. » Journal of the American College of Radiology, 3(6), 2006, ss 413-422.
[12] Dirican, A., «Tanı testi performanslarının değerlendirilmesi ve kıyaslanması.» Cerrahpaşa Tıp Dergisi, 32(1), 2001, ss. 25-30. [13] Fawcett, T., An introduction to ROC analysis. Pattern Recogn. Lett.27:861–874, 2006. doi:10.1016/j.patrec.2005.10.010.
[14] Lane, J. E., & Gantley, M. J., «Utilizing Complex Systems Statistics for Historical and Archaeological Data». Journal of Cognitive Historiography, 3(1-2), 2017, ss 68-92.
[15] Chen, K., «How to interpret “loss” and “accuracy” for a machine learning model.», Web Site: https://stackoverflow.com/questions/34518656/how-tointerpretloss-and-accuracy-for-a-machine-learning-model, 2017, [Reach Date: 20.12.2019].
[16] Li, F., Johnson, J., Yeung, S., «Lecture11: Detection & Segmentation », Stanford University, 2017, ss 80-82 http://cs231n.stanford.edu/slides/2017/cs231n_2017_lecture11.pdf [Reach Date: 22.12.2019].
![Şekil 1. R-CNN Methodology (Girshick, Donahue, Darrell & Malik, 2014) [1] 2.1.2. Fast R-CNN](https://thumb-eu.123doks.com/thumbv2/9libnet/3899277.43763/3.892.107.804.247.450/şekil-cnn-methodology-girshick-donahue-darrell-malik-fast.webp)
![Şekil 4. Single Shot Multibox Detector Architecture (Liu, Anguelov, Erhan, Szegedy, Reed, Fu, Berg, 2016) [7]](https://thumb-eu.123doks.com/thumbv2/9libnet/3899277.43763/4.892.53.840.925.1141/şekil-single-multibox-detector-architecture-anguelov-erhan-szegedy.webp)