© TÜBİTAK
doi:10.3906/kim-1810-72 h t t p : / / j o u r n a l s . t u b i t a k . g o v . t r / c h e m /
Research Article
Enhanced uptake capacities and isosteric heats of CO
2and CH
4adsorption on
spent coffee ground activated carbons loaded with metal ions
Çisem KIRBIYIK1,, Burak Zafer BÜYÜKBEKAR2,3,∗,, Mahmut KUŞ4,, Mustafa ERSÖZ3,5, 1Department of Chemical Engineering, Faculty of Natural Sciences and Engineering, Konya Technical University,
Konya, Turkey
2Department of Nanotechnology and Advanced Materials, Selçuk University, Turkey 3Advanced Technology Research and Application Center, Selçuk University, Konya, Turkey
4Institute of Energy Technologies, Gebze Technical University, Gebze, Turkey 5Department of Chemistry, Faculty of Science, Selçuk University, Konya, Turkey
Received: 31.10.2018 • Accepted/Published Online: 08.04.2019 • Final Version: 11.06.2019
Abstract: Low-cost activated carbon (AC) samples obtained from waste coffee grounds were used for CO2 and CH4 adsorption. ACs were prepared by chemical activation and carbonized at three different temperatures. AC carbonized at 800 ◦C showed a relatively high surface area (582.92 m2 g−1) and high adsorption capacities of 2.6 mmol g−1 and 1.1 mmol g−1 at 25 ◦C for CO2 and CH4, respectively. Adsorbent samples were prepared by loading of Fe3+ metal ions onto ACs and their adsorption capacities were compared with those of nonloaded ACs. As expected, the loading of Fe3+ metal ions increased the adsorption capacities at all temperatures and the adsorption capacity of Fe3+-loaded AC carbonized at 800◦C was 3.1 mmol g−1 for CO2 and 1.2 mmol g−1 for CH4 at 25◦C. The isosteric heats of adsorption were calculated at 0–35 ◦C with the range of 20–35 kJ mol−1 and 18–23 kJ mol−1 for CO2 and CH4, respectively. According to our findings, bio-based ACs can be used as an effective and alternative adsorbent for capturing different gas molecules.
Key words: Bio-based activated carbon, CO2 adsorption, CH4 adsorption, isosteric heat
1. Introduction
According to a World Meteorological Organization report, the concentrations of greenhouse gases, which play a
critical role in global warming and the acidity of water sources, reached new highs in 2015.1 That study reported
that the global abundances of CO2, CH4, and N2O gases were 400 ppm, 1845 ppb, and 328 ppb, respectively.1
The main reason for the increasing concentrations of these gases in the atmosphere is the combustion of fossil
fuels for transportation and to supply the energy demand.2 As energy demand increases, the anthropogenic gas
emissions increase every year; therefore, the capturing and storing of these gases have attracted attention in
academic and industrial fields.3 Different techniques for the capturing of greenhouse gases such as membrane
separation, chemical absorption, or physical adsorption have been widely studied and reported.4 In these
techniques, adsorption has become one of the most promising techniques due to its facile application, low cost,
and low energy requirement.5
In the adsorption technique, activated carbon (AC) is the most investigated adsorbent owing to its high
adsorption capacity, high surface area, and porous structure.6 However, AC is relatively expensive and this
∗Correspondence: [email protected]
limits the application of large-scale industrial operations.7 Therefore, many studies have been reported to
identify new low-cost and feasible precursor materials to reduce the production cost of AC.8 Many different
natural materials such as by-products of oil factories, solid and unwanted agricultural by-products, coal, and
municipal waste have been investigated as precursors and evaluated in different adsorption processes.9−14 As
is well known, the natural chemical composition of a precursor material plays a crucial role in the adsorption capacity and application area of AC. In particular, AC species containing nitrogen are important for gas phase
adsorption processes.15,16 The presence of hetero atoms like nitrogen on the surface of carbon improves the
surface polarity and basicity, leading to enhancement of the interaction between adsorbent surface and gas
molecules with an acidic nature like CO2 and CH4. For this reason, spent coffee grounds (GC) were selected as
a precursor to produce AC. This municipal waste contains caffeine (C8H10N4O2) , which is a natural source of
nitrogen, and it is produced in large amounts in modern life. There have been many reports about the adsorption of different pollutants such as dyes and phenols onto GC-based AC, but there are surprisingly limited studies
on the adsorption of different types of gas pollutants.17 Therefore, we discuss here the production of low-cost
and highly effective activated carbon (GCAC) from spent coffee grounds for the adsorption of CO2 and CH4
gases. In addition to the importance of the nature of the precursor material and the structural properties, the modification of AC’s surface has an important effect on the gas adsorption capacity. The modification procedure provides an opportunity to incorporate surface functional groups with improved affinity for increased gas adsorption performance. Even though the role of metal ion loading to the AC surface in gas adsorption
still needs to be explored, it is considered that the basic nature of metals can interact with acidic CO2 and
CH4 molecules. Therefore, we also investigated the effect of loading Fe3+ metal ions onto AC on adsorption
capacity.
AC samples can be produced by chemical or physical activation. ZnCl2, a typical kind of Lewis acid, can
be utilized as a chemical activation agent to produce AC with a high surface area. ZnCl2 has been reported
to promote dehydration during the carbonization process, contributing to the development of pore structure.
At higher temperatures, ZnCl2 vaporizes and decomposes into zinc and chlorine to create an enlarged pore
structure. To produce highly efficient bio-based AC, GC was chemically activated by ZnCl2 and then the
effects of carbonization temperature (600, 700, and 800 ◦C) on surface characteristics and gas adsorption
capacities were examined. The produced GCAC samples were treated with a certain volume of Fe3+ metal
ion solution. The effect of loading Fe3+ metal ions onto the GCAC produced (Fe-GCAC) was investigated.
We determined that the Fe3+ metal ions-loaded Fe-GCAC sample carbonized at 800 ◦C shows an effective
increase of 4.2 mmol g−1 adsorbed CO2 in comparison with 3.5 mmol g−1 adsorbed CO2 onto the GCAC
sample produced at the same temperature without metal ion loading at 0 ◦C under 900 mmHg adsorption
conditions. A similar trend in the same samples was observed for the adsorption of CH4 with an increase from
1.5 mmol g−1 to 1.7 mmol g−1. Finally, the recoverability of the best resulting adsorbent was tested after the
adsorption study. The results obtained show that the AC from natural waste sources is applicable for future
gas adsorption applications. The CO2 and CH4 adsorption capacities can be enhanced by adding a simple step
to the production process of ACs via loading metal ions. 2. Experimental
2.1. Materials and instrumentation
All chemicals were purchased from commercial sources and used without further purification. Waste coffee grounds chosen as precursor were collected from domestic coffee machines. Deionized water with a specific
resistance of 18.2 M Ω cm was obtained by ion exchange and filtration (Direct-Q Water Purification System).
ZnCl2 pellets (98%) and iron (III) chloride hexahydrate (98%) were purchased from Sigma-Aldrich.
Morphological, structural, and surface analyses were carried out using Fourier transform infrared spec-troscopy (FTIR, Bruker Vertex 70), a scanning electron microscope (SEM, Zeiss EVO 50), thermal gravimetric analysis (TGA, Mettler Toledo TGA/DSC 2), and Brunauer–Emmett–Teller (BET, Micromeritics Tristar II) techniques.
2.2. Preparation of activated carbons
The preparation method for GCAC and Fe-GCAC samples obtained at different temperatures from GC is given in the Scheme. The GC was washed with distilled water, dried at room temperature, and subsequently dried in
an oven at 85◦C for 48 h to remove its moisture. GCAC samples were prepared by two-step chemical activation
and carbonization as reported previously.18,19 For the chemical activation of precursor, a certain amount of
ZnCl2 pellets was dissolved in double deionized water and an equal amount of GC was immersed into ZnCl2
solution for impregnation. The impregnated biomass samples were kept at room temperature overnight and
subsequently dried in an oven at 85 ◦C for 48 h. Dried samples were carbonized at three different final
temperatures (600, 700, and 800 ◦C) with a 10 ◦C/min heating rate. After cooling down to room temperature,
samples carbonized (coded as GCAC/600, GCAC/700, and GCAC/800 according to activation temperature)
were washed with distilled water several times to remove residuals and then dried at 85 ◦C for 48 h.
Scheme. The preparation method of GCAC and Fe-GCAC samples from GC.
In order to determine the adsorption capacities of Fe3+ metal ions-loaded GCAC samples, Fe-GCAC
samples were prepared by treating 0.4 g of each GCAC sample with 400 mL of 400 mg/L of Fe3+ solution for
60 min. After metal ion loading, each Fe-GCAC sample was separated by filtering and washed with deionized
2.3. Material characterizations
The thermogravimetric analyses of raw material and ZnCl2 impregnated raw material (ZnCl2-GC) and two ACs
as representative samples were performed. Raw material, ZnCl2-GC, GCAC, and Fe-GCAC samples produced
at three different temperatures were examined using FTIR to determine their surface chemistry. The surface
and pore texture of AC samples were characterized using an adsorption apparatus at –196 ◦C by measuring
N2 adsorption–desorption isotherms. The surface area and average pore width were calculated by the BET
method. Total pore volume was obtained from N2 adsorption at the highest relative pressure studied. The
average pore diameter was calculated by the Barrett–Joyner–Halenda (BJH) method. Before the adsorption
analysis, the adsorbents were degassed at 300 ◦C overnight to remove moisture and other adsorbed gases. In
order to determine the surface morphology of AC samples, SEM was used via the conventional method including mounting the adsorbent samples on an aluminum stub.
2.4. CO2 and CH4 adsorption–desorption and recoverability experiments
CO2 and CH4 adsorption–desorption measurements were carried out using the same apparatus used in the
N2 adsorption experiments. All gas adsorption–desorption experiments were performed with pure gases. The
adsorption–desorption isotherms of both CO2 and CH4 for all samples degassed at 300 ◦C were measured up
to 900 mmHg at 0, 25, and 35 ◦C.
The cyclic working capacity of CO2 onto the sample with the highest adsorption capacity was performed
for 6 cycles at 25 ◦C up to 760 mmHg to test the stability and adsorptive repeatability. After each cycle,
saturated adsorbent was degassed at 300 ◦C in pure N2 to fully release the adsorbed CO2 overnight.
3. Results and discussion 3.1. Characterizations
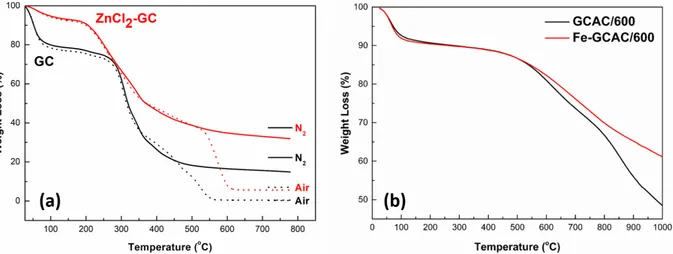
Figure 1a shows TGA curves of GC and ZnCl2-GC in air and N2 atmosphere. The TGA curves of both samples
showed similar weight loss stages, while the percent weight losses were different. The percent weight loss of
ZnCl2-GC was lower than that of raw material. Between 30 and 150 ◦C, raw material exhibited a weight loss
of 22 wt.%, whereas ZnCl2-impregnated raw material exhibited a weight loss of 7 wt.%. The first weight loss
stage is attributed to physisorbed water and gases.20 The significant weight losses observed are associated with
the decomposition of hydroxyl, carboxylic, and other surface functional groups at the second weight loss stage from ∼200 to 500 ◦C.21 Figure 1b shows the TGA analysis for GCAC/600 and Fe-GCAC/600 samples. Up to
∼100 ◦C, both samples exhibited a weight loss of ∼10 wt.% and, up to ∼500 ◦C, there were no significant
weight changes. By analyzing both graphs, it can be observed that the AC samples are very highly resistant
to weight loss compared to GC and ZnCl2-GC from room temperature to 500 ◦C. The most significant weight
loss of AC samples occurred between 500 and 1000 ◦C. Although both AC samples showed similar weight loss
trends, Fe-GCAC/600 showed less weight loss than GCAC/600 did after the loading of Fe3+ ions.
The FT-IR spectra of raw material, ZnCl2-impregnated sample, and all ACs produced are given in Figure
2. As expected, the broad bands at 3315 cm−1, related to hydroxyl O–H from physiosorbed water, disappeared
after carbonization. The bands observed at 2923 cm−1 and 2853 cm−1, at 1743 cm−1, at 1636 cm−1, and at
1155 cm−1 are assigned to C–H stretching, C=O stretching in carboxylic groups, and N–H and C–N functional
groups, respectively.22,23 Therefore, it can be proposed that the prepared ACs are mainly composed of carbon
Figure 1. TGA spectra of (a) GC and ZnCl2-GC and (b) GCAC/600 and Fe-GCAC/600.
content of raw material during carbonization, a new band appeared at 2357 cm−1 corresponding to an increase
in nitrogenous groups in AC produced.24 This is consistent with reports on the carbonization of nitrogen
containing precursors to introduce nitrogen to carbonaceous materials.25 Moreover, the broad bands at 670
cm−1 support the presence of Fe–O bonds.26
Figure 2. FT-IR spectra of GC, ZnCl2-GC, and activated carbons produced.
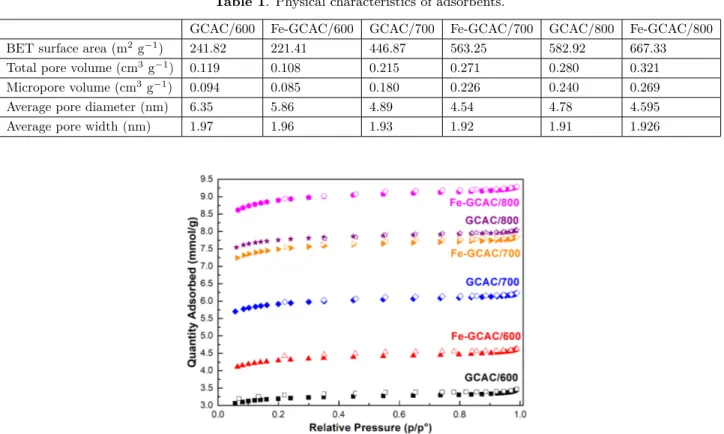
Table 1 shows the textural characteristics and BET surface areas of all samples and they were derived
from the N2 adsorption and desorption isotherms given in Figure 3. All samples gave type I isotherms in the
IUPAC classification, which indicates the microporous nature of samples. In addition, a small hysteresis is seen between the adsorption and desorption isotherms in Figure 3. It indicates that there are small proportions
of mesopores and macropores.27 BET specific surface areas of ACs were determined as 241.82, 446.87, and
582.92 m2 g−1 for samples carbonized at 600, 700, and 800 ◦C, respectively. Compared with the literature,
GCAC/800 showed a relatively high surface area. For example, Hao et al. reported that physically AC obtained
Table 2).28−32 As carbonization temperature increased, the total pore volume exhibited an increase from 0.12
to 0.28 cm3/g.
Table 1. Physical characteristics of adsorbents.
GCAC/600 Fe-GCAC/600 GCAC/700 Fe-GCAC/700 GCAC/800 Fe-GCAC/800 BET surface area (m2 g−1) 241.82 221.41 446.87 563.25 582.92 667.33 Total pore volume (cm3g−1) 0.119 0.108 0.215 0.271 0.280 0.321
Micropore volume (cm3g−1) 0.094 0.085 0.180 0.226 0.240 0.269
Average pore diameter (nm) 6.35 5.86 4.89 4.54 4.78 4.595
Average pore width (nm) 1.97 1.96 1.93 1.92 1.91 1.926
Figure 3. The N2 adsorption and desorption isotherms of GC, ZnCl2-GC, and activated carbons produced.
Table 2. Comparison of the physical characteristics of activated carbons obtained from different biomass materials. Adsorbent SBET (m2g−1) Vtotal(cm3g−1) Pore size (nm) References
Physically activated carbon from biosludge 489 0.39
-[28] Physically activated carbon from beer waste 622 0.32
-Raw-palm shell activated carbon 617 0.32 2.09
[29]
CO2-palm shell activated carbon 623 0.31 2.02
wt. 10% MgO loaded activated carbon from whitewood 651 0.34 [30] microporous carbon compartments from pristine wheat flour 648 0.30 - [31] The aminated activated carbon (concentrated) 507 0.30 3.28 [32]
Fe-GCAC/800 667 0.32 4.59 Present study
As seen clearly from Table 1, the N2 adsorption capacity is dramatically influenced by both carbonization
temperature and metal ion loading onto ACs. After the loading of Fe3+ ions onto ACs, the BET surface areas
and total pore volumes slightly increased. Regardless of Fe3+ ions content, treating AC samples with an
excessive amount of metal ion solution leads to larger pore volumes and surface areas.33 When the temperature
increased from 600 to 800 ◦C, the surface areas of Fe3+ loaded ACs increased from 221 to 667 m2/g as shown
suitable for effective elimination of air pollutants. SEM images of all samples show a typical morphology with a highly microporous structure (Figure 4). The morphological results are consistent with the results revealed
from N2 adsorption experiments. ZnCl2 activation provided an orderly pore distribution and well-developed
surface due to its acidic character. Its dehydration and impurity scraping effect produce open pores in the
surface.34−36
Figure 4. SEM images of raw material and all activated carbons produced (scale bar = 40 µ m).
The pore size distribution and cumulative pore volumes were determined based upon the adsorption– desorption isotherm by a modified BJH model. Figure 5 shows the pore size distributions, which indicates that all samples have a unimodal pattern with a broad peak at 2.5?nm. As an exception, in Figure 5, there is also a remarkable peak at 110 nm in pore size distribution for the GCAC/600 sample. Pore volumes less than
10?nm dominate in all AC samples. The loading of Fe3+ ions onto ACs has no strong effect on the pore size
distribution. Figure 6 is a plot of the cumulative pore volume of all AC samples. As seen, the cumulative pore
volumes of nonloaded AC samples increased from 0.012 to 0.014 cm3 g−1, whereas the cumulative pore volumes
of AC samples loaded with Fe3+ metal ions increased from 0.010 to 0.018 cm3 g−1 on increasing activation
temperature from 600 to 800 ◦C. It can be said that the pores of the ACs were not blocked by Fe3+ ions, which
Figure 5. Incremental pore volumes of activated carbon
samples.
Figure 6. Cumulative pore volumes of activated carbon
samples.
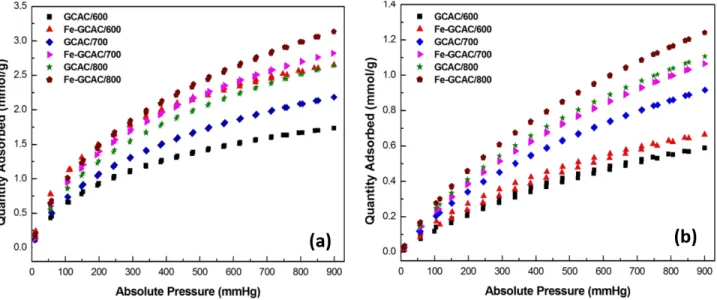
3.2. CO2 and CH4 adsorption–desorption
To produce highly efficient AC it is required to control the anthropogenic gas emission especially under ambient
conditions.37 CO
2 and CH4 adsorption–desorption isotherms measured at 25 ◦C room temperature are shown
in Figure 7. Table 3 lists CO2 and CH4 adsorption capacities of all samples at 0, 25, and 35 ◦C. In the case of
metal ion-free samples, the amount of CO2 adsorbed increased from 1.7 to 2.6 mmol g−1 when carbonization
temperature increased. A similar trend was observed for CH4 adsorption. The amount of CH4 adsorbed onto
the GCAC/800 sample was 1.1 mmol g−1. When we compared Fe3+ metal loaded samples with metal
ion-free samples, loading of Fe3+ ions onto AC significantly increased the adsorption capacities at all carbonization
temperatures. It can be explained by the increasing in chemisorption of gas molecules onto ACs, which is related
to electrostatic interactions between CO2–CH4 and extra Fe3+ metal ions.21,34,38Fe-GCAC/800 showed a high
CO2 adsorption capacity of 3.1 mmol g−1. This amount of CO2 adsorbed is higher than that of many
bio-based ACs studied in the literature. For instance, Plaza et al. produced AC from spent coffee grounds at
a carbonization temperature of 600 ◦C with 1:1 ratio of KOH/precursor and the adsorbent exhibited a CO2
adsorption capacity of 2.8 mmol g−1 at 25 ◦C and 1 bar.39 Another study reported that the AC obtained
using olive stone showed 2.4 mmol g−1 CO2 adsorption capacity at the same adsorption conditions (for further
comparisons of CO2 and CH4 adsorption capacities, see Table 4).40−56 These results suggest that the addition
of a single metal ion loading step into the AC production process can be used to improve the adsorption capacity of ACs.
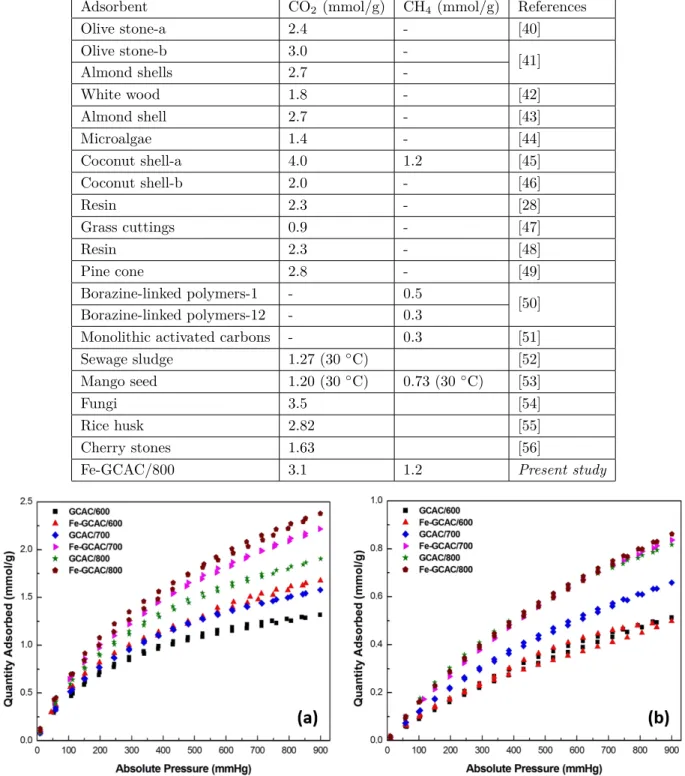
There are many reports on the identification of the CO2 and CH4 adsorption behaviors of different
ACs.57,58 Table 3 shows the adsorption capacity results obtained in the present work at 0, 25, and 35 ◦C. CO 2
and CH4 adsorption–desorption isotherms measured at 0 and 35 ◦C are shown in Figures 8 and 9, respectively.
As shown in Table 3, Fe-GCAC/800 showed the highest CO2 and CH4 adsorption capacities of 4.2 and 1.7
mmol g−1 at 0 ◦C. When the temperature increased, the amount of adsorbed CO2 decreased to 2.4 mmol
g−1, whereas the amount of adsorbed CH4 decreased to 0.8 mmol g−1. This shows that the adsorption is an
Figure 7. The (a) CO2 and (b) CH4 adsorption–desorption isotherms measured at 25 ◦C on activated carbons produced.
Table 3. Maximum CO2 and CH4 adsorption capacities at 0 ◦C, 25 ◦C, and 35 ◦C up to 900 mmHg. Adsorption capacity
(mmoladsorbed/gadsorbent)
Adsorption
temperature GCAC/600 Fe-GCAC/600 GCAC/700 Fe-GCAC/700 GCAC/800 Fe-GCAC/800 CO2 0◦C 2.361 2.888 2.911 3.759 3.484 4.179 CH4 0.860 0.939 1.219 1.523 1.468 1.699 CO2 25◦C 1.734 2.652 2.184 2.823 2.641 3.138 CH4 0.589 0.664 0.917 1.065 1.107 1.242 CO2 35◦C 1.317 1. 675 1.578 2.218 1.904 2.379 CH4 0.513 0.498 0.659 0.836 0.817 0.862
Table 4. Comparison of the adsorbed amount of CO2 and CH4 (at 25 ◦C) for porous carbons obtained from different biomass materials.
Adsorbent CO2 (mmol/g) CH4 (mmol/g) References
Olive stone-a 2.4 - [40] Olive stone-b 3.0 -[41] Almond shells 2.7 -White wood 1.8 - [42] Almond shell 2.7 - [43] Microalgae 1.4 - [44] Coconut shell-a 4.0 1.2 [45] Coconut shell-b 2.0 - [46] Resin 2.3 - [28] Grass cuttings 0.9 - [47] Resin 2.3 - [48] Pine cone 2.8 - [49] Borazine-linked polymers-1 - 0.5 [50] Borazine-linked polymers-12 - 0.3
Monolithic activated carbons - 0.3 [51]
Sewage sludge 1.27 (30◦C) [52]
Mango seed 1.20 (30◦C) 0.73 (30◦C) [53]
Fungi 3.5 [54]
Rice husk 2.82 [55]
Cherry stones 1.63 [56]
Fe-GCAC/800 3.1 1.2 Present study
Figure 9. The (a) CO2 and (b) CH4 adsorption–desorption isotherms measured at 35 ◦C on activated carbons produced.
3.3. Isosteric heat of adsorption
The isosteric heat of adsorption was calculated by applying the Clausius–Clapeyron equation (Eq. (1)) to provide
To calculate the isosteric heat of adsorption, adsorption isotherms were measured at three different temperatures (0, 25, and 35 ◦C). Qst=−R [ ∂ ln p ∂(T1) ] q , (1)
where Qst is the isosteric heat of adsorption, R is the ideal gas constant, p is pressure, and T is temperature.
Integration of Eq. (1) gives Eq. (2), as given below:
(ln p)q =− ( Qst R ) ( 1 T ) + c, (2)
where c is a constant. Qst is calculated from the slope of the curve obtained by plotting ln p vs. 1/T. Figures
10a and 10b, 11a and 11b, and 12a and 12b show the variations in isosteric heat of CO2 and CH4 adsorption
onto GCAC/600, Fe-GCAC/600, GCAC/700, Fe-GCAC/700, GCAC/800, and Fe-GCAC/800, respectively.
Figure 10. The CO2 and CH4 adsorption isosteres onto (a) GCAC/600 and (b) Fe-GCAC/600 samples at 0, 25, and 35 ◦C.
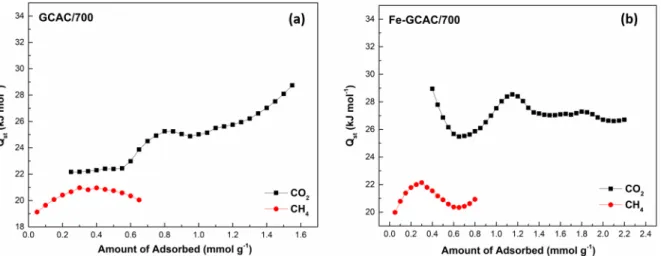
Figure 11. The CO2 and CH4 adsorption isosteres onto (a) GCAC/700 and (b) Fe-GCAC/700 samples at 0, 25, and 35 ◦C.
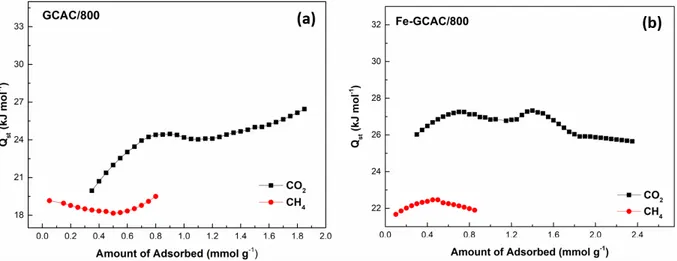
Figure 12. The CO2 and CH4 adsorption isosteres onto (a) GCAC/800 and (b) Fe-GCAC/800 samples at 0, 25, and 35 ◦C.
In the experimental results for all GCAC samples nonloaded with Fe3+ ions, it can be seen that the Q
st
values of adsorption for CO2 show an increase with increased CO2 loading. In Figure 10a, Qst values were
calculated in the range of 26–32 kJ mol−1 for CO2 at loadings of 0.2–1.3 mmol g−1 for GCAC/600, which is in
accordance with the report data indicating that favorable interactions exist among adsorbed CO2 molecules.61
For GCAC/600, the Qst value of CH4 increased from 18 kJ mol−1 to 21 kJ mol−1 with increasing loading
< 0.3 mmol g−1. After that, with increasing loading, the Qst value of adsorption decreased from 21 to 19 kJ
mol−1 up to 0.5 mmol g−1. Similar behavior was reported by Khalili et al. for adsorption of CH4 on pine
cone-based AC.62 For all GCAC samples loaded with Fe3+ ions, it can be seen that the Q
st values of CO2
obtained were smaller than 30 kJ/mol, but there is a wave in the Qst values as a function of surface loading.
This fluctuation in the Qst values can be attributed to different surface coverage values. The isosteric heat of
adsorption depends on surface coverage.63 For GCAC/800, Q
st values were calculated in the ranges of 20–27
kJ mol−1 for CO2 at loadings of 0.3–1.8 mmol g−1 and 18–20 kJ mol−1 for CH4 at loadings of 0.05–0.8 mmol
g−1. For Fe-GCAC/800, the values were calculated in the ranges of 25–28 kJ mol−1 for CO2 at loadings of 0.3–
2.4 mmol g−1 and 21–23 kJ mol−1 for CH4 at loadings of 0.1–0.9 mmol g−1. According to the general trend,
the loading of Fe3+ ions onto the ACs increases the Q
st values calculated due to the electrostatic interactions
between both CO2–CH4 and extra Fe3+ metal ions.57 This increase agrees with the increase in adsorption
capacity mentioned in Sec. 3.2. Qst values calculated for CO2 adsorption compare well with reported values
on other different carbonaceous materials in the literature64,65 and Q
st values calculated for CH4 adsorption
are similar to reported values.66,67 For all samples, Q
st values were in a moderate range of 20–35 kJ mol−1 and
18–23 kJ mol−1 for CO2 and CH4, respectively. Since the Qst values are relatively low, it can be considered
that the interactions between gas molecules and AC samples predominantly proceed by physisorption.68 The
low Qst values suggests the potential for recoverability and reusability of the adsorbents.69 Therefore, the
recoverability potential was investigated as described below. 3.4. Recoverability tests
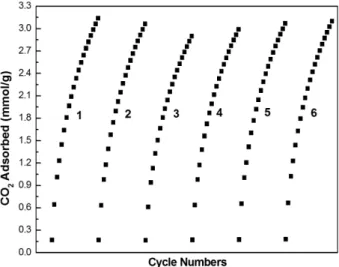
Recoverability of adsorbent is one of the most important parameters for future practical applications of
using Fe-GCAC/800 with the highest adsorption capacity by the same apparatus mentioned in Sec. 2.2 and detailed in Sec. 2.3. According to the results shown in Figure 13, only 2% adsorption capacity loss was observed after six cycles. This low loss of adsorption capacity is indicative of Fe-GCAC/800 recoverable with maintained adsorbent stability.
Figure 13. CO2 adsorption cycles for Fe-GCAC/800 (repeating adsorption at 25 ◦C followed by desorption at 25 ◦C).
3.5. Conclusions
In this study, microporous ACs were prepared from spent coffee grounds via chemical activation with 1:1
ratio of ZnCl2:GC and the mixture was carbonized at three different temperatures (600, 700, and 800 ◦C).
The GCAC/800 sample showed the highest surface area of 583 m2 g−1 when compared to metal ion-free
AC samples. The ACs produced were used to capture CO2 and CH4. The GCAC/800 sample showed high
adsorption capacities of 2.6 mmol g−1 and 1.1 mmol g−1 at 25 ◦C for CO2 and CH4, respectively. To
investigate the effect of metal ion loading onto carbonaceous materials, the ACs produced were simply treated
with a certain volume of Fe3+ metal ion solutions. The BET analysis and the gas adsorption experiments
showed that surface areas and adsorption capacities increased with loading Fe3+ ions onto the ACs produced.
The Fe-GCAC/800 sample with the highest surface area showed the maximum adsorption capacity of 3.1 mmol
g−1 CO2 and 1.2 mmol g−1 CH4 at 25 ◦C. For all samples, the isosteric heat of adsorption was additionally
calculated in the range of 20–35 kJ mol−1 and 18–23 kJ mol−1 for CO2 and CH4, respectively at 0, 25,
and 35 ◦C. These low Qst values calculated indicate that AC samples can be reused and have a potential for
recoverability. The recoverability test of CO2 adsorption–desorption onto of Fe-GCAC/800 is consistent with
the results obtained in the isosteric heat calculation of adsorption. With the present study, we propose a simple
and low-cost method to produce highly efficient AC with a high surface area for CO2 and CH4 adsorption.
Acknowledgments
B.Z. Büyükbekar partially contributed from his PhD thesis and he thanks Selçuk University Scientific Research Council (project number: 18201081). The authors also would like to thank the Selçuk University Advanced Technology Research and Application Center for the facilities and technical assistance.
References
1. WMO. The State of Greenhouse Gases in the Atmosphere Based on Global Observations through 2015. World Meteorological Organization. 2016.
2. He, J. J.; To, J. W. F.; Psarras, P. C.; Yan, H. P.; Atkinson, T.; Holmes, R. T.; Nordlund, D.; Bao, Z. N.; Wilcox, J. Adv. Energy Mater. 2016, 6, 1502491.
3. Plaza, M. G.; Gonzalez, A. S.; Rubiera, F.; Pevida, C. J. Chem. Technol. Biot. 2015, 90, 1592-1600. 4. Fujiki, J.; Chowdhury, F. A.; Yamada, H.; Yogo, K. Chem. Eng. J. 2017, 307, 273-282.
5. Heidari, A.; Younesi, H.; Rashidi, A.; Ghoreyshi, A. A. Chem. Eng. J. 2014, 254, 503-513. 6. Sarici-Ozdemir, C.; Onal, Y. Particul. Sci. Technol. 2018, 36, 254-261.
7. Royer, B.; Cardoso, N. F.; Lima, E. C.; Vaghetti, J. C. P.; Simon, N. M.; Calvete, T. J. Hazard. Mater. 2009,
164, 1213-1222.
8. Wickramaratne, N. P.; Jaroniec, M. ACS Appl. Mater. Interfaces 2013, 5, 1849-1855. 9. Baccar, R.; Bouzid, J.; Feki, M.; Montiel, A. J. Hazard. Mater. 2009, 162, 1522-1529. 10. Namasivayam, C.; Kadirvelu, K. Carbon 1999, 37, 79-84.
11. Zhang, Q. L.; Lin, Y. C.; Chen, X.; Gao, N. Y. J. Hazard. Mater. 2007, 148, 671-678.
12. Mohan, D.; Sarswat, A.; Singh, V. K.; Alexandre-Franco, M.; Pittman, C. U. Chem. Eng. J. 2011, 172, 1111-1125. 13. Sarici-Ozdemir, C.; Kilic, F. Particul. Sci. Technol. 2018, 36, 194-201.
14. Sarici-Ozdemir, C.; Onal, Y.: Akmil-Basar, C. Fuel Process. Technol. 2006, 87, 979-986.
15. Kante, K.; Nieto-Delgado, C.; Rangel-Mendez, J. R.; Bandosz, T. J. J. Hazard. Mater. 2012, 201, 141-147. 16. Xiao, J.; Ma, X. L.; Song, C. S.; Li, Z. Abstr. Pap. Am. Chem. Soc. 2009, 238.
17. Laksaci, H.; Khelifi, A.; Trari, M.; Addoun, A. J. Clean Prod. 2017, 147, 254-262. 18. Kirbiyik, C.; Putun, A. E.; Putun E. Water Sci. Technol. 2016, 73, 423-436.
19. Kirbiyik, C.; Kilic, M.; Cepeliogullar, O.; Putun, A. E. Water Sci. Technol. 2012, 66, 231-238. 20. Hong, S. M.; Jang, E.; Dysart, A. D.; Pol, V. G.; Lee, K. B. Sci. Rep. 2016, 6, 34590.
21. Younas, M.; Leong, L. K.; Mohamed, A. R.; Sethupathi, S. Chem. Eng. Commun. 2016, 203, 1455-1463. 22. Abbas, M.; Kaddour, S.; Trari, M. J. Ind. Eng. Chem. 2014, 20, 745-751.
23. Tseng, R. L.; Wu, F. C.; Juang, R. S. Sep. Purif. Technol. 2015, 140, 53-60. 24. Creamer, A. E.; Gao, B.; Zhang, M. Chem. Eng. J. 2014, 249, 174-179.
25. Hulicova-Jurcakova, D.; Kodama, M.; Shiraishi, S.; Hatori, H.; Zhu, Z. H.; Lu, G. Q. Adv. Funct. Mater. 2009,
19, 1800-1809.
26. Togashi, T.; Naka, T.; Asahina, S.; Sato, K.; Takami, S.; Adschiri, T. Dalton Trans. 2011, 40, 1073-1078. 27. Song, M.; Jin, B. S.; Xiao, R.; Yang, L.; Wu, Y. M.; Zhong, Z. P. Biomass Bioenergy 2013, 48, 250-256. 28. Hao, W.; Björkman, E.; Lilliestråle, M.; Hedin, N. Appl. Energy 2013, 112, 526-532.
29. Younas, M.; Leong, L. K.; Mohamed, A. R.; Sethupathi, S. Chem. Eng. Commun. 2016, 203, 1455-1463. 30. Shahkarami, S.; Dalai, A. K.; Soltan, J. Ind. Eng. Chem. Res. 2016, 55, 5955-5964.
31. Hong, S. M.; Jang, E.; Dysart, A. D.; Pol, V. G.; Lee, K. B. Sci. Rep. 2016, 6, 34590.
32. Zhang, C.; Song, W.; Sun, G.; Xie, L.; Wang, J.; Li, K.; Sun, C.; Liu, H.; Snape, C. E.; Drage, T. Energy Fuels
2013, 27, 4818-4823.
33. Shahkarami, S.; Dalai, A. K.; Soltan, J. Ind. Eng. Chem. Res. 2016, 55, 5955-5964. 34. Sahin, O.; Saka, C.; Ceyhan, A. A.; Baytar, O. Sep. Sci. Technol. 2015, 50, 886-891.
35. Islam, M. A.; Ahmed, M. J.; Khanday, W. A.; Asif, M.; Hameed, B. H. Ecotoxicol. Environ. Saf. 2017, 138, 279-285.
36. Arami-Niya, A.; Rufford, T. E.; Zhu, Z. Energy Fuels 2016, 30, 7298-7309. 37. Park, H. J.; Suh, M. P. Chem. Sci. 2013, 4, 685-690.
38. Yang, Q.; Xu, Q.; Liu, B.; Zhong, C.; Berend, S. Chinese J. Chem. Eng. 2009, 17 (5), 781-790. 39. Plaza, M. G.; González, A. S.; Pevida, C.; Pis, J. J.; Rubiera, F. Appl. Energy 2012, 99, 272-279.
40. Plaza, M. G.; Pevida, C.; Arias, B.; Fermoso, J.; Casal, M. D.; Martín, C. F.; Rubiera, F.; Pis, J. J. Fuel 2009,
88, 2442-2447.
41. Gonzáles, A. S.; Plaza, M. G.; Rubiera, F.; Pevida, C. Chem. Eng. J. 2013, 230, 456-465. 42. Shahkarami, S.; Azargohar, R.; Dalai, A. K.; Soltan, J. J. Environ. Sci. 2015, 34, 68-76.
43. Plaza, M. G.; Pevida, C.; Martín, C. F.; Fermoso, J.; Pis, J. J.; Rubiera, F. Sep. Purif. Technol. 2010, 71, 102-106. 44. Zhang, Z.; Wang, K.; Atkinson, J. D.; Yan, X.; Li, X.; Rood, M. J.; Yan, Z. J. Hazard. Mater. 2012, 229, 183-191. 45. Blanco, A. A. G.; de Oliveira, J. C. A.; López, R.; Moreno-Piraján, J. C.; Giraldo, L.; Zgrablich, G.; Sapag, K.
Colloids Surf. A Physicochem. Eng. Asp. 2010, 357, 74-83.
46. Himeno, S.; Komatsu, T.; Fujita, S. J. Chem. Eng. Data 2005, 50, 369-376. 47. Pevida, C.; Drage, T. C.; Snape, C. E. Carbon 2008, 46, 1464-1474.
48. Álvarez-Gutiérrez, N.; Gil, M.; Martínez, M.; Rubiera, F.; Pevida, C. Energies 2016, 9, 189. 49. Li, K.; Tian, S.; Jiang, J.; Wang, J.; Chen, X.; Yan, F. J. Mater. Chem. A 2016, 4, 5223-5234. 50. Jackson, K. T.; Rabbani, M. G.; Reich, T. E.; El-Kaderi, H. M. Polym. Chem. 2011, 2, 2775-2777. 51. Almansa, C.; Molina-Sabio, M.; Rodríguez-Reinoso, F. Micropor. Mesopor. Mater. 2004, 76, 185-191.
52. Andres, J. M.; Orjales, L.; Narros A.; Fuente, M. M.; Rodrigues, M. E. J. Air Waste Manag. Assoc. 2013, 63, 557-564.
53. Manusamy, K.; Somani, R. S.; Bajaj, H. C. J. Environ. Chem. Eng. 2015, 3, 2750-2759.
54. Wang, J.; Heerwig, A.; Lohe, M. R.; Oschatz, M.; Borchardt, L.; Kaskel, S. J. Mater. Chem. 2018, 22, 13911-13913.
55. Reddy, P. M. K.; Krushnamurty, K. Mahammadunnisa, S. K. Dayamani, A. Subrahmanyam C. Int. J. Environ.
Sci. Technol. 2015, 12, 1363-1372.
56. Alvarez-Gutierrez, N.; García S.; Gil M. V., Rubiera F.; Pevida C. Energy Fuels 2016, 30, 5005-5015. 57. Zhang, Z.; Zhang, W.; Chen, X.; Xia, Q.; Li, Z. Sep. Sci. Technol. 2010, 45, 710-719.
58. Wang, Y. X.; Liu, B. S.; Zheng, C. J. Chem. Eng. Data 2010, 55, 4669-4676.
59. Hao, W.; Björnerbäck, F.; Trushkina, Y.; Oregui-Bengoechea, M.; Salazar-Alvarez, G.; Barth, T.; Hedin, N. ACS
Sustain. Chem. Eng. 2017, 5, 3087-3095.
60. Choma, J.; Stachurska, K.; Marszewski, M.; Jaroniec, M. Adsorption 2016, 22, 581-588. 61. Awadallah, A.; Al-Muhtaseb, S. A. Adsorption 2013, 19, 967-977.
62. Khalili, S.; Khoshandam, B.; Jahanshahi, M. Korean J. Chem. Eng. 2016, 33, 2943-2952. 63. Mofarahi, M.; Gholipour, F. Micropor. Mesopor. Mat. 2014, 200, 1-10.
64. Wei, J.; Zhou, D.; Sun, Z.; Deng, Y.; Xia, Y.; Zhao, D. Adv. Funct. Mater. 2013, 23, 2322-2328.
65. Ning, P.; Li, F. R.; Yi, H. H.; Tang, X. L.; Peng, J. H.; Li, Y. D.; He, D.; Deng, H. Sep. Purif. Technol. 2012, 98, 321-326.
66. Ribeiro, R. P.; Sauer, T. P.; Lopes, F. V.; Moreira, R. F.; Grande, C. A.; Rodrigues, A. E. J. Chem. Eng. Data
2008, 53, 2311-2317.
67. Lopes, F. V. S.; Grande, C. A.; Ribeiro, A. M.; Loureiro, J. M.; Evaggelos, O.; Nikolakis, V.; Rodrigues, A. E.
Sep. Sci. Technol. 2009, 44, 1045-1073.
68. Kemp, K. C.; Baek, S. B.; Lee, W. G.; Meyyappan, M.; Kim, K. S. Nanotechnology 2015, 26, 385602.
69. Boyjoo, Y.; Cheng, Y.; Zhong, H.; Tian, H.; Pan, J.; Pareek, V. K.; Jiang, S. P.; Lamonier, J. F.; Jaroniec, M.; Liu, J. Carbon 2017, 116, 490-499.