Effects of Dietary Different Levels of Nano, Organic and Inorganic
Zinc Sources on Performance, Eggshell Quality, Bone Mechanical
Parameters and Mineral Contents of the Tibia, Liver, Serum and Excreta
in Laying Hens
Yusuf Cufadar1 &Rabia Göçmen1&Gülşah Kanbur1&Bedia Yıldırım1
Received: 7 September 2018 / Accepted: 10 February 2019
# Springer Science+Business Media, LLC, part of Springer Nature 2019
Abstract
This study was conducted to determine the effect of dietary zinc (Zn) sources and their levels on the performance, egg quality, tissue mineral concentrations and bone mechanical traits of laying hens. Two hundred seventy, 44-week-old, Super Nick white laying hens were randomly distributed to 15 experimental groups in a 3 (sources of Zn) × 5 (levels of Zn) factorial arrangement, using groups of 18 birds with 6 replicates. The 15 experimental diets consisted of three sources of Zn (oxide as an inorganic form, zinc-proteinate as an organic form and nano zinc-oxide powder as a nano form) and five different levels of Zn (20, 40, 60, 80 and 100 mg Zn/kg diet). The experiment lasted 12 weeks. Dietary Zn sources, Zn levels and their interactions had no significant effect on the performance parameters between the treatment groups, nor a significant effect on eggshell weight and eggshell breaking strength. Eggshell thickness and eggshell Ca and P contents were significantly affected by the different dietary Zn sources. Dietary Zn sources, Zn levels and their interactions had no significant effect on tibia Ca and P contents, and also had no significant effect on tibia Zn content. Liver Zn content was significantly affected by the dietary Zn sources. Serum Zn content was not affected by the dietary treatments. Dietary Zn sources, Zn levels and their interactions had no significant effect on tibia weight, tibia stress and tibia breaking strength, as tibia mechanical parameters. Excreta Zn content decreased linearly when hens were fed nano Zn compared to organic and inorganic Zn, and excreta Zn content also linearly increased with increasing dietary Zn levels. In conclusion, 20 mg/kg of supplemental Zn is optimal for sustaining performance, good eggshell quality and bone status, while also reducing Zn excretion and soil pollution, with organic (Zn-proteinate) and nano (ZnO) Zn as the preferred forms in laying hen diets.
Keywords Nano zinc . Eggshell . Mineral content . Bone . Laying hens
Introduction
Zinc (Zn) is one of the essential trace minerals that is an important component of over 200 enzyme systems. It also
plays a key role in growth, skeleton development and eggshell formation in poultry. A poor eggshell for commercial eggs causes economic losses for egg producers; it has been estimat-ed that the rate of broken eggs is between 6 and 8% [1]. Previous studies focused on calcium (Ca) and phosphorus (P) as they are important for eggshell structure. Additionally, Zn plays an important role in eggshell formation, which is a cofactor of carbonic anhydrase. This enzyme plays a role in supplying the carbonate ions that are needed during eggshell formation [2]. Therefore, the addition of Zn to laying hen diets improves eggshell quality [3,4]. Some researchers have re-ported that dietary Zn supplementation also had a positive influence on bone biomechanical traits and mineralisation in laying hens [5–9].
In practice, poultry diets are generally supplemented with higher levels of Zn than the recommended amount of 35 mg/kg diet [10] to reduce watery excreta. This results in high levels
* Yusuf Cufadar [email protected] Rabia Göçmen [email protected] Gülşah Kanbur [email protected] Bedia Yıldırım [email protected]
1 Department of Animal Science, Faculty of Agriculture, Selcuk University, 42130 Konya, Turkey
https://doi.org/10.1007/s12011-019-01698-3
of Zn residue in the excreta of chickens, leading to environ-mental pollution. Therefore, enhancing Zn absorption can help to alleviate both of these issues. The bioavailability of Zn in monogastric animals ranges from 6 to 11% [11]. The bioavailability and accumulation of Zn in poultry varies de-pending on many factors, such as its chemical form, the feed intake, age and physiological state of the hens and interactions with other minerals [12,13]. The widely used form of Zn in poultry diets is inorganic Zn sources because of their low cost and commercial preference. The use of organic mineral sources in premixes for poultry diets has been suggested based on the hypothesis that such mineral sources have a higher bioavailability than inorganic mineral sources. This means that mineral sources can be added to the diets at much lower concentrations than inorganic mineral sources, without a neg-ative impact on the performance of poultry. Organic mineral sources, such as forms of proteinate and amino acid, have been used increasingly in recent years due to their higher bioavailability [14] and low amounts of manure [15].
In recent years, the use of nanoparticles as a mineral source in poultry diets has been a new approach, due to its higher availability, stable structure and lower additive dose. Nano mineral sources may enter the intestinal cells through direct penetration; therefore, their bioavailability will be much higher than that of inorganic minerals [16]. It was hypothesised that nano mineral sources were more easily absorbed, compared to their inorganic or organic forms [17]. These can be used at a lower level and can provide better absorption than the conventional Zn sources and, consequent-ly, prevent environmental pollution. Many studies have re-ported encouraging results of nano Zn supplementation in poultry diets. Sahoo et al. [18] found that broiler diet supple-mentation of 15-ppm Zn from an organic source and 0.06-ppm Zn from a nano source were more bioavailable than Zn from inorganic sources and, consequently, improved the broilers’ immunity status. Zhao et al. [19] indicated that the dietary supplementation of 20-mg/kg nano ZnO improved the performance and antioxidative capabilities of broilers, com-pared to diets containing 60-mg/kg ZnO from an inorganic source. Fathi et al. [20] reported that the dietary addition of 20-mg/kg nano ZnO had a positive effect on the growth per-formance of broilers. Zhao et al. [21] suggested that nano ZnO supplementation in laying hen diets had no effect on egg pro-duction, body weight and egg quality after 24 weeks of treat-ment. Olgun et al. [9] showed that nano Zn supplementation in laying hen diets had a negative effect on eggshell thickness and bone mechanical traits. Additionally, these researchers reported that dietary nano Zn is not suggested for feeding laying hens.
There is limited information on the comparison of dietary nano Zn with other Zn sources in laying hens. Therefore, the aim of this study was to determine the effects of different Zn sources and Zn levels on the egg production performance,
eggshell quality, tissue mineral content, bone mechanical traits and mineral excretion of laying hens.
Material and Methods
Animals and Protocol Design
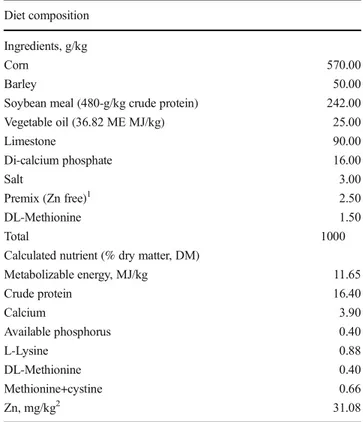
Two hundred seventy 24-week-old H&N Super Nick laying hens were randomly allocated to 15 experimental groups, with 18 hens each and 6 replicates per group. Hens were fed a basal diet, containing 16.4% crude protein, 11.65 ME MJ/kg and 31.80 mg Zn per kg (Table1). The basal diet was formulated to meet or exceed the nutrient requirements of laying hens, as recommended by the NRC [10], except for Zn. The diets consisted of five different levels of Zn (20, 40, 60, 80 and 100 mg Zn/kg added to the basal diet) and three different sources of Zn; these Zn sources were zinc oxide in an inor-ganic form (81% Zn, Tekkim Lab. Chem. Co.), zinc proteinate in an organic form (10% Zn, Availa®Zn100) and zinc oxide powder in a nano form (81% Zn, Ege Nanotek Chemical Co., particle size < 30 nm). A total of 15 experimental diets
Table 1 Composition of experimental diet (as fed on basis) Diet composition
Ingredients, g/kg
Corn 570.00
Barley 50.00
Soybean meal (480-g/kg crude protein) 242.00 Vegetable oil (36.82 ME MJ/kg) 25.00 Limestone 90.00 Di-calcium phosphate 16.00 Salt 3.00 Premix (Zn free)1 2.50 DL-Methionine 1.50 Total 1000
Calculated nutrient (% dry matter, DM)
Metabolizable energy, MJ/kg 11.65 Crude protein 16.40 Calcium 3.90 Available phosphorus 0.40 L-Lysine 0.88 DL-Methionine 0.40 Methionine+cystine 0.66 Zn, mg/kg2 31.08 1
Premix provided the following per kg of diet: retinyl acetate, 4.0 mg; cholecalciferol, 0.055 mg; DL-α-tocopheryl acetate, 11 mg; nicotinic acid, 44 mg; calcium-D-pantothenate, 8.8 mg; riboflavin sodium phos-phate, 5.8 mg; thiamine hydrochloride, 2.8 mg; cyanocobalamin, 0.66 mg; folic acid, 1 mg; biotin, 0.11 mg; choline, 220 mg; Mn, 60 mg; Fe, 30 mg; Cu, 5 mg; I, 1.1 mg; Se, 0.1 mg
2
consisting of three different Zn sources and five different Zn levels were tested in a 3 × 5 factorial design for 12 weeks. The hens were housed in an environmentally controlled room equipped with 90 metal battery cages. Hens were kept in cages (50 cm long, 50 cm wide, 45 cm high) with three hens per cage. Feed and water were offered ad libitum throughout the experiment. The lighting program was 16 h light:8 h dark per day throughout the experimental period.
Performance Analysis
The body weight of the hens was determined by weighing the hens individually at the beginning and end of the experiment. Egg production (EP) was recorded daily. Feed intake (FI) was calculated as the mean for the subgroup for the 12-week trial period (FI = total feed given− feed remaining in the manger). Egg mass (EM) was calculated from the EP and egg weight (EW) data using the formula: EM = (EP % × EW)/period (days). The feed conversion ratio (FCR) was calculated using the formula: FCR = FI/EM.
Egg Quality Parameters Determination
The eggs were examined to determine the EW and eggshell quality characteristics (shell breaking strength, shell weight and shell thickness); this was done for the collected eggs pro-duced at the end of each period for three consecutive days. Eggshell breaking strength was measured using a cantilever system by applying increasing pressure to the broad pole of the shell using an Egg Force Reader (Orka Food Technology Ltd., Ramat Hasharon, Israel). The eggs were then broken, and the eggshell, albumen and yolk were separated and weighed. Eggshells were weighed using a 0.01-g precision scale. Eggshell weight was calculated using the formula: egg-shell weight (%) = (eggegg-shell weight (g)/EW (g))/100. Eggegg-shell thickness (including the membrane) was determined at three points on the eggs (one point on the air cell and two randomised points on the equator) using a micrometre (Mitutoyo Inc., Kawasaki, Japan).
Sample Collection
At the end of the experiment, six hens per treatment (one hen per replicate) were randomly selected, slaughtered and evis-cerated and the hens’ tibia bones and liver were collected. Bones were excised from all flesh, and proximal cartilages were removed. While the left tibias were used for the deter-mination of mineral contents, the right tibias were used for measuring the bone mechanical properties. The tibia and liver samples were placed in a plastic bag and stored at− 20 °C until analysis. At the end of the experiment, 5 mL of blood was drawn from the brachial vein of six hens per treatment, into tubes. The serum was obtained by centrifugation of the
blood at 700×g for 5 min. Excreta were collected at 5 and 10 weeks (the average mineral contents of these two samples are given in Table6) of the experiment at 24 h, from a dropping belt under the cages. The liver, serum and excreta samples were frozen at− 20 °C until mineral analysis.
Bone Mechanical Traits
The tibias were thawed at room temperature for 6 h in an air-conditioned room prior to the measurements. The tibia me-chanical properties were determined from a load-deformation curve generated from a three-point bending test [22] using an Instron Universal Testing Instrument (Model 1122; Instron, Canton, USA) and the Test Works 4 software package (ver-sion 4.02; MTS System Corporation, Eden Prairie, USA). The crosshead speed was constant at 5 mm per min. The full-scale load of the load cell was 5.000 N. These bone mechanical properties were described by Wilson and Ruszler [23] and Armstrong et al. [24].
Tissue Mineral Content Determination
The tibia, eggshell, liver and excreta (faeces and urine) sam-ples were oven dried at 100 °C for 24 h and then finely ground for mineral analysis, as described above. The mineral concen-trations of these samples were determined using MarsXpress Technology Inside and an inductively coupled plasma atomic emission spectrometer (Vista AX CCD Simultaneous ICP-AES, Varian, Mulgrave, Australia). Approximately 200 mg of dried sample was introduced into a burning cup and 5 mL nitric acid, 3 mL perchloric acid and 2 mL hydrogen peroxide were added. The sample was incinerated in a MARS 5 Microwave Oven (CEM, Corp., Mathews, NC, USA) at 190 °C and 1.207 kPa pressure, and subsequently diluted to 25 mL with distilled water. The mineral concentrations were determined using an ICP-AES [25].
Statistical Analysis
Data were subjected to an ANOVA using the General Linear Model (GLM) procedure in SPSS [26]. Duncan’s multiple range tests were applied to separate means. Additionally, lin-ear and quadratic effects for the response to Zn sources and levels were performed using orthogonal contrasts. Statements of statistical significance were based on a probability of P < 0.01 and P < 0.05. Data are presented as means and the standard errors of the means.
Results
The performance parameters are presented in Table2. Dietary Zn sources and Zn levels as main factors and their interactions
had no significant effects on egg production, feed intake, feed conversion ratio, egg weight and egg mass between the treat-ment groups (P > 0.05). However, body weight change de-creased linearly with inde-creased dietary levels of Zn (P < 0.05). The eggshell quality parameters and eggshell mineral con-tents are presented in Table3. Dietary Zn sources, Zn levels and their interactions had no significant effects on eggshell weight (P > 0.05). Eggshell thickness and eggshell Ca and P contents were significantly affected by the dietary different Zn sources (P < 0.05). However, eggshell breaking strength was not affected by dietary Zn levels, nor by the sources or the interactions. Eggshell breaking strength decreased linearly with increased dietary levels of Zn (P < 0.05); however, it
was not affected by the different Zn sources or the interac-tions. Eggshell Ca content was significantly decreased in hens fed nano Zn compared to the organic Zn group, but there were no differences in the inorganic Zn group (P < 0.05). Eggshell Ca content was not affected by dietary Zn levels or the inter-actions. Eggshell P content was lower in the nano Zn group than in the other groups. Additionally, eggshell P content de-creased linearly with the inde-creased dietary levels of Zn (P < 0.05). Eggshell P content was not affected by the inter-action between groups.
The tibia, liver and serum mineral contents are presented in Table4. Dietary Zn sources, Zn levels and their interactions had significant effects on the tibia Ca and P contents
Table 2 Effect of different Zn sources and levels on performance in laying hens Body weight
change, g
Egg production,% Feed intake, g/d/hen
Feed conversion ratio, g feed/g egg
Egg weight, g Egg mass, g/d/hen
Zn sources Ing Zn 108 ± 8.9 98.2 ± 0.30 120.6 ± 0.80 1.96 ± 0.01 62.7 ± 0.27 61.6 ± 0.35 Org Zn 79 ± 12.5 98.0 ± 0.28 121.0 ± 0.58 1.97 ± 0.01 62.7 ± 0.28 61.4 ± 0.33 Nano Zn 109 ± 9.8 97.6 ± 0.42 120.9 ± 0.81 1.97 ± 0.02 62.9 ± 0.30 61.4 ± 0.43 Levels (mg/kg) 20 119 ± 13.7 97.8 ± 0.52 120.7 ± 1.19 1.99 ± 0.03 62.3 ± 0.42 60.9 ± 0.56 40 112 ± 10.3 98.1 ± 0.40 121.4 ± 0.92 1.98 ± 0.02 62.7 ± 0.36 61.5 ± 0.47 60 103 ± 16.0 97.7 ± 0.48 120.7 ± 0.86 1.95 ± 0.02 63.2 ± 0.33 61.8 ± 0.45 80 77 ± 8.3 97.9 ± 0.45 121.1 ± 0.85 1.99 ± 0.02 62.3 ± 0.35 61.0 ± 0.44 100 83 ± 17.3 98.2 ± 0.34 120.2 ± 0.94 1.94 ± 0.02 63.2 ± 0.33 62.1 ± 0.43 Sources * levels Ing Zn 20 130 ± 28.5 98.1 ± 0.30 119.8 ± 2.82 1.95 ± 0.04 62.6 ± 0.30 61.4 ± 0.34 40 135 ± 22.3 97.9 ± 0.70 120.9 ± 1.76 1.95 ± 0.02 63.5 ± 0.80 62.2 ± 0.94 60 115 ± 5.9 98.5 ± 0.95 118.4 ± 1.70 1.91 ± 0.03 63.0 ± 0.69 62.1 ± 0.94 80 93 ± 13.6 98.4 ± 0.50 123.5 ± 0.95 2.03 ± 0.03 61.8 ± 0.68 60.8 ± 0.91 100 69 ± 11.6 98.3 ± 0.87 120.5 ± 0.93 1.95 ± 0.02 62.8 ± 0.44 61.8 ± 0.79 Org Zn 20 92 ± 18.6 98.4 ± 0.25 120.3 ± 0.88 1.98 ± 0.02 61.6 ± 0.82 60.6 ± 0.71 40 104 ± 10.7 98.5 ± 0.41 121.6 ± 0.92 1.98 ± 0.03 62.4 ± 0.50 61.5 ± 0.69 60 75 ± 43.3 97.8 ± 0.45 122.3 ± 1.28 1.98 ± 0.03 63.1 ± 0.45 61.8 ± 0.70 80 73 ± 12.2 97.1 ± 1.21 121.4 ± 1.05 2.00 ± 0.04 62.6 ± 0.24 60.8 ± 0.77 100 53 ± 41.9 98.3 ± 0.36 119.5 ± 2.06 1.92 ± 0.03 63.5 ± 0.79 62.5 ± 0.78 Nano Zn 20 134 ± 23.3 96.8 ± 1.50 122.1 ± 2.25 2.02 ± 0.06 62.7 ± 0.97 60.7 ± 1.60 40 97 ± 17.6 97.8 ± 0.96 121.8 ± 2.14 2.01 ± 0.04 62.2 ± 0.47 60.8 ± 0.86 60 120 ± 21.7 96.9 ± 1.02 121.3 ± 1.14 1.97 ± 0.04 63.6 ± 0.62 61.6 ± 0.84 80 66 ± 17.0 98.3 ± 0.33 118.5 ± 1.67 1.92 ± 0.03 62.6 ± 0.78 61.6 ± 0.68 100 128 ± 23.0 98.1 ± 0.54 120.7 ± 1.95 1.95 ± 0.04 63.2 ± 0.51 62.0 ± 0.78 Probabilities, P < Sources 0.079 0.403 0.929 0.751 0.107 0.887 Levels 0.131 0.930 0.923 0.368 0.308 0.437 Linear 0.014 0.598 0.672 0.187 0.236 0.236 Quadratic 0.897 0.733 0.584 0.756 0.662 0.895 Sources * levels 0.538 0.605 0.355 0.223 0.617 0.956
(P < 0.05), but no significant effects on the tibia Zn content. Tibia Ca and P contents decreased linearly with the dietary inorganic, organic and nano Zn sources, respectively (P < 0.01). Tibia Ca and P contents decreased linearly with the increase in dietary Zn levels (P < 0.01). In the interaction groups, tibia Ca and P contents were higher in the inorganic Zn * 80 mg/kg group, compared to the other groups. The liver Zn content was significantly affected by the dietary Zn sources (P < 0.05), but it was not affected by the dietary Zn levels or the source*level interactions (P > 0.05). The liver Zn content was significantly increased in hens fed nano Zn compared to those fed inorganic and organic Zn (P < 0.05), but it was not significantly affected by the dietary Zn sources or the
interaction between source and level. Serum Zn content was not affected by the dietary treatments.
The tibia mechanical parameters are presented in Table5. Dietary Zn sources, Zn levels and their interactions had no significant effects on tibia weight, tibia stress or tibia breaking strength (P > 0.05).
The excreta mineral contents are presented in Table6. The dietary Zn sources had no significant effect on the excreta Ca content. Excreta Ca content decreased linearly with the in-crease of dietary Zn levels (P < 0.05). As for the effects of the interaction between Zn source and level, excreta Ca con-tent was higher in the inorganic Zn * 20 mg/kg group, com-pared to rgw other groups, except for those who were fed a
Table 3 Effect of different Zn sources and levels on eggshell quality parameters in laying hens
Eggshell weight, g Eggshell thickness,μm Eggshell breaking strength, kg Eggshell Ca, g/kg Eggshell P, mg/kg Zn sources Ing Zn 6.24 ± 0.03 392 ± 1.53a 4.68 ± 0.03 368 ± 1.76ab 959 ± 10.3a Org Zn 6.21 ± 0.03 386 ± 1.75b 4.69 ± 0.04 370 ± 1.59a 954 ± 12.1a Nano Zn 6.27 ± 0.03 384 ± 1.77b 4.62 ± 0.04 363 ± 1.43b 916 ± 12.2b Levels (mg/kg) 20 6.22 ± 0.03 388 ± 1.72 4.75 ± 0.03 364 ± 2.23 965 ± 15.3 40 6.25 ± 0.03 388 ± 2.10 4.69 ± 0.05 370 ± 2.10 959 ± 17.8 60 6.28 ± 0.05 388 ± 2.78 4.63 ± 0.05 368 ± 2.07 924 ± 10.8 80 6.20 ± 0.05 387 ± 2.52 4.66 ± 0.05 365 ± 2.47 935 ± 18.4 100 6.24 ± 0.05 385 ± 2.38 4.59 ± 0.05 366 ± 1.82 931 ± 12.8 Sources * levels Ing Zn 20 6.23 ± 0.03 393 ± 2.53 4.69 ± 0.06 361 ± 5.09 952 ± 12.2 40 6.31 ± 0.07 392 ± 3.18 4.76 ± 0.04 372 ± 1.56 998 ± 22.9 60 6.32 ± 0.07 396 ± 3.88 4.71 ± 0.09 371 ± 1.42 901 ± 21.0 80 6.11 ± 0.08 387 ± 3.51 4.59 ± 0.07 363 ± 6.07 976 ± 25.6 100 6.24 ± 0.06 391 ± 3.88 4.67 ± 0.06 371 ± 1.25 970 ± 14.8 Org Zn 20 6.17 ± 0.05 386 ± 2.45 4.84 ± 0.05 371 ± 2.10 977 ± 39.9 40 6.26 ± 0.06 391 ± 3.67 4.74 ± 0.08 376 ± 2.56 974 ± 26.5 60 6.20 ± 0.06 385 ± 4.04 4.62 ± 0.09 365 ± 5.35 931 ± 19.8 80 6.19 ± 0.08 386 ± 4.74 4.70 ± 0.10 370 ± 3.42 938 ± 27.9 100 6.21 ± 0.12 383 ± 4.90 4.58 ± 0.15 366 ± 2.83 929 ± 18.6 Nano Zn 20 6.28 ± 0.06 386 ± 3.31 4.72 ± 0.03 361 ± 2.56 966 ± 23.2 40 6.20 ± 0.04 381 ± 2.04 4.57 ± 0.10 362 ± 3.98 905 ± 33.2 60 6.31 ± 0.12 384 ± 5.47 4.60 ± 0.10 368 ± 3.20 941 ± 13.6 80 6.30 ± 0.11 387 ± 5.47 4.70 ± 0.10 362 ± 2.59 872 ± 28.2 100 6.26 ± 0.05 381 ± 3.02 4.53 ± 0.05 362 ± 3.95 895 ± 23.5 Probabilities, P < Sources 0.432 0.006 0.350 0.010 0.012 Levels 0.786 0.796 0.202 0.308 0.178 Linear 0.850 0.274 0.025 0.895 0.044 Quadratic 0.628 0.541 0.793 0.243 0.352 Sources * levels 0.762 0.676 0.586 0.170 0.071 a, b
Within a column, values not sharing a common superscript are statistically different; P < 0.05. Ing Zn, inorganic zinc oxide; Org Zn, organic zinc proteinate; Nano Zn, nanoparticle zinc oxide
diet containing 40 mg/kg of nano Zn (P < 0.05). However, excreta Ca content was lower in the nano Zn * 100 mg/kg group, compared to the other groups. Excreta P content was influenced by dietary Zn levels (P < 0.05), but not significant-ly affected by the dietary Zn source or the source*level inter-action. Excreta P content decreased linearly with the increase of dietary Zn levels (P < 0.01). Dietary Zn sources, levels and their interactions had significant effects on the excreta Zn content (P < 0.01). The lowest excreta Zn content was ob-served in the nano Zn group (P < 0.01). This result demon-strated that the hens fed the diet containing nano Zn had a lower Zn excretion than those fed organic and inorganic Zn sources. The excreta Zn content increased linearly with
increasing dietary Zn levels (P < 0.01). Among the interaction groups, the highest excreta Zn content was observed in the 100-mg/kg inorganic Zn group (P < 0.01). Additionally, the excreta Zn content was lower in the 20-mg/kg organic Zn and 20-mg/kg nano Zn groups, compared to the other groups (P < 0.01).
Discussion
The present study showed that the dietary Zn sources, Zn levels and their interactions had no effects on the performance parameters of laying hens (P > 0.05). The results agree with
Table 4 Effect of different Zn sources and levels on tibia, liver and serum mineral contents in laying hens
Tibia Liver Zn, mg/kg Serum Zn, mg/L
Ca, g/kg P, g/kg Zn, mg/kg Zn sources Ing Zn 290 ± 1.16a 113.9 ± 0.63a 120.2 ± 0.94 105.9 ± 2.80b 3.20 ± 0.17 Org Zn 279 ± 1.42b 103.1 ± 0.73b 121.1 ± 1.10 108.5 ± 2.21b 3.08 ± 0.12 Nano Zn 265 ± 1.09c 95.9 ± 0.51c 119.2 ± 1.11 115.5 ± 1.35a 3.46 ± 0.11 Levels (mg/kg) 20 282 ± 2.62a 105.8 ± 1.64a 119.9 ± 0.92 109.0 ± 3.22 3.24 ± 0.19 40 279 ± 2.39ab 104.2 ± 1.49ab 117.3 ± 1.08 109.6 ± 3.46 3.06 ± 0.18 60 277 ± 2.36bc 103.5 ± 1.44abc 120.4 ± 1.10 109.3 ± 3.21 3.17 ± 0.13 80 277 ± 3.44bc 103.0 ± 2.15bc 122.2 ± 1.39 110.1 ± 2.76 3.23 ± 0.22 100 275 ± 3.19c 101.5 ± 1.91c 121.0 ± 1.92 111.8 ± 2.39 3.45 ± 0.19 Sources * levels Ing Zn 20 288 ± 2.56ab 111.8 ± 1.73ab 120.4 ± 1.52 105.5 ± 5.34 3.00 ± 0.39 40 289 ± 1.87ab 111.0 ± 0.78ab 117.8 ± 2.15 103.5 ± 8.49 2.58 ± 0.20 60 286 ± 1.14abc 110.6 ± 0.74ab 118.5 ± 1.20 105.7 ± 6.98 3.26 ± 0.19 80 293 ± 2.88a 114.2 ± 1.58a 123.3 ± 1.84 107.4 ± 7.21 3.43 ± 0.19 100 292 ± 2.62a 111.8 ± 1.83ab 120.7 ± 3.17 107.5 ± 4.84 3.71 ± 0.61 Org Zn 20 288 ± 2.49ab 108.0 ± 1.08bc 121.7 ± 0.73 105.8 ± 6.54 3.12 ± 0.35 40 282 ± 1.83bcd 104.9 ± 1.07cd 118.6 ± 1.93 112.6 ± 4.63 3.24 ± 0.17 60 279 ± 1.40cd 103.3 ± 0.64d 122.1 ± 2.75 107.3 ± 6.47 3.09 ± 0.35 80 276 ± 1.39de 101.4 ± 0.69de 125.4 ± 1.75 107.8 ± 3.77 2.58 ± 0.21 100 269 ± 1.79ef 97.7 ± 0.65ef 117.7 ± 3.56 108.9 ± 4.08 3.36 ± 0.12 Nano Zn 20 269 ± 2.62ef 97.7 ± 1.49ef 117.4 ± 1.97 115.8 ± 4.55 3.59 ± 0.22 40 268 ± 2.13f 96.9 ± 0.94f 115.4 ± 1.57 112.7 ± 4.20 3.37 ± 0.36 60 264 ± 1.92f 96.8 ± 0.95f 120.6 ± 1.42 114.8 ± 2.18 3.16 ± 0.15 80 261 ± 1.71f 93.4 ± 0.61f 118.0 ± 2.73 115.2 ± 1.93 3.88 ± 0.26 100 263 ± 1.46f 94.9 ± 0.90f 124.5 ± 3.18 119.1 ± 1.39 3.29 ± 0.06 Probabilities, P < Sources < 0.0001 < 0.0001 0.409 0.014 0.118 Levels < 0.0001 < 0.0001 0.104 0.968 0.553 Linear < 0.0001 < 0.0001 0.084 0.522 0.217 Quadratic 0.432 0.920 0.763 0.741 0.281 Sources * levels < 0.0001 < 0.0001 0.135 0.990 0.121 a–f:Within a column, values not sharing a common superscript are statistically different; P < 0.05 Ing Zn, inorganic zinc oxide; Org Zn, organic zinc proteinate; Nano Zn, nanoparticle zinc oxide
the findings of Tabatabaie et al. [27], who found that Zn sources (inorganic and organic) or levels (25 and 50 mg/kg) did not affect the egg production, egg weight or feed conver-sion ratio of laying hens; however, feed intake was lower in the hens fed 50 mg/kg of organic Zn, compared to the other groups. Tsai et al. [28] noted that the feed intake, egg produc-tion, egg weight and egg mass of laying hens were not influ-enced by the different Zn sources (inorganic, organic and nano Zn). Mohammadi et al. [29] stated that body weight and feed intake of broilers decreased with dietary nano Zn (80 mg/kg, as ZnSO4) supplementation compared to the supplementation of Zn-methionine (80 mg/kg Zn); however, the feed conver-sion ratio was not influenced by the dietary treatments. Mao and Lien [30] reported that the egg production, egg mass, feed conversion ratio and egg weight of laying hens were not
affected by the difference between inorganic, organic and nano Zn sources (80 mg/kg of Zn was added for all Zn sources). Olgun et al. [9] observed that body weight change and egg production in laying hens were not different between nano Zn and inorganic or organic Zn sources; on the contrary, the egg weight and feed conversion ratio were improved by the dietary supplementation with ZnSO4, compared to with ZnO and Zn-proteinate. Additionally, the egg mass increased with ZnSO4supplementation, in comparison to Zn-proteinate. Zinc is an important component of the eggshell. Broken eggs constitute a large financial loss to the poultry industry, so it is necessary that producers understand how supplemental minerals, such as zinc, can help reduce the incidence of break-age. The present study showed that dietary Zn sources, Zn levels and their interactions had no significant effects on
Table 5 Effect of different Zn sources and levels on tibia mechanical parameters in laying hens
Tibia weight, g Tibia stress, N/mm2 Tibia breaking strength, N Zn sources Ing Zn 8.8 ± 0.13 47.78 ± 0.99 683.6 ± 11.30 Org Zn 8.7 ± 0.11 48.35 ± 0.89 677.8 ± 12.92 Nano Zn 8.6 ± 0.10 50.27 ± 0.85 696.3 ± 10.99 Levels (mg/kg) 20 8.7 ± 0.16 48.37 ± 1.32 681.5 ± 15.09 40 8.7 ± 0.15 49.08 ± 1.15 676.0 ± 13.49 60 8.5 ± 0.12 48.16 ± 1.58 687.8 ± 18.34 80 8.6 ± 0.17 49.01 ± 1.07 688.2 ± 13.64 100 9.0 ± 0.14 49.41 ± 0.78 696.2 ± 15.89 Sources * levels Ing Zn 20 8.9 ± 0.30 49.55 ± 2.19 680.1 ± 29.30 40 8.7 ± 0.26 47.73 ± 2.38 668.0 ± 30.23 60 8.4 ± 0.31 46.15 ± 3.25 686.1 ± 21.10 80 8.9 ± 0.33 47.44 ± 2.23 674.8 ± 30.76 100 9.1 ± 0.28 48.06 ± 1.21 709.0 ± 18.42 Org Zn 20 8.5 ± 0.33 45.96 ± 2.03 668.7 ± 32.60 40 9.0 ± 0.25 48.53 ± 2.09 657.6 ± 11.95 60 8.4 ± 0.19 48.84 ± 2.91 682.9 ± 38.73 80 8.6 ± 0.27 48.90 ± 1.63 689.3 ± 19.42 100 9.0 ± 0.16 49.55 ± 1.29 690.7 ± 39.90 Nano Zn 20 8.7 ± 0.21 49.59 ± 2.70 695.6 ± 18.11 40 8.5 ± 0.25 50.97 ± 1.53 702.3 ± 24.09 60 8.6 ± 0.11 49.49 ± 2.29 694.3 ± 38.36 80 8.3 ± 0.25 50.70 ± 1.76 700.6 ± 22.55 100 8.8 ± 0.29 50.61 ± 1.64 688.7 ± 24.36 Probabilities, P < Sources 0.458 0.167 0.566 Levels 0.221 0.950 0.924 Linear 0.355 0.609 0.416 Quadratic 0.770 0.805 0.798 Sources * levels 0.683 0.951 0.991
eggshell weight and eggshell breaking strength. The eggshell thickness was significantly increased with the feeding of inor-ganic Zn, compared to the orinor-ganic and nano Zn sources (P < 0.01). Eggshell Ca content was significantly decreased in the hens fed nano Zn compared to those fed organic Zn, but no differences were noted in the inorganic Zn group (P < 0.01). Eggshell P content decreased significantly with nano Zn, compared to the other sources (P < 0.05). Similar results were reported for the eggshell weight and eggshell breaking strength, which were not significantly affected by the Zn sources, levels or their interactions, but eggshell
thickness was dramatically reduced when birds were supple-mented with nano Zn, in comparison to ZnSO4 supplementa-tion [12]. Tsai et al. [28] also noted that eggshell weight and eggshell breaking strength were not affected by the different Zn sources; however, eggshell thickness was improved with organic Zn and nano Zn supplementation. Zhao et al. [21] found that, compared to ZnSO4(200 mg/kg), nano ZnO (200 mg/kg) decreased eggshell weight; the eggshell breaking strength and shell thickness were not changed by the ZnSO4 or nano ZnO treatments. Mao and Lien [30] showed effects of the different Zn sources on the quality of eggs produced by older layers. In the results of the current study, there were no significant differences in eggshell thickness and eggshell strength among the inorganic, organic and nano Zn groups; however, the eggshell weight in the nano ZnO group was higher than in the ZnO group. The findings of the present study are supported by the findings of Mabe et al. [31], who reported that dietary Zn supplementation had no effect on the eggshell percentage in laying hens. Tabatabaie et al. [27] and Idowu et al. [6] also stated that the addition of different sources of Zn did not affect eggshell thickness for laying hens. However, Bahakaim et al. [4] found that eggshell thickness improved as a result of using organic Zn in the diet for laying hens.
Increased Zn intake is correlated with increased uptake, but it is not known whether greater uptake results in greater amounts of Zn being stored in the tissues or pools from which the body can pull from during times of Zn deficiency [32]. The results of the present study demonstrate that tibia Ca and P contents decreased linearly with the dietary inorganic, organic and nano Zn sources, respectively. Tibia Ca and P contents decreased depending on the increase of dietary Zn levels. Additionally, the tibia Zn content was not significantly affect-ed by the treatments (Table4). Idowu et al. [6] found that the tibia Zn content of laying hens was not significantly influ-enced by the supplementation (140 mg Zn/kg) with organic vs. inorganic Zn. However, Ao et al. [33] and Rossi et al. [34] reported that the dietary supplementation of Zn from organic or inorganic sources increased the tibia Zn content in broilers. Similarly, Mohanna et al. [35] and Sunder et al. [5] noted that the tibia Zn content of broilers increased linearly with in-creases from 10 to 320 mg/kg of dietary Zn. The results of the present study show that the interactions between the sources and levels of Zn had a significant effect on the tibia Ca and P contents. The tibia Ca and P contents decreased linearly in hens fed Zn-proteinate, depending on the increas-ing dietary Zn levels (Table4). Sahoo et al. [18] reported that broilers’ tibia Ca content was not affected by the dietary Zn sources (organic, inorganic or nano) or levels. Olgun et al. [9] reported that the interactions between dietary Zn sources and levels influenced the Ca content of the tibia. Tibia Ca content was higher in the group given 50-mg/kg ZnO, compared to the other groups. The different Zn sources and levels had no
Table 6 Effect of different Zn sources and levels on excreta mineral contents in laying hens
Excreta Ca, g/kg Excreta P, g/kg Excreta Zn, mg/kg Zn sources Ing Zn 61.0 ± 1.58 10.4 ± 0.29 211.0 ± 10.71a Org Zn 60.5 ± 1.25 9.8 ± 0.22 197.5 ± 10.89b Nano Zn 57.5 ± 1.71 10.5 ± 0.36 187.9 ± 11.18c Levels (mg/kg) 20 65.0 ± 1.89a 11.1 ± 0.47a 115.9 ± 2.55e 40 59.3 ± 1.87b 9.9 ± 0.32b 159.7 ± 4.78d 60 60.0 ± 1.19b 10.6 ± 0.32ab 204.9 ± 3.10c 80 56.7 ± 2.01b 10.0 ± 0.35b 239.5 ± 4.29b 100 57.3 ± 2.36b 9.5 ± 0.37b 273.7 ± 5.43a Sources * levels Ing Zn 20 71.6 ± 3.79a 11.2 ± 0.96 131.3 ± 2.40h 40 59.4 ± 2.95bcd 10.7 ± 0.59 181.6 ± 5.00f 60 60.1 ± 2.01bcd 10.8 ± 0.65 202.0 ± 4.73ef 80 55.4 ± 1.29bcd 9.3 ± 0.29 244.4 ± 7.03bc 100 58.7 ± 3.71bcd 10.1 ± 0.49 295.6 ± 2.25a Org Zn 20 61.4 ± 1.91bc 10.1 ± 0.37 107.7 ± 1.62ı 40 54.8 ± 2.67bcd 9.2 ± 0.43 157.9 ± 2.36g 60 62.0 ± 2.04bc 10.3 ± 0.46 213.2 ± 3.53de 80 61.8 ± 3.48bc 10.4 ± 0.59 244.5 ± 9.12bc 100 62.3 ± 3.18bc 8.9 ± 0.32 264.2 ± 5.24b Nano Zn 20 62.0 ± 2.32bc 12.0 ± 0.94 108.6 ± 2.31ı 40 63.8 ± 3.47ab 9.9 ± 0.54 139.8 ± 5.12gh 60 58.0 ± 2.12bcd 10.7 ± 0.64 199.6 ± 6.40ef 80 53.0 ± 4.39cd 10.4 ± 0.80 229.8 ± 5.12cd 100 51.0 ± 4.40d 9.5 ± 0.95 261.5 ± 12.26b Probabilities, P < Sources 0.161 0.167 < 0.0001 Levels 0.013 0.028 < 0.0001 Linear 0.002 0.009 < 0.0001 Quadratic 0.204 0.933 0.027 Sources * levels 0.017 0.483 0.003
a–ıWithin a column, values not sharing a common superscript are statis-tically different; P < 0.05
Ing Zn, inorganic zinc oxide; Org Zn, organic zinc proteinate; Nano Zn, nanoparticle zinc oxide
effects on the tibia P content. Tibia Zn content was influenced by the dietary Zn levels; in the group with 100 mg/kg Zn, the tibia Zn content was higher than in hens from the groups fed 25 and 50 mg/kg Zn. In another study, Idowu et al. [6] found that the tibia Ca content was higher in the organic Zn group than in the inorganic Zn group of laying hens. These re-searchers reported that the tibia Zn content was significantly higher in the supplemented Zn groups than the control group, but that there were no significant differences between the in-organic (ZnO, ZnSO4, ZnCO3) and in-organic (Zn-proteinate) Zn sources. Midilli et al. [36] stated that tibia Zn content was higher in the group supplemented with 100 mg/kg Zn.
The present study results showed that the liver Zn content was significantly affected by the dietary Zn sources (P < 0.05). The liver Zn content increased significantly in the nano Zn group compared to the inorganic and organic Zn groups. Serum Zn content was not affected by the dietary treatments (Table4). Zhao et al. [21] found that the concentration of Zn was elevated as the levels of ZnSO4and ZnO-Nano increased in the liver; however, the concentration of Zn was higher in the ZnO-Nano treatments than in the same concentration of ZnSO4treatments. The liver concentration of Zn was highest in the ZnO-Nano (200 mg/kg) treatment, but the liver concen-trations of Zn in the 200 mg/kg ZnSO4and 100 mg/kg ZnO-Nano groups were similar. However, Mao and Lien [30] re-ported that the serum Zn concentration was higher in the nano ZnO group than in the ZnO group, implying that nano ZnO increased Zn absorption. Idowu et al. [6] reported that the ZnSO4and Zn-proteinate groups were statistically similar in terms of their serum Zn content.
In the case of dietary Zn deficiency, due to the role of Zn in protein synthesis, bone density decreases and the compact structure deteriorates [37]. The present study results showed that dietary Zn sources, Zn levels and their interactions had no significant effects on tibia weight, tibia stress and tibia break-ing strength, as tibia mechanical parameters (P > 0.05; Table5). This result is similar to that of Olgun et al. [9], who reported that different Zn sources did not significantly affect laying hen bone stress, but that the shear force was increased with ZnSO4 supplementation compared to Zn-glycine and nano-ZnO supplementation. In addition, the shear force of the tibia was significantly affected by the dietary Zn levels, which was higher in the group supplemented with 75-mg/kg Zn than in the other groups. Sahraei et al. [8] reported that the wall thickness and tibiotarsal index were significantly higher in the group that received inorganic Zn compared to the group that received organic Zn. The lowest shear force was observed in the group fed nano ZnO. The researchers also reported that the tibia bone mechanical properties were better in the group that received 150-mg/kg ZnO than in the group that received 100- and 200-mg/kg ZnO. On the contrary, Swiatkiewicz et al. [38] noted that the tibia biomechanical properties were not significantly affected by the addition of
30-mg/kg Zn to the diet of laying hens. Midilli et al. [36] showed that there was no difference in the bone breaking stress between 75-mg/kg organic and inorganic Zn groups.
The major problems of excessive Zn in the manure is due to the high level of Zn added to poultry diets. As poultry manure is mostly used as fertiliser, increased levels of certain trace minerals, such as zinc, can be a concern. The present study results showed that the excreta Ca and P content decreased with the increase in dietary Zn levels, but the excreta Zn level increased. Significant differences in excreta Zn content were found between the dietary Zn sources and levels. The lowest Zn excretion was in the 20-mg/kg Zn group, whereas the highest Zn excretion was in the 100-mg/kg Zn group. In ad-dition, the lowest Zn excretion was observed in the nano Zn (Table6) group. Tsai et al. [28] reported that Zn excretion in the nano Zn and organic Zn groups was lower than of the ZnO group. This result indicates that nano ZnO can enhance zinc retention in laying hens. On the other hand, Idowu et al. [6] reported that excreta Zn content significantly decreased in the inorganic Zn group, compared to the organic Zn group. According to these results, lower Zn excretion may suggest that nano Zn sources have higher availability than other Zn sources. High concentrations of Zn in poultry excreta due to their lower bioavailability can cause environmental pollution and soil phytotoxicity.
Conclusion
In conclusion, different dietary supplementation levels or the substitution of inorganic Zn with Zn from organic of nano sources had no significant effects on the performance parameters, eggshell breaking strength and tibia mechani-cal properties of laying hens. However, the dietary supple-mentation of nano ZnO can decrease Zn excretion and en-hance Zn absorption in the intestine; thus, the supplemen-tation of nano Zn has positive effects, compared to organic and inorganic ZnO. The present study findings indicate that nano Zn can be used as effectively as traditional Zn sources (inorganic and organic) to ensure optimum performance and egg quality in laying hens. Moreover, based on the results of this trial, we propose that diets supplemented with 20-mg Zn/kg nano Zn (ZnO) or organic Zn (Zn-proteinate) are practical for laying hen nutrition. Additionally, the or-ganic and nano forms of Zn should be preferred in laying hen diets due to the reduction in Zn excretion and soil pol-lution. Therefore, nanotechnology can be used in trace min-eral supplements and may serve as a suitable source to re-place minerals in laying hen diets.
Funding Information This study was supported by the Scientific and Technological Research Council of Turkey (TÜBİTAK), Project Number 115O938.
Compliance with Ethical Standards
All procedures performed in studies involving animals were in accor-dance with the ethical standards of the institution or practice at which the studies were conducted. All procedures applied on animals in this study were approved by Ethics Committee of Selçuk University (Number of approvals: 2015-004).
Conflict of Interest The authors declare that they have no conflict of interest.
References
1. Bain MM (1997) A reinterpretation of eggshell strength. In: Solomon SE (ed) Egg and eggshell quality. London, Manson Publishing, pp 131–142
2. Nys Y, Hincke MT, Arias JL, Garcia-Ruiz JM, Solomon SE (1999) Avian eggshell mineralization. Avian Poult Biol Rev 10:143–166 3. Zamani A, Rahmani HR, Pourreza J (2005) Effect of different
levels of manganese and zinc on performance traits and breaking eggs in laying hens. Pak J Biol Sci 8:1035–1040
4. Bahakaim ASA, Magied HAA, Osman SMH, Omar AS, Abdelmalak NY, Ramadan NA (2014) Effect of using different levels and sources of zinc in layer’s diets on egg zinc enrichment. Egypt Poult Sci 34:39–56
5. Sunder GS, Panda AK, Gopinath NCS, Rao SR, Raju MVLN, Reddy MR, Kumar CV (2008) Effects of higher levels of zinc supplementation on performance, mineral availability, and immune competence in broiler chickens. J Appl Poult Res 17:79–86 6. Idowu OMO, Ajuwon RO, Oso AO, Akinloye OA (2011) Effect of
zinc supplementation on laying performance, serum chemistry and Zn residue in tibia bone, liver, excreta and egg shell of laying hens. Int J Poult Sci 10:225–230
7. Stofanikova J, Saly J, Molnar L, Sesztakova E, Bilek J (2011) The influence of dietary zinc content on mechanical properties of chick-en tibiotarsal bone. Acta Vet (Belgrade) 61:531–541
8. Sahraei M, Janmmohamdi H, Taghizadeh A, Cheraghi S (2012) Effect of different zinc sources on tibia bone morphology and ash content of broiler chickens. Adv Biol Res 6:128–132
9. Olgun O, Yildiz AO (2017) Effects of dietary supplementation of inorganic, organic or nano zinc forms on performance, eggshell quality, and bone characteristics in laying hens. Ann Anim Sci 17(2):463–476.https://doi.org/10.1515/aoas-2016-0055
10. National Research Council (1994) Nutrient requirements of poultry. National Academy Press, Chapter 2, Nutrient requirements of chickens, Washington, DC, p 23
11. Brody T (1997) Nutritional biochemistry. Academic Press, New York, pp 581–591
12. Leeson S (2005) Trace mineral requirements of poultry validity of the NRC recommendations. In: Taylorpickard JA, Tucker LA (eds) Re-defining mineral nutrition, Nottingham, pp 107–117
13. Mezes M, Erdelyi M, Balogh K (2012) Deposition of organic trace metal complexes as feed additives in farm animals. Eur Chem Bull Sect C 1:410–413
14. Wedekind KJ, Hortin AE, Baker DH (1992) Methodology for assessing zinc bioavailability: efficacy estimated for zinc-methio-nine, zinc sulphate, and zinc oxide. J Anim Sci 70:178–187 15. Pierce JL, Shafer BL, Power R, Dawson KA (2005) Nutritional
means to lower trace mineral excretion from poultry without compromising performance. Poult Sci 84:11–16
16. Huang S, Wang L, Liu L, Hou Y, Li L (2015) Nanotechnology in agriculture, livestock, and aquaculture in China: a review. Agron Sustain Dev 35:369–400
17. Hett A (2004) Nanotechnology: small matter. Many unknowns. Swiss Reinsurance Company, Zurich
18. Sahoo A, Swain RK, Mishra SK (2014) Effect of inorganic, organic and nano zinc supplemented diets on bioavailability and immunity status of broilers. Int J Adv Res 2:828–837
19. Zhao CY, Tan SX, Xiao XY, Qiu ZS, Pan JO, Tang ZX (2014) Effects of dietary zinc oxide nanoparticles on growth performance and antioxidative status in broilers. Biol Trace Elem Res 160:361–
367.https://doi.org/10.1007/s12011-014-0052-2
20. Fathi M, Hydari M, Tanha T (2016) Effect of zinc oxide nanopar-ticles on antioxidant status, serum enzyme activities, biochemical parameters and performance in broiler chicken. J Livestock Sci Technol 4(2):7–13
21. Zhao Y, Li L, Zhang PF, Liu XQ, Zhang WD, Ding ZP, Wang SW, Shen W, Min LJ, Hao ZH (2016) Regulation of egg quality and lipids metabolism by zinc oxide nanoparticles. Poult Sci 95:920–
933.https://doi.org/10.3382/ps/pev436
22. ASAE (2001) Standards S459: shear and three point bending test of animal bone. American Society of Agricultural Engineers, St. Joseph, p 596
23. Wilson JH, Ruszler PL (1996) Effects of dietary boron supplemen-tation on laying hens. Br Poult Sci 37:723–729.https://doi.org/10. 1080/00071669608417902
24. Armstrong TA, Flowers WL, Spears JW, Nielsen FH (2002) Long-term effects of boron supplementation on reproductive characteris-tics and bone mechanical properties in gilts. J Anim Sci 80:154–
161.https://doi.org/10.2527/2002.801154x
25. Skujins S (1998) Handbook for ICP-AES (Varian-vista). A short guide to vista series ICP-AES operation, version 1.0. Varian Int. AG, Zug, Switzerland
26. SPSS (2008) SPSS statistics for windows, release 17.0. SPSS, Inc., Chicago
27. Tabatabaie MM, Aliarabi H, Saki AA, Ahmadi A, Siyar SA (2007) Effect of different sources and levels of zinc on egg quality and laying hen performance. Pak J Biol Sci 10:3476–3478
28. Tsai YH, Mao SY, Li MZ, Huang JT, Lien TF (2016) Effects of nanosize zinc oxide on zinc retention, eggshell quality, immune response and serum parameters of aged laying hens. Anim Feed Sci Technol 213:99–107
29. Mohammadi V, Ghazanfari S, Mohammadi-Sangcheshmeh S, Nazaran MH (2015) Comparative effects of zinc-nano complexes, zinc-sulphate and zinc methionine on performance in broiler chickens. Br Poult Sci 56:486–493.https://doi.org/10.1080/ 00071668.2015.1064093
30. Mao SY, Lien TF (2017) Effects of nanosized zinc oxide and γ-polyglutamic acid on eggshell quality and serum parameters of aged laying hens. Arch Anim Nutr 71(5):373–383.https://doi.org/10. 1080/1745039X.2017.1355600
31. Mabe I, Rapp C, Bain MM, Nys Y (2003) Supplementation of a corn-soybean meal diet with manganese, copper, and zinc from organic or inorganic sources improves eggshell quality in aged lay-ing hens. Poult Sci 82:1903–1913.https://doi.org/10.1093/ps/82. 12.1903
32. Krebs NF (2000) Overview of zinc absorption and excretion in the human gastrointestinal tract. J Nutr 130:1374–1377
33. Ao T, Pierce J, Power R, Pescatore AJ, Cantor AH, Dawson KA, Ford MJ (2009) Effect of different forms of zinc and copper on the performance and tissue mineral content of chicks. Poult Sci 88: 2171–2175.https://doi.org/10.3382/ps.2009-00117
34. Rossi P, Rutz F, Anciuti MA, Rech JL, Zauk NHF (2007) Influence of graded levels of organic zinc on growth performance and carcass traits of broilers. J Appl Poult Res 16:219–225
35. Mohanna C, Nys Y (1999) Effect of dietary zinc content and sources on the growth, body zinc deposition and retention, zinc excretion and immune response in chickens. Br Poult Sci 40:108– 114
36. Midilli M, Salman M, Muğlali ÖH, Çenesiz S, Ormanci N, Pakdil M, Gürcan IS (2015) The effects of different zinc sources and mi-crobial phytase supplementation on the tibial bone properties, strength and Zn mineralization broilers fed with diet low phospho-rus. J Fac Vet Med Kafkas Univ 21:607–614
37. Shelton JL, Southern LL (2007) Interactive effect of zinc, copper and manganese in diets for broilers. Int J Poult Sci 6:466–469
38. Swiatkiewicz S, Koreleski J (2008) The effect of zinc and manga-nese source in the diet for laying hens on eggshell and bones quality. Vet Med 53:555–563
Publisher’s Note Springer Nature remains neutral with regard to juris-dictional claims in published maps and institutional affiliations.