TORNALAMADA REGRESYON ANALİZİ VE BULANIK MANTIK KULLANARAK, KESME KUVVETLERİ ÜZERİNDE İLERLEME VE TAKIM
GEOMETRİSİNİN ETKİLERİNİN ANALİZİ
Hacı SAĞLAM
Selçuk Üniversitesi, Teknik Bilimler Meslek Yüksekokulu, 042031, Konya, TURKİYE
Özet
İşleme işlemleri sırasında kesme kuvvetlerinin doğru tahmini, takım durumunun kontrolü, güç tüketimi ve işleme parametrelerinin optimizasyonu için son derece önemlidir. Kesme kuvvetlerini etkileyen çeşitli işleme parametreleri vardır, fakat bu etkileri etkin bir şekilde sayısallaştırmaya ihtiyaç duyulmaktadır. İşleme parametrelerini ve takım geometrisini optimize etmek için kesme kuvvetleri ile ilgili bazı tahmin modelleri teşkil edilmelidir. Bu sebeple, bu çalışmada bulanık kurallara dayalı bir uzman sistem açıklandı. Ayrıca belirli parametreleri ele geçirmek için regresyon modelleri geliştirildi. Fuzzy (bulanık) bir uzman sistem geliştirmek için veri elde etmede bir dizi tornalama deneyleri gerçekleştirildi. Buna ilaveten, deneysel veriler hangi giriş parametrelerinin önemli olduğunu ve giriş parametreleri için kesme kuvvetleri ve fuzzy setleri tasarımında ne kadar etkili olduğunu belirlemek için varyans analizine (ANOVA) tabi tutulmuştur. Fuzzy modeli ölçülen veri kümeleri ile eğitildi. Ayrıca regresyon modelleri ile fuzzy modelinin bir mukayesesi yapıldı. Kesme kuvveti değerleri için tahmini fuzzy modeli daha iyi tahmin yapabilir bulunmuştur. Deneysel veriler kullanılarak iki model test edildi ve sonuçlar kesme kuvvetlerinin ortalama tahmininin regresyon analizi ile %92.78, fuzzy model ile %96.2 tamlıkta tahmin edildiğini göstermiştir.
Anahtar Kelimeler: Takım geometrisi, Kesme kuvvetleri, Regresyon analizi, Varyans analizi, Fuzzy uzman sistem.
*
* Corresponding author: Hacı Sağlam, Tel: +90332 223 2352; Fax: +90 332 241 0185
ANALYSIS of the INFLUENCES of FEED RATE and TOOL GEOMETRY on CUTTING FORCES USING REGRESSON ANALYSE and FUZZY LOGIC in
TURNING Abstract
Accurate estimation of cutting forces during in-machining processes is highly important for the purpose of controlling tool condition, power requirement and tool life for optimising machining parameters. There are various machining parameters affecting cutting forces, but those effects are required to quantify effectively. In order to optimise machining parameters and tool geometry some predictive models dealing with cutting forces must be set up. For this reason, a fuzzy rules based expert system was explained in this study. Regression models were also developed in order to capture specific parameters. Series of turning experiments were performed in order to obtain data for the development of a fuzzy expert system. In addition that the experimental data is subjected to analysis of variance (ANOVA) to determine which input parameters are significant and how much effective on cutting forces and the design of fuzzy sets for input parameters. The fuzzy model was trained with measured data set. A comparison of fuzzy model with regression models was also performed. Predictive fuzzy model are found to be capable of better estimation for cutting force values. Two models were tested using experimental data and the results showed that average estimation of cutting forces with regression was 92.78% while 96.2% with fuzzy model. But predicting performance of fuzzy model cannot be discussed in nonlinear problem solving even near out of training ranges.
Keywords: Tool geometry; Cutting forces; Regression analysis; Analysis of Variance; Fuzzy expert system.
1. Introduction
In metal cutting operations, optimum determination of tool geometry and cutting parameters require detailed investigations of their effects on cutting forces. The tool geometry has an important factor on cutting forces and cutting forces are essential source of information about productive machining. The cutting forces acting on the tool
are an important aspect of machining. The knowledge about cutting forces is required for estimation of power requirements and for the design of machine tool elements, tool-holders and fixtures. Vital information on cutting forces is significant because it denotes information involving the cutting process, workpiece material, cutters, fixturing elements and machine tool itself [1]. Thus it provides a key basis to constitute to the basic understanding of the kinematics and dynamics of machine tools and machining processes [2]. They can also be used to optimise cutter geometry and assess the likelihood of workpiece distortion. In milling processes, the cutting force on the cutter varies due to change in material engagement volume and cutting direction due to variability of the surface. The sudden change in material engagement and cutting direction result in sudden changes in cutting force magnitude that may cause tool breakage and affect the machined surface quality [3].
Cutting force signals captured in-process is widely considered as a base on tool condition monitoring systems that reduce machining cost and provide continuity on product quality. In these systems it is established correlations between measurable variables (e.g. cutting forces, temperature, vibrations) and non-measurable directly relevant parameters (such as tool wear, tool breakage, surface roughness). If the data obtained by experimentation are analysed by prediction method such as statistical methods or expert systems the desired outputs can be estimated. Some of the researchers [4, 5, 6] have developed intelligent methods to monitor tool condition parameters such as tool wear, surface roughness, etc. using cutting force components. In metal cutting processes, an efficient monitoring system can maintain machine tools in good condition and detect relevant output. Sharma et al. [7] developed model using adaptive neuro-fuzzy inference system for predicting tool wear using cutting forces, vibrations and acoustic emissions. They could establish close relation between the predicted and the actual tool wear values. Balazinski and Jemielniak [8] introduced a fuzzy decision support system for the estimation of depth of cut and flank wear during operation. This assessment is based on feed rate and two cutting force components. Haber et all. [9] developed an indirect cutting force controller using fuzzy techniques and current sensor providing the cutting force signals for end milling process.
The cutting forces are mainly affected by many factors such as cutting parameters (cutting speed, feed rate, depth of cut) undeformed chip thickness, cutting tool material, tool geometry (approaching angle, rake angle, etc.) and tool wear. Cutting force signals vary almost linearly with tool wear rate. The cutting forces are determined mainly by depth of cut and feed rate, respectively, more than by cutting speed. The cutting process is defined as being a stochastically stationary process so that its prediction cannot be made on the basis of its theoretical analysis. Because the cutting force components are known to be very sensitive even to the smallest changes in the cutting process. Therefore, instead of calculating the cutting force theoretically, measuring them in process by dynamometers is preferred [10]. If the cutting force calculations are verified by experimental measurements, the formulations about calculations are accepted as reliable and thus continuous force measurement is limited. In this context Haci et al. [11] performed the comparison of measured and calculated results of cutting force components and temperature for different cutting parameters and tool geometries to analyze their effects cutting forces and tool tip temperature [12].
Since metal cutting mechanics is quite complicated and indicate nonlinear characteristic it is very difficult to develop a comprehensive model which involves all cutting parameters affecting machining variables. Even all the cutting parameters are defined their effective levels cannot be determined certainly. Therefore it is essential to construct a predictive model using statistical and fuzzy logic when the data obtained by experimentation is analyzed.
The objective of this study is to develop a model to evaluate the cutting parameter (e.g. feed rate) and tool geometry (including rake angle and entering angle) on cutting forces and then formulate the model for all parameters to predict cutting forces using fuzzy logic and regression analyze. Finally, the models are compared with actual force values for their prediction capability.
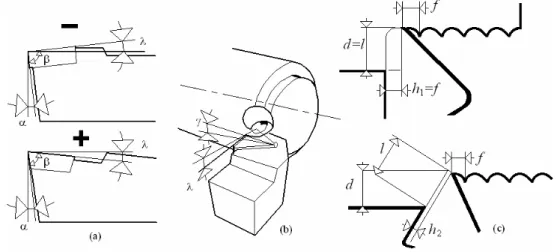
1.1. Tool geometry
The geometry of cutting tool is defined by certain basic tool angles and thus precise definitions of these angles are essentials. The most important factor that determines the chip cross-section is the approaching angles of tooling system. When approaching angle is decreased the chip thickness and pressure on the cutting length also decreased, but it has a relatively low influence on the cutting forces. Since the main
cutting edge enters and leaves the cutting zone suddenly at 900 of approaching angle it is subjected to maximum loading and unloading. The angle produces a large feed force and also smaller radial force at 900. Approaching angle directs cutting forces in order to provide stability during cutting and play important role on chip forming.
From point of view of macro geometry level, the insert is inclined in relation to the horizontal plane. A plane parallel to the main cutting edge contains the inclination angle ( , Fig.1.a). This angle can be take positive or negative value. This is the angle of insert seat in the tool holder. Perpendicular to the main cutting edge of the tool the rake angle/side rake angle ( ) is a measure of the edge in relation to the cut itself (Fig. 1.b). These two angles only coincide when the tool is fed along a line at 900 to the axis of workpiece, namely cutting action is orthogonal. In oblique cutting, when approaching angle is (Fig. 1.c), then the cutting action is oblique and the angle is called back rake angle. Rake angle has an important effect on all the cutting force components, cutting ability and also on the tool tip temperature. Positive rake angle produces higher shear angle and therefore, it leads to reduction of cutting forces. But excessive value of this angle causes tool breakage. If negative rake angle is set the tool edge strengthened against hammering effects heavy machining loads. In contrast the tools having positive rake angle negative rake tools produce high specific cutting pressure consequently high cutting forces.
0
0 900
Fig. 1 Position of inclined angle and approaching angle
In recent years, since researchers have arrived appropriated situation about standardised profile of the cutting tools the studies have become focusing on edge
geometry. Instead of standard sharp tool honed and chamfered tools have become popular. Theile et al. [13] showed that cutting edge geometry has significant impact on surface integrity and residual stresses in finish machining and large hone radius tools produced more compressive stresses. As tools wear, their edge geometry may change and thus affect the part surface quality and cutting forces. Performance of cutting tools is highly dependent on the cutting parameters and cutting conditions, i.e. cutting speed, feed, feed-rate, and depth of cut. Increased cutting forces depend on tool geometry result in increased tool stresses and tool temperatures at the cutting zone. Elevated temperature at the cutting zone leads chemical/diffusion wear mechanism. Therefore, proper edge preparation is required to increase the strength of cutting edge and attain favourable surface characteristics on finished metal parts. Edge geometry of the tool is an important factor affecting surface quality.
1.2. Feed rate
Feed rate is effective on all cutting force signals. In the case of increasing feed rate, cutting forces, especially feed force increases and residual stresses change from compressive to tensile and residual stresses more compressive as hardness of workpiece increases [13]. Koenig et al. [14] also reported that an increase in feed rate raises the compressive residual stress maximal and deepens the affected zone. Increased feed rate and chip thickness exert a major influence on cutting forces. Force control for turning and milling can be obtained by adjusting the federate and thereby the chip thickness.
2. Experimental procedure 2.1. Experimental study and results
In order to investigate the influence of tool geometry and cutting parameter on cutting forces, two tool angle including inclination angle and approaching angle and feed rate as cutting parameter were specified as independent input parameters. The cylindrical turning experiments were performed on medium carbon steel (Ç1050 AISI1050) in size of 40x100 mm with carbide inserts (TCMT 110204–19 P20-P30) in dry cutting conditions. The desired responses were three cutting force components. A three-factor four-level full factorial design was used and totally 96 experiments were conducted. During test cutting speed and depth of cut were kept
constant as =143 m/min and 1 mm, respectively. The factor and factor levels are summarized in Table 1.
c
v
Table 1 Factor and factor levels Controllable factors Factor levels Inclined angle () -70; -50; -30; 30; 50; 70
Approaching angle () 450; 600; 750; 900;
Feed rate (mm/rev) ( f ) 0.16; 0.20; 0.25; 0.30
Cutting forces were measured with a three-component compact force dynamometer (TeLC DKM 2000) and transferred from over serial port to the PC directly for further evaluation (Fig. 2).
Fig. 2 Experimental view of cutting force registering in turning process
The graphical analysis of the experimental data had been conducted in a previous study [15]. Some of the experimental results are shown in Table 2.
3. Statistical analysis of experimental data
The statistical methods are important indicators about which parameter has how much effects on the product quality or process performance. When the changing is an important part of discussion dealing with quality, analysis of variance (ANOVA) is an important method used in interpreting of experimental data and in essential decisions.
This analyze is a statistical decision making device used to find differences in average performance of samples. Therefore, the experimental data obtained have been subjected to ANOVA test.
3.1. Analysis of variance
The selected patterns were subjected to analysis of variance. In this model 90 experiments were subjected to analyze and the residual 6 experiments were used for test. According to three factors ( ,, f), cutting force components as output parameters ( and ) and were evaluated. ANOVA were conducted separately for each component of cutting forces. In addition that plots of essential factors corresponding to each ANOVA were constructed to provide detailed analysis of significant factors related to cutting forces.
c
F ,Ff Fr
Table 2 Experimental data set
Input parameters Experimental results Exp. No. f Fc Ff Fr 1 0,16 -3 45 356 220 134 2 0,16 -3 60 341 234 125 3 0,16 -3 75 333 238 103 4 0,16 -3 90 331 260 102 5 0,2 -3 60 407 270 145 6 0,2 -3 75 398 278 138 7 0,2 -3 90 395 285 112 8 0,25 -3 45 506 294 156 9 0,25 -3 60 485 331 143 81 0,2 7 60 345 195 96 82 0,2 7 90 335 231 55 83 0,25 7 45 429 202 115 84 0,25 7 60 411 204 109 85 0,25 7 75 402 228 85 86 0,25 7 90 399 236 62 87 0,3 7 45 496 205 116 88 0,3 7 60 475 236 115 89 0,3 7 75 464 265 92 90 0,3 7 90 461 268 72
The statistical significances of the model for the cutting force were evaluated by the F-test of ANOVA. When the values of “Prob.> F” for the term of models are less than 0.05 (i.e.=0.05 risk, or 95% confidence level), this indicates that the obtained models are considered to be statistically significant and the terms in the model have a significant effect on the responses. The determination coefficients ( 2
R ) is approaches to unity, the better the response model fits the actual data.
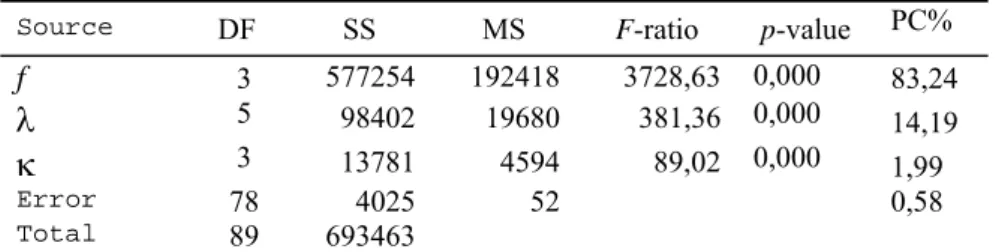
The ANOVA results for experimental data are given in Table 3. Table 3 ANOVA table for cutting force components a) Analysis of Variance for main cutting force Fc
Source DF SS MS F-ratio p-value PC%
f 3 577254 192418 3728,63 0,000 83,24 5 98402 19680 381,36 0,000 14,19 3 13781 4594 89,02 0,000 1,99
Error 78 4025 52 0,58
Total 89 693463
b) Analysis of Variance for feed force Ff
Source DF SS MS F-ratio p-value PC%
f 3 98319 32773 86,67 0,000 37,54 5 105856 21171 55,99 0,000 40,41 3 28254 9418 24,91 0,000 10,79
Error 78 29495 378 11,26
Total 89 261924
c) Analysis of Variance for radial force Fr
Source DF SS MS F-ratio p-value PC%
f 3 11384 3795 25,20 0,000 7,04 5 83255 16651 110,57 0,000 51,48 3 55324 18441 122,46 0,000 34,21
Error 78 11746 151 7,26
Total 89 161710
It is important to observe p-values in the tables. For three cutting force components, all three factors are apparently significant. As seen in Table 3.a, the most effective factor on is feed rate, inclined angle and approaching angle follow this. The situation is same for but with different F-ratios (Table 3.b). According to Table 3.c, the effective factors on can be sequenced as approaching angle, inclined angle and feed rate, respectively.
c F f F r F
3.2. Analysis of regression
The goal of the multiple regression analysis in this study was to determine the dependency of cutting force components to feed rate and tool geometry. In case of more than one factors affecting an event are present it is possible investigating the cause-effect relation with multiple regression analysis. A statistical software package (MINITAB Version 15.0) was employed in model training. In this model cutting force components were considered as dependent variable while feed rate, inclined angle and approaching angle were independent variables. As a result of multiple linear regressions analysis the obtained equations and calculated force values (Table 4.) are as follows:
(1) 2 2 2 c f r = 135 +1487. -6,37. -0,69. 99,1% = 72,6 +623. -4,98. 1,03. 72,6% = 196 +178. -5,32. -1,47. 81, 4% F f R F f R F f R
Accuracy is a measure of the closeness of the predicted value to the measured one. For each single data set, the accuracy is the ratio of the absolute difference of the predicted and the measured values to the measured value. The accuracy is expressed in percentage p m i p = F F x100 % F (2) where, p
F : Prediction accuracy of data set i
p
F : Measured F corresponding to data set i p
The model accuracy is the average of the accuracy values of all data sets. n i 1 n i
(3)where, is model prediction accuracy and nis number of data sets in the training data set. The calculated error values for dependent variables as , and for 90 experiments according to equation 2 and 3 are given in Table 5.
c
Table 4 The result of regression analysis
Exp. Regression Regression accuracy No. Fc Ff Fr Fc Ff Fr 1 361,0 233,6 174,3 1,40 6,17 30,07 2 350,6 249,0 152,2 2,82 6,42 21,79 3 340,3 264,5 130,2 2,19 11,12 26,40 4 329,9 279,9 108,1 0,32 7,66 6,02 5 410,1 273,9 159,4 0,76 1,46 9,90 6 399,8 289,4 137,3 0,44 4,10 0,50 7 389,4 304,8 115,3 1,42 6,96 2,91 8 494,8 289,6 190,3 2,21 1,48 21,99 9 484,5 305,1 168,3 0,11 7,83 17,66 . . . . . . . . . . . . . . . . . . . . . 81 346,4 224,1 106,2 0,41 14,94 10,58 82 325,7 255,0 62,1 2,77 10,41 12,84 83 431,1 239,8 137,1 0,49 18,73 19,23 84 420,8 255,3 115,1 2,37 25,14 5,56 85 410,4 270,7 93,0 2,09 18,75 9,42 86 400,1 286,2 71,0 0,27 21,27 14,45 87 505,5 271,0 146,0 1,91 32,19 25,87 88 495,1 286,4 124,0 4,23 21,37 7,79 89 484,8 301,9 101,9 4,47 13,92 10,77 90 474,4 317,3 79,9 2,91 18,41 10,92
Table 5 Calculated error table Regression Fc Ff Fr Mean error ( ) 1,54 8,71 11,41 Verification 98,46 91,29 88,59
The above model obtained can be used to predict the cutting force components within the limits of the factors studied. The results of comparison were proved to predict values of the cutting force values close to those readings recorded experimentally with a 95% confident interval.
4. The fuzzy expert system
Expert systems are computer programs embodying knowledge about a narrow domain for solving problems related to that domain [16]. Fuzzy sets and logic is a discipline that has proved itself successful in automated reasoning of expert systems
[17]. It deals with the theory of vague reasoning in order to model human-like reasoning problems of real life. In recent past, fuzzy logic has found high degree of applicability in development of expert systems and the same has been selected as the reasoning mechanism in development of presented rule bases.
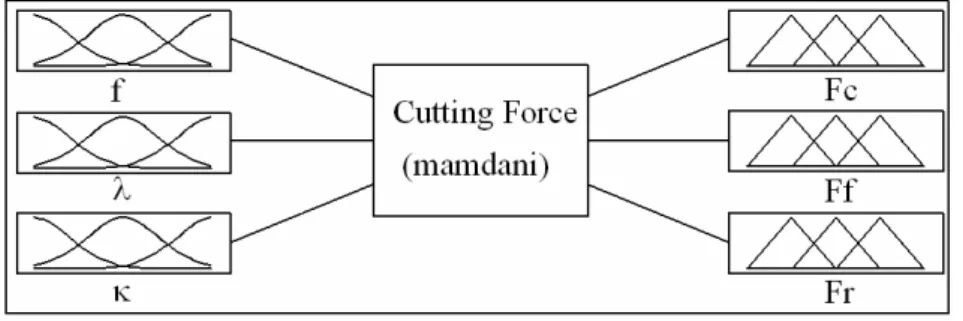
Knowledge-base is considered as the heart of any expert system. For the current research work, the knowledge from the experimental data, numeric optimization, and ANOVA results was used for its development. Fuzzy logic enables to easily model linear and nonlinear mathematical functions, namely fuzzy system provide interpolative properties. The set of fuzzy rules defines a fuzzy estimation surface. The accuracy of interpolation depends on the number of membership functions, their position, their shape and the rules used to express the relationships between these membership functions. In current research, Mamdani max-min interference for interference mechanism and centre of gravity (Centroid) defuzzier formula method for defuzzification were used, because these operators assure a linear interpolation of output between the rules. The structure of fuzzy system deal with this study is shown in Fig. 3.
Fig. 3 The structure of fuzzy expert system
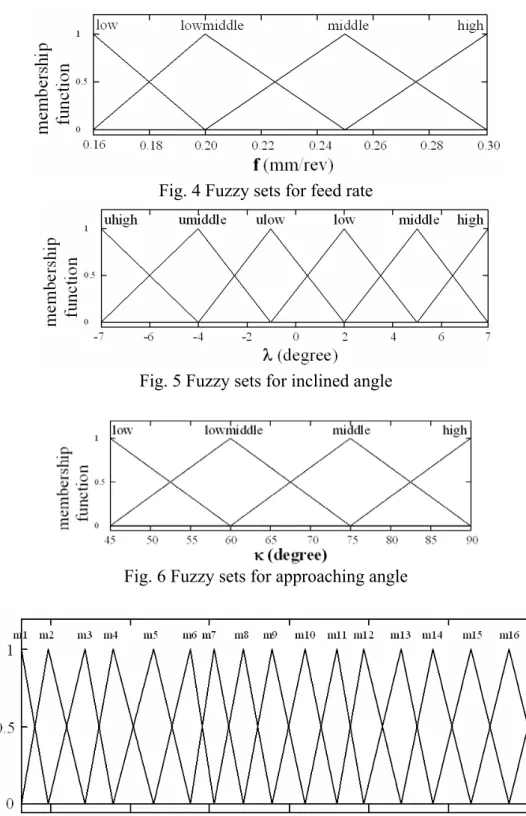
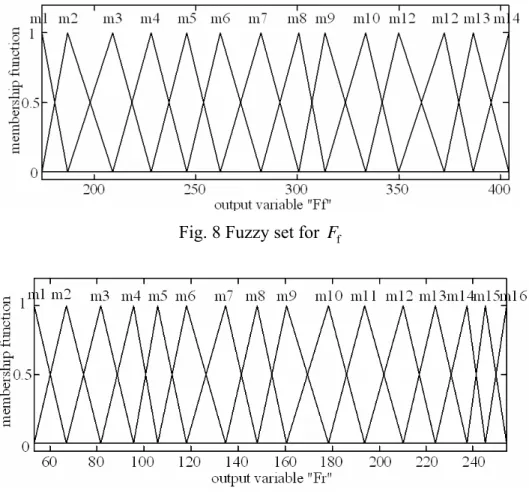
After obtaining the data from experiments, the experimented range of input and output variables were divided into fuzzy sets as linguistic variable in the next step. These membership functions helped converting to numeric variables into linguistic terms. The experimented range of more significant variables is divided into more number of fuzzy sets as compared to that of lesser significant variable. Seven fuzzy sets were designed for the output variables ( and ) applicable to both of the strategies. For all of the variables, equally distributed triangular shaped fuzzy sets were utilized. The details of the sets are shown in Figs. 4-9.
c
Fig. 4 Fuzzy sets for feed rate
Fig. 5 Fuzzy sets for inclined angle
Fig. 6 Fuzzy sets for approaching angle
Fig. 8 Fuzzy set for Ff
Fig. 9 Fuzzy set for Fr 4.1. Fuzzy rules
The relationship between inputs and output in a fuzzy system is characterized by set of linguistic statements which are called fuzzy rules [18]. The number of fuzzy rules in a fuzzy system is related to the number of fuzzy sets for each input variable. In this research work, there are 6 possible rules. Expressions and the abbreviation details of these fuzzy sets, giving minimum values of estimation error, are provided in Table 6 and 7.
Table 6 Expressions used in fuzzy sets of F ,c Ffand Fr
f
-7 uhigh 0,16 low 45 low -5 umiddle 0,20 low-middle 60 low-middle -3 ulow 0,25 middle 75 middle
3 low 0,30 High 90 high
5 middle 7 high
Table 7 Fuzzy rules
Inputs Rules table
Exp. No f f Fc Ff Fr
1 0,16 -3 60 low ulow low_middle m4 m4 m6 2 0,16 -3 75 low ulow middle m4 m4 m4 3 0,16 -3 90 low ulow high m3 m5 m4 4 0,2 -3 45 low_middle ulow low m9 m5 m7 5 0,2 -3 60 low_middle ulow low_middle m7 m6 m7 6 0,2 -3 75 low_middle ulow middle m6 m6 m7 7 0,2 -3 90 low_middle ulow high m6 m7 m5 8 0,25 -3 45 middle ulow low m12 m7 m8 9 0,25 -3 60 middle ulow low_middle m11 m9 m7
- - - - - - -
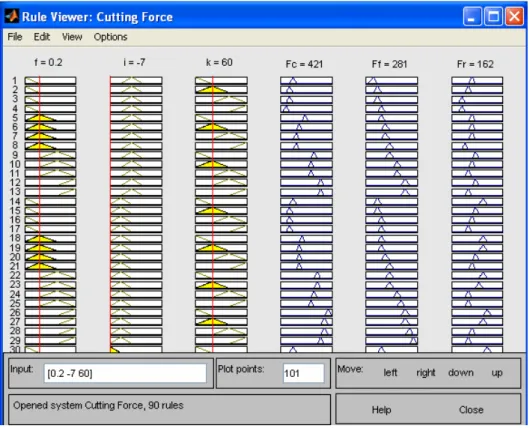
81 0,2 7 60 low_middle high low_middle m4 m2 m4 82 0,2 7 90 low_middle high high m3 m4 m1 83 0,25 7 45 middle high low m8 m2 m5 84 0,25 7 60 middle high low_middle m7 m2 m5 85 0,25 7 75 middle high middle m7 m4 m3 86 0,25 7 90 middle high high m6 m4 m1 87 0,3 7 45 high high low m12 m2 m5 88 0,3 7 60 high high low_middle m11 m4 m5 89 0,3 7 75 high high middle m10 m6 m3 90 0,3 7 90 high high high m10 m6 m2 The membership function of system could be obtained by using Mamdani max-min interference as max=1 in Matlab 7.1. As seen in Fig. 10, the values of main cutting force ( ), feed force ( ) and radial force ( ) for f=0.2 mm/rev, and
were obtained as 421 N, 281 N and 162 N, respectively. c F 0 f F Fr i 70 60
4.2. Testing and comparison
For the purpose of testing and comparison of expert systems cylindrical turning experiments were done upon workpieces at constant cutting speed and depth of cut, using turning tools having different inclined and approaching angles. The cutting force components were measured at four different feed rates. In order to compare the estimated values of cutting forces from the regression model and fuzzy system with the actual data achieved from experiments six of data set as sample were selected.
Fig. 10 The example calculation of cutting force components
Comparisons of predicted and experimental test results and mean error and accuracy of predicted results (as regression analysis and fuzzy system) for 90 training set data and 6 test data are shown in Table 8. In addition that, the actual and estimated data for 6 sample test were given graphically in Fig. 11. As seen in the table, the error of sample test is very close to training set data. The term prediction error ( ) can be defined as follows: p e actual fuzzy 1 p n 1 ( i e F F n
(4) If the cutting tools undergoes changing of tool geometry due to possible tool wearor tool breakage the abnormal increase in wear would be reported by increase in cutting force. This proves that fuzzy expert system technique incorporating cutting forces as major input can be used to diagnose tool wear states in tool condition monitoring systems.
Table 8 Comparison of predicted and experimental test results Predicted results with
Input
Parameters Regression analysis Fuzzy system Measured results
Test No. f Fc Ff Fr Fc Ff Fr Fc Ff Fr 1 -7 0,20 60 434 293 178 421 281 162 426 288 177 2 -5 0,25 60 496 314 178 519 294 175 497 298 175 3 -3 0,16 45 360 232 171 364 219 162 356 220 134 4 3 0,25 75 435 291 115 416 320 120 433 343 132 5 5 0,30 90 486 328 93 479 316 106 479 314 109 6 7 0,20 75 335 240 84 342 208 81 337 224 85 Mean error (%) for 90 exp. 1,54 8,71 11,41 1,90 3,78 5,70
Accuracy (%) for 90 exp. 98,46 91,29 88,59 98,10 96,22 94,30 Mean error (%) for 6 exp. 0,953 6,554 9,771 2,195 3,119 7,653 Accuracy (%) for 6 exp. 99,05 93,45 90,23 97,8 96,88 92,35
Fig. 11 Comparison between measured and estimated values for cutting force components
5. Conclusion
The goal of this study is to develop model based on fuzzy expert system in predicting cutting force components in dry turning. The experimental data of measured cutting force data were used to train the fuzzy system. The developed expert system was found accurate to be capable of estimate cutting forces for the range it has been trained. The fuzzy expert system model was also compared to the regression model. In addition
that the experimental data was applied ANOVA test in order to define how and in which rate the cutting force components affected by input parameters (feed rate, inclined angle and approaching angle). Although metal cutting processes are show non-linear characteristic, as it was expected, the fuzzy system model presented better estimation capabilities than regression model. Because they generally offer the solution models to complex non-linearity problems and their interactions than linear and exponential and regression models can offer. Finally, the predicted results obtained by regression model and fuzzy expert system were compared with experimental result considering 90 experiments and 6 sample test.
Following conclusions can be drawn from the contents of this paper:
1. Fuzzy expert system approach can be utilized for accurate estimation of cutting force components.
2. As the ANOVA test results were investigated, it is seen that the input parameters used in current model can be considered as important, because their effects upon cutting force components are substantially more significant. Feed rate has maximum affect on main cutting force and feed force while inclined angle and is less affective than that. However approaching angle and inclined angle are more effective respectively on radial force.
3. Accuracy of fuzzy expert system was higher than regression analysis, so, utilization of this system can help improve the output quality and reduce production cost of turning process at expense of few seconds required for expert system to process.
4. Since cutting force signals give better real time information about condition of in- machining process, for further study, using cutting force signals as primary input gives better estimation of tool wear in tool condition monitoring systems.
References
[1] Boogert, RM, Kals, HJJ, Van Houten, FJAM. Tool path and cutting technology in computer-aided process planning. Int J Adv Manuf. Technol. 1996;11(3):186 –197.
[2] Zheng, L, Liang, SY. Identification of cutter axis tilt in end milling. J Manuf. Sci. Eng, Trans ASME 1997;119(2):178 –185.
[3] Stori, JA, Wright, PK. A constant engagement offset for 2.5D tool path generation. Manuf. Sci. Eng Division ASME, MED 1998; 8:475–81.
[4] Dimla, D.E., Lister, P.M., Leighton, N., Neural network solutions to the tool condition monitoring problem in metal cutting—a review critical review of methods, Int. J. of Mach. Tools and Manufact. 39 (1997) 1219–1241.
[5] Sick, B. On-line and indirect tool wear monitoring in turning with artificial neural networks: a review of more than a decade of research, Mechanical Systems and Signal Processing 16 (2002) 487–546.
[6] Saglam, H., Unuvar, A., Tool condition monitoring in milling based on cutting forces by a neural Network, Int. J. Production Research, 2003, vol. 41, No. 7, 1519– 1532.
[7] Sharma, V. S., Sharma, S. K., & Sharma, A. K. (2006)., Tool wear estimation for turning operations. Journal of Mechanical Engineering, 57(3), 141–168.
[8] Balazinski M, Jemielniak K. Tool conditions monitoring using fuzzy decision support system. In: V CIRP international conference on monitoring and automatic supervision in manufacturing – AC_98, Miedzeszyn near Warsaw; 20–21 August, 1998. p. 115–21.
[9] Haber RE, Peres CR, Alique A, Ros S, Gonzalez C, Alique JR. Toward intelligent machining: hierarchical fuzzy control for the end milling process. IEEE Trans Control Syst. Technol. 1998; 6(2):188–99.
[10] Saglam, H., Yaldiz, S., Unsacar, F., The effect of tool geometry and cutting speed on main cutting force and tool tip temperature, Materials and Design, 28 (2007), 101-111.
[11] Haci, S., Faruk, U., & Yaldiz, S. (2006). Investigation of the effect of rake angle and approaching angle on main cutting force and tool tip temperature, Int. J. of Mach. Tools and Manufact, 46(2), 132–141.
[12] Haci, S., Faruk, U., & Yaldiz, S. (2006). Investigation of the effect of rake angle and approaching angle on main cutting force and tool tip temperature, International Journal of Machine Tools & Manufacture, 46(2), 132–141.
[13] Thiele, J.D., Melkote, S.N., Peascoe, R.A., Watkins, T.R., Effect of cutting-edge geometry and workpiece hardness on surface residual stresses in finish hard turning of AISI 52100 steel, ASME Journal of Manufacturing Science and Engineering 122 (2000) 642–649.
[14] Koenig, A., Komanduri, R., Toenshoff, H.K., Ackeshott, G., Machining of hard metals, Annals of the CIRP 33/2 (1984) 417–427.
[15] Sağlam, H., , Yalçin, G.,Bıyık, MT., Tornalamada meyil açisi ve yaklaşma açisinin kesme kuvvetleri üzerindeki etkisinin incelenmesi, TMMOB Makine Mühendisleri Odası Konya Şubesi V. Makine Tasarım ve İmalat Teknolojileri Kongresi 17–18 Ekim 2009.
[16] Pham, D. T., & Pham, P. T. (2001). Computational intelligence for manufacturing. CRC Press, LLC.
[17] Konar, A. (2000). Artificial intelligence and soft computing. CRC Pres LLC. [18] Hashmi, K., Graham, I. D., & Mills, B. (2003). Data selection for turning carbon
steel using a fuzzy logic approach. Journal of Material Processing Technology, 135, 44–58.