THE POSITIVE OUTLOOK IN THE LAST QUARTER REVERSED
Zümrüt İmamoğlu* and Barış Soybilgen†
Executive Summary
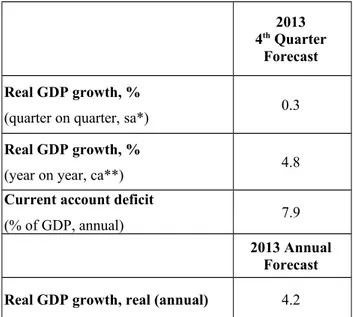
In December, seasonally adjusted Industrial Production Index (IPI) remained constant compared to the previous month. Export volume index decreased by 1.6 percent and import volume index increased by 2.8 percent. December data shows that production was not affected by developments in the second half of December. Industrial production accelerated in the last quarter and exports increased slightly more than imports excluding gold trade. However, deteriorations in expectations and financial indicators are striking. Following December data, Betam's forecasts for the last quarter remained same. Our quarter on quarter growth forecast for the last quarter is 0.3 percent, and the corresponding year on year (YoY) forecast is 4.8 percent. Our growth forecast for 2013 is 4.2 percent. The current account deficit increased significantly in December. Betam expects the current account deficit to GDP ratio, which was 7.2 percent at the end of third quarter, to increase to 7.9 percent at the end of the year. We expect gold excluded current account deficit to fall from 6.9 percent in 2012 to 6.5 percent in 2013.
* Dr. Zümrüt İmamoğlu, Betam, Research Associate. [email protected]
† Barış Soybilgen, Betam, Research Assistant, [email protected]
Table 1: Betam’s quarterly and annual growth rate forecasts
Source: Betam. *sa: seasonally and calendar day adjusted **ca: calendar day adjusted.
2013 4th Quarter
Forecast Real GDP growth, %
(quarter on quarter, sa*) 0.3
Real GDP growth, %
(year on year, ca**) 4.8
Current account deficit
(% of GDP, annual) 7.9
2013 Annual Forecast Real GDP growth, real (annual) 4.2
Economic Outlook and Forecasts:
February 2014
we believe that it will continue being the main driving force behind growth.
Investment indicators improved slightly in December
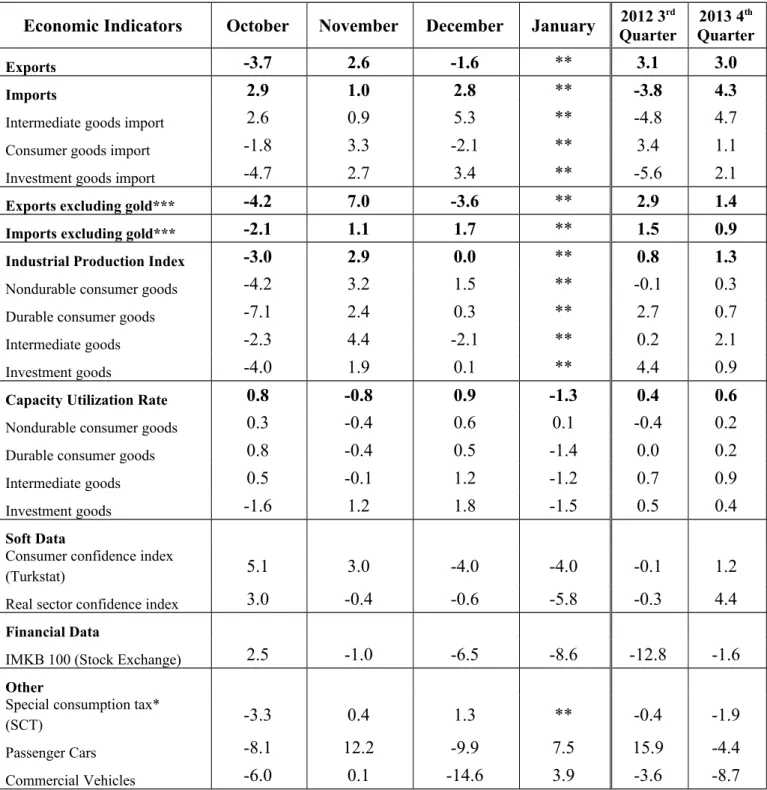
In December, intermediate goods imports and investment goods imports increased by 5.3 percent and 3.4 percent, respectively, from the previous month. However, IPI remained same. On a quarterly basis though, intermediate goods imports and investment goods imports increased by 4.7 percent and 2.1 percent, respectively, and the IPI increased by 1.3 percent.
In January, Turkey went through a difficult time. Data released so far relating to investment expenditures are limited to CUR and the real sector confidence index. In January, from the previous month, CUR decreased by 1.3 percentage points and the real sector confidence index declined 5.8 percent. First signs for investment in 2014 seem to be on the negative side.
Exports declined in December
Figure 2 shows monthly changes of seasonally adjusted import and export volume indices. In December from the previous month, export volume index decreased by 1.6 percent and import volume index increased by 2.8 percent. In the same period, gold excluded exports fell by 3.6 percent, whereas gold excluded imports increased by 1.7 percent.
QoQ export volume index and import volume index increased by 3.0 percent and 4.3 percent
respectively in the fourth quarter. In the same period, gold excluded exports and imports increased by 1.3 percent and 0.9 percent. We expect net exports to subtract from the real growth in the fourth quarter.
Current account deficit in 2013 increased due to gold trade
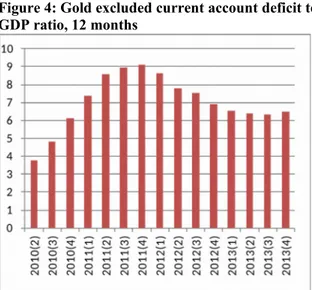
In December, the current account deficit was above expectations at $8.3 billion. The current account deficit for the year end which was $48.5 billion in 2012 increased to $65 billion in 2013. On the other hand, gold excluded current account deficit fell from $54.2 billion to $53.2 billion in the same period. Figure 3 and 4 show gold excluded and gold included current account deficit to GDP ratios. The current account deficit ratio increased throughout 2013, whereas gold excluded current account deficit fell. Betam expects the current account deficit to GDP ratio at the end of 2013 to be 7.9 percent and gold excluded current account deficit ratio to be 6.5 percent. We expect the fall in the current account deficit to accelerate in 2014.
Flight from bonds and equities was limited in December
In December, net capital inflow to Turkey was $3 billion. These inflows were not enough to compensate the $8,3 billion current account deficit. Central Bank's reserves fell by 3.7 billion dollar and net errors and omissions show 1.6 billion dollar capital inflow.
Effects of developments in December on capital flight can be seen in portfolio investment. There was a decrease of $250 million in equities, and $900 million in government bonds. This was compensated by an increase in private bond holdings of $1 billion. Net portfolio investment
overall fell by only $181 million. Comparing to time of Gezi Park protests, outflows from stock exchange were limited. In June, there had been $1.2 billion decrease in equities, and $354 million dollar decrease in government bonds.
Table 2: Monthly and quarterly changes of Betam’s selected indicators (real and sa)
Economic Indicators
October
November
December
January
Quarter2012 3rd Quarter2013 4thExports
-3.7
2.6
-1.6
**
3.1
3.0
Imports
2.9
1.0
2.8
**
-3.8
4.3
Intermediate goods import
2.6
0.9
5.3
**
-4.8
4.7
Consumer goods import-1.8
3.3
-2.1
**
3.4
1.1
Investment goods import-4.7
2.7
3.4
**
-5.6
2.1
Exports excluding gold***
-4.2
7.0
-3.6
**
2.9
1.4
Imports excluding gold***
-2.1
1.1
1.7
**
1.5
0.9
Industrial Production Index
-3.0
2.9
0.0
**
0.8
1.3
Nondurable consumer goods
-4.2
3.2
1.5
**
-0.1
0.3
Durable consumer goods-7.1
2.4
0.3
**
2.7
0.7
Intermediate goods-2.3
4.4
-2.1
**
0.2
2.1
Investment goods-4.0
1.9
0.1
**
4.4
0.9
Capacity Utilization Rate
0.8
-0.8
0.9
-1.3
0.4
0.6
Nondurable consumer goods
0.3
-0.4
0.6
0.1
-0.4
0.2
Durable consumer goods0.8
-0.4
0.5
-1.4
0.0
0.2
Intermediate goods0.5
-0.1
1.2
-1.2
0.7
0.9
Investment goods-1.6
1.2
1.8
-1.5
0.5
0.4
Soft Data
Consumer confidence index
(Turkstat)
5.1
3.0
-4.0
-4.0
-0.1
1.2
Real sector confidence index3.0
-0.4
-0.6
-5.8
-0.3
4.4
Financial Data
IMKB 100 (Stock Exchange)
2.5
-1.0
-6.5
-8.6
-12.8
-1.6
Other
Special consumption tax*
(SCT)
-3.3
0.4
1.3
**
-0.4
-1.9
Passenger Cars
-8.1
12.2
-9.9
7.5
15.9
-4.4
Commercial Vehicles-6.0
0.1
-14.6
3.9
-3.6
-8.7
Source: TurkStat, CBRT, Treasury, ISE, Betam. All series are real (or inflation adjusted) wherever necessary and seasonally adjusted. *This tax is collected on sales of goods such as gas. fuel oils. alcohol. tobacco products and automobiles.
**Data not yet released.
Figure 1: Capacity utilization rate and industrial production index (sa, left axis for CUR and right axis for IPI)
Source: TurkStat, Betam.
Figure 2: Volume indices of exports and imports (sa)
Source: Turkstat, Betam.
Figure 3: Gold included current account deficit to GDP ratio, 12 months
Source: TurkStat, TCMB, Betam.
Figure 4: Gold excluded current account deficit to GDP ratio, 12 months
Source: Turkstat, TCMB, Betam.
Source: CBRT.
Figure 6: YoY increase in IPI in 2012 and 2013 (calendar day adjusted)
. Source: Turkstat.